| Param | Original file | Final file |
|---|---|---|
| Filename | modeM0/AS1T05_183T01_9000006124_45761cztM0_level2.fits | modeM0/AS1T05_183T01_9000006124_45761cztM0_level2_quad_clean.evt |
| Size (bytes) | 618,540,480 | 102,441,600 |
| Size | 589.9 MB | 97.7 MB |
| Events in quadrant A | 6,282,939 | 696,528 |
| Events in quadrant B | 7,355,122 | 638,192 |
| Events in quadrant C | 3,762,724 | 692,461 |
| Events in quadrant D | 4,989,323 | 618,027 |
| Mode SS | |||
|---|---|---|---|
| Quadrant | BADHDUFLAG | Total packets | Discarded packets |
| A | 0 | 134 | 0 |
| B | 0 | 134 | 0 |
| C | 0 | 134 | 0 |
| D | 0 | 134 | 0 |
| Mode M0 | |||
|---|---|---|---|
| Quadrant | BADHDUFLAG | Total packets | Discarded packets |
| A | 0 | 22707 | 1 |
| B | 0 | 26500 | 2 |
| C | 0 | 15698 | 1 |
| D | 0 | 19240 | 1 |
| Mode M9 | |||
|---|---|---|---|
| Quadrant | BADHDUFLAG | Total packets | Discarded packets |
| A | 0 | 9 | 0 |
| B | 0 | 9 | 0 |
| C | 0 | 9 | 0 |
| D | 0 | 9 | 0 |
| Quadrant | Total seconds | Saturated seconds | Saturation percentage |
|---|---|---|---|
| A | 6539 | 310 | 4.740786% |
| B | 6539 | 1262 | 19.299587% |
| C | 6539 | 276 | 4.220829% |
| D | 6539 | 416 | 6.361829% |
Noise dominated data is calculated using 1-second bins in cleaned event files. If a bin has >2000 counts, and if more than 50% of those come from <1% of pixels, then it is considered to be noise-dominated and hence unusable.
| Quadrant | # 1 sec bins | Bins with >0 counts | Bins with >2000 counts | High rate bins dominated by noise | Noise dominated (total time) | Noise dominated (detector-on time) | Marked lightcurve |
|---|---|---|---|---|---|---|---|
| A | 7514 | 6540 | 127 | 127 | 1.69% | 1.94% | 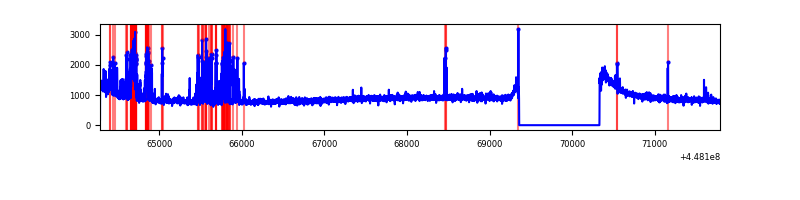 |
| B | 7514 | 6540 | 759 | 759 | 10.10% | 11.61% | 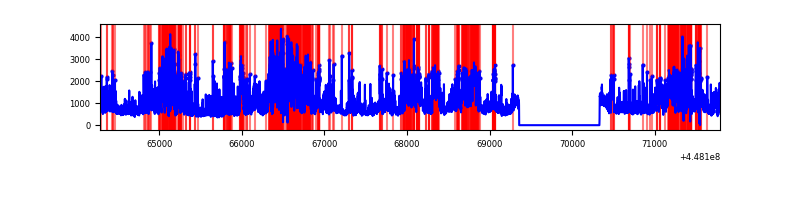 |
| C | 7514 | 6540 | 171 | 171 | 2.28% | 2.61% | 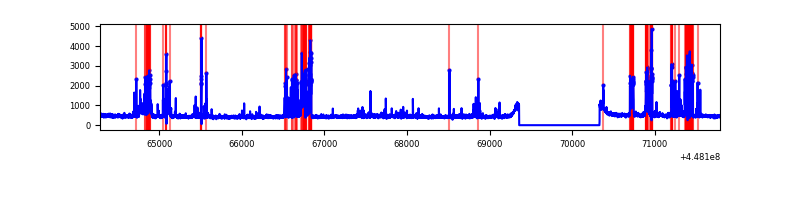 |
| D | 7514 | 6540 | 295 | 295 | 3.93% | 4.51% | 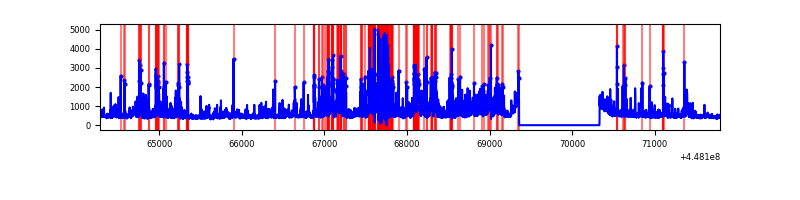 |
Top three noisy pixels from each quadrant. If the there are fewer than three noisy pixels in the level2.evt file, extra rows are filled as -1
| Pixel properties | Quadrant properties | ||||||
|---|---|---|---|---|---|---|---|
| Quadrant | DetID | PixID | Counts | Sigma | Mean | Median | Sigma |
| A | 10 | 83 | 2828045 | 18221.57 | 745 | 730 | 155.2 |
| A | 13 | 248 | 524026 | 3372.55 | 745 | 730 | 155.2 |
| A | 14 | 235 | 23159 | 144.55 | 745 | 730 | 155.2 |
| B | 3 | 112 | 2330972 | 16871.08 | 703 | 684 | 138.1 |
| B | 0 | 189 | 914462 | 6615.67 | 703 | 684 | 138.1 |
| B | 12 | 18 | 573458 | 4146.83 | 703 | 684 | 138.1 |
| C | 14 | 254 | 833114 | 4785.38 | 736 | 739 | 173.9 |
| C | 14 | 220 | 35102 | 197.56 | 736 | 739 | 173.9 |
| C | 3 | 233 | 12799 | 69.33 | 736 | 739 | 173.9 |
| D | 1 | 52 | 746698 | 4121.96 | 718 | 698 | 181.0 |
| D | 7 | 38 | 407301 | 2246.65 | 718 | 698 | 181.0 |
| D | 13 | 249 | 321792 | 1774.18 | 718 | 698 | 181.0 |
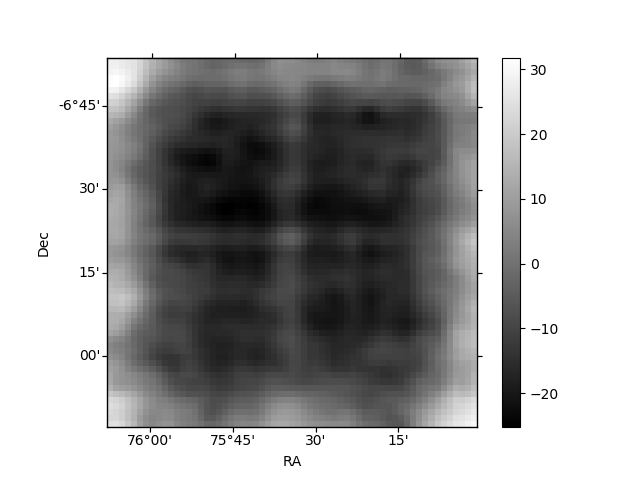
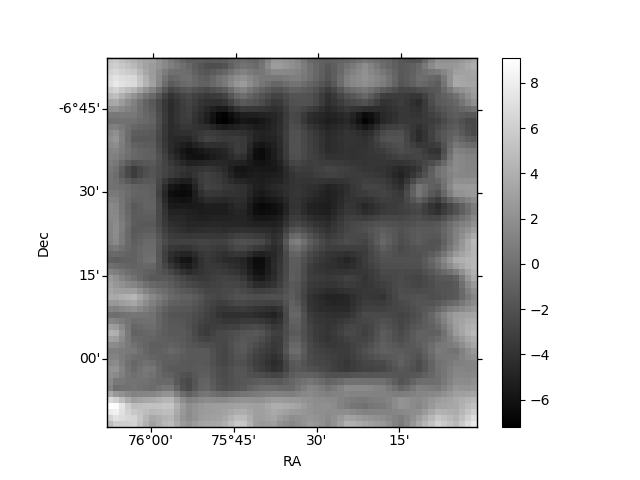
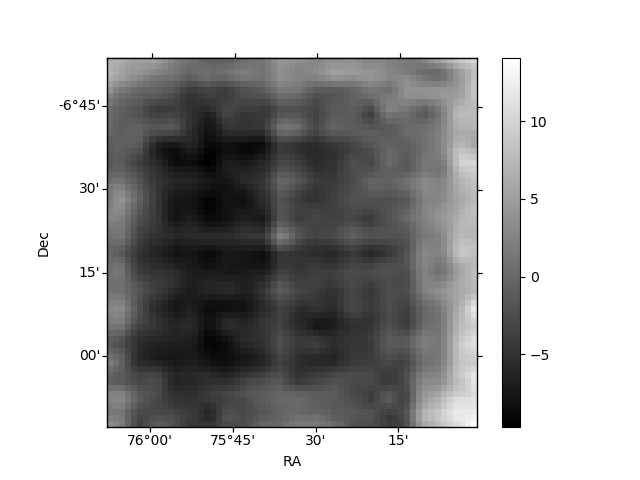
Histogram calculated using DETX and DETY for each event in the final _common_clean file
| Quadrant A | 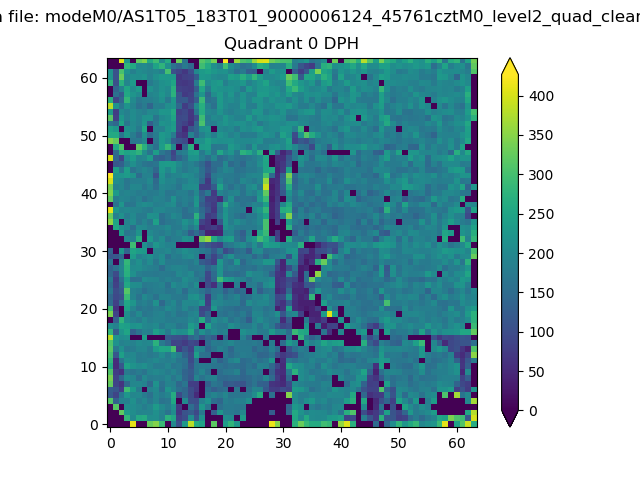 |
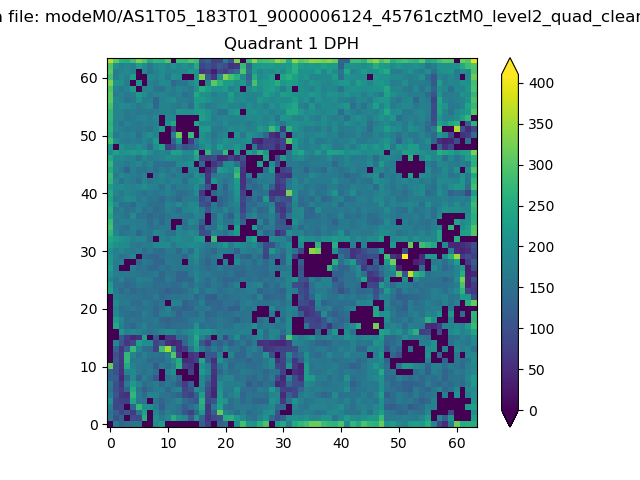 |
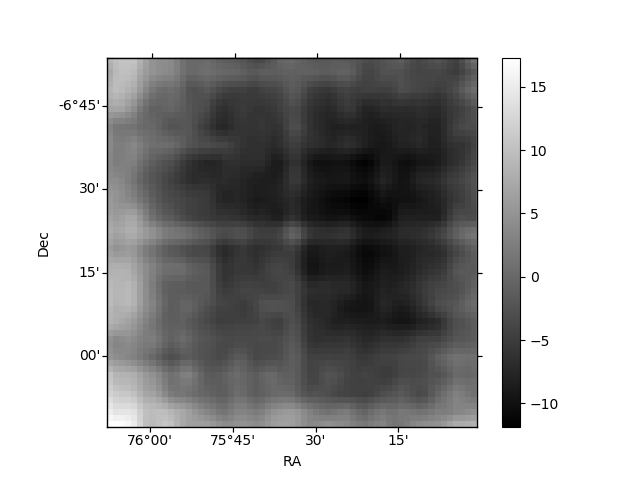
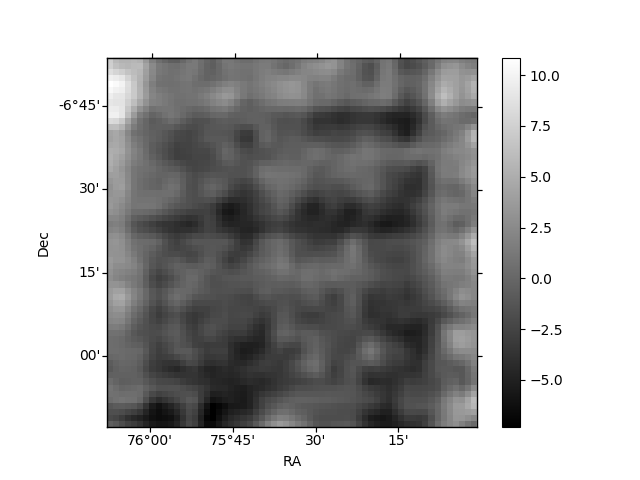
Quadrant B |
|---|---|---|---|
| Quadrant D | 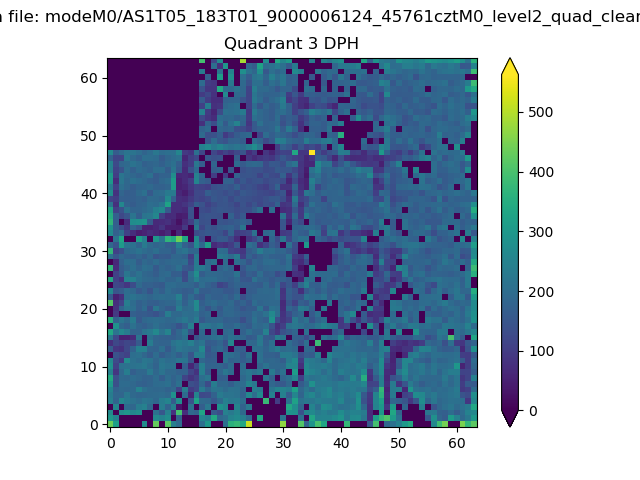 |
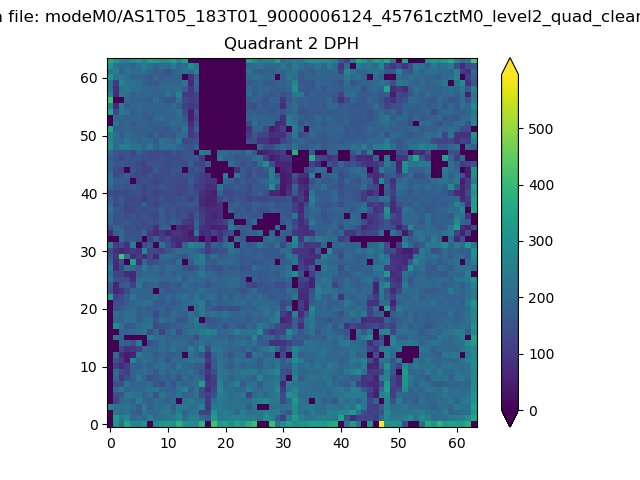 |
Quadrant C |
| Plot type | Count rate plots | Images |
|---|---|---|
| Comparison with Poisson distribution Blue bars denote a histogram of data divided into 1 sec bins. Red curve is a Poisson curve with rate = median count rate of data. |
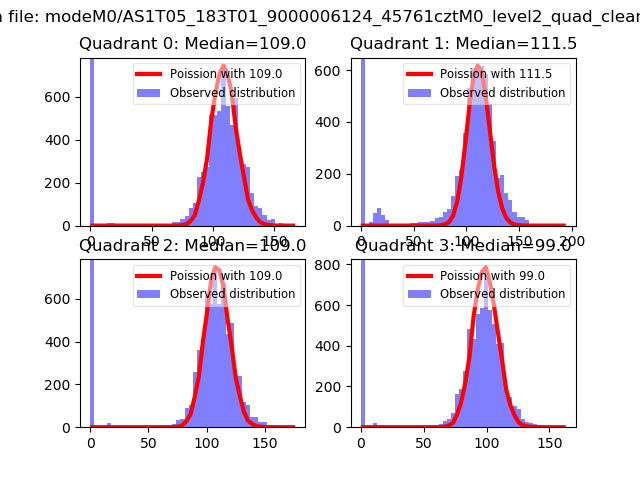 |
 |
| Quadrant-wise count rates Data is divided into 100 sec bins |
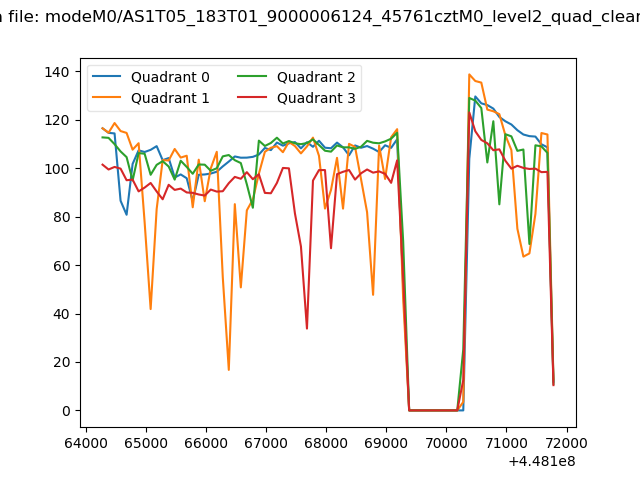 |
|
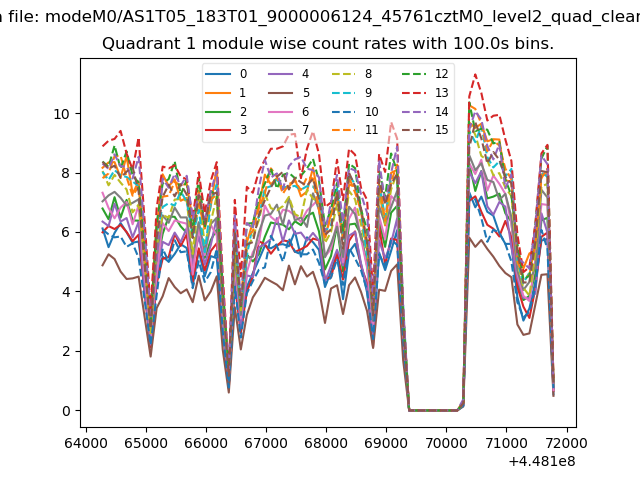
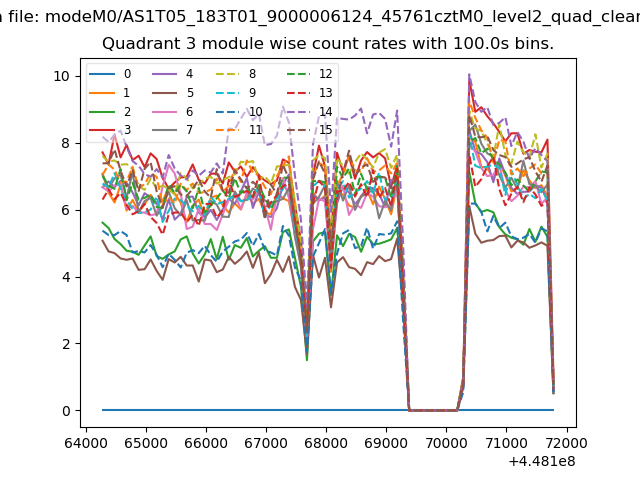
| Module-wise count rates for Quadrant A Data is divided into 100 sec bins |
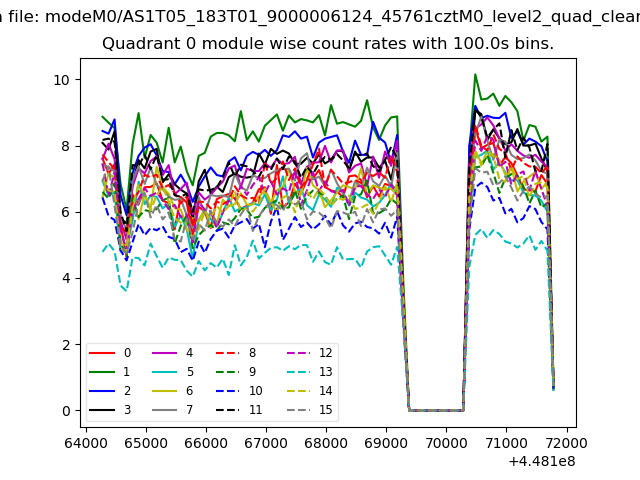 |
 |
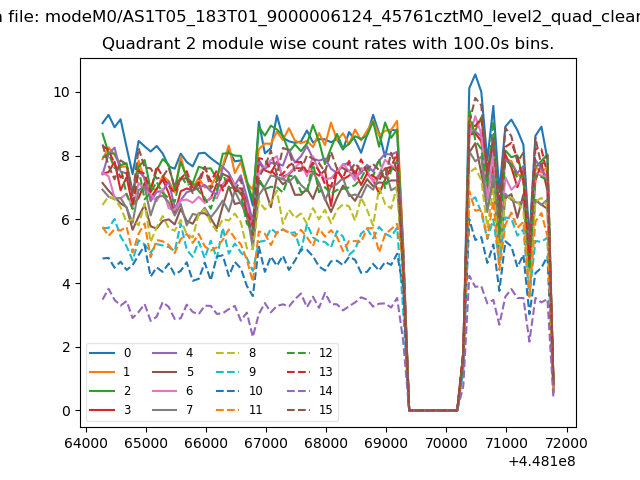
| Module-wise count rates for Quadrant B Data is divided into 100 sec bins |
 |
 |
| Module-wise count rates for Quadrant C Data is divided into 100 sec bins |
 |
 |
| Module-wise count rates for Quadrant D Data is divided into 100 sec bins |
 |
 |
| Parameter | Plot |
|---|---|
| CZT HV Monitor | 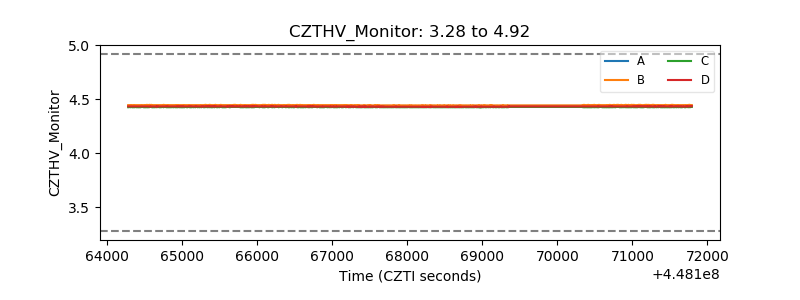 |
| D_VDD | 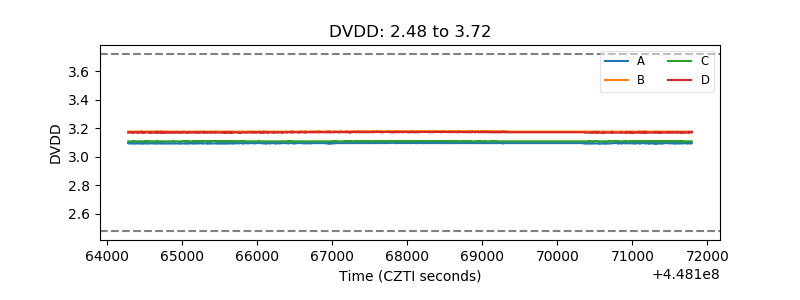 |
| Temperature 1 | 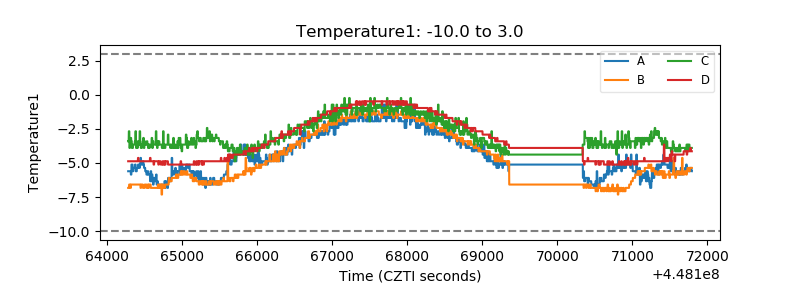 |
| Veto HV Monitor | 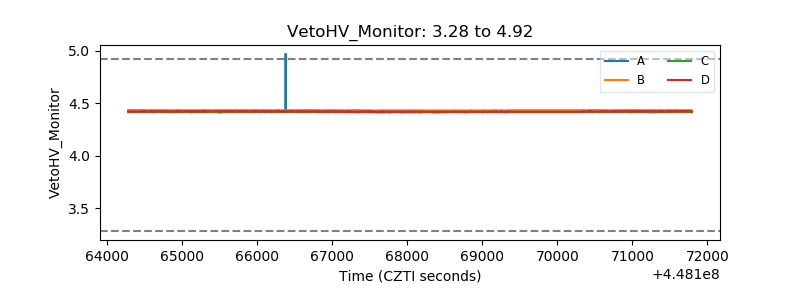 |
| Veto LLD | 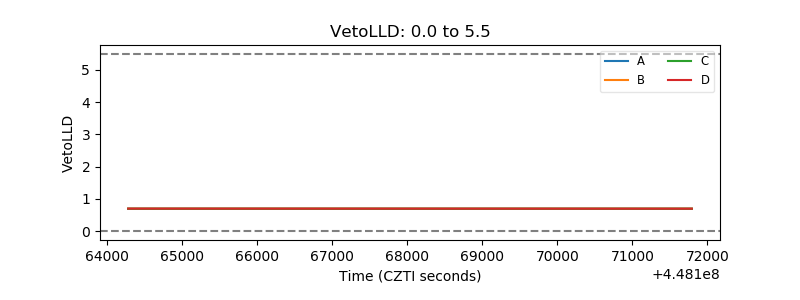 |
| Alpha Counter | 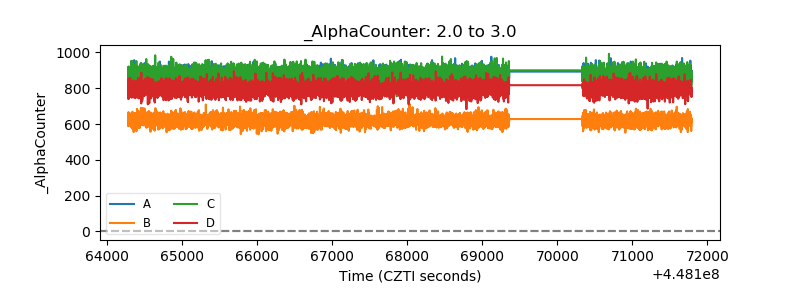 |
| _CPM_Rate | 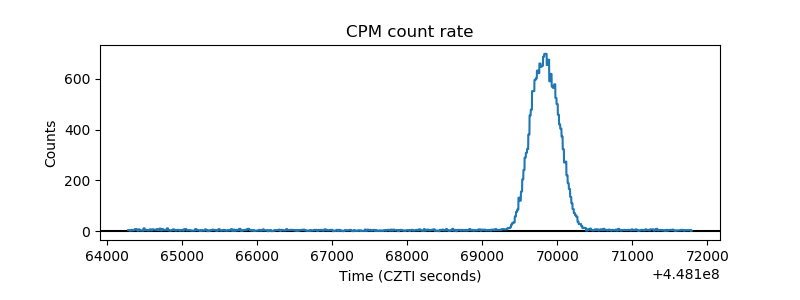 |
| CZT Counter | 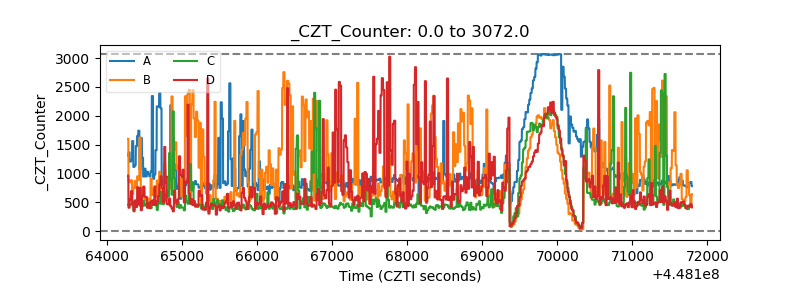 |
| +2.5 Volts monitor | 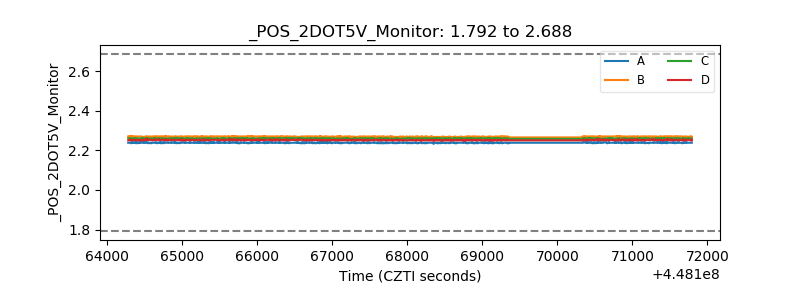 |
| +5 Volts monitor | 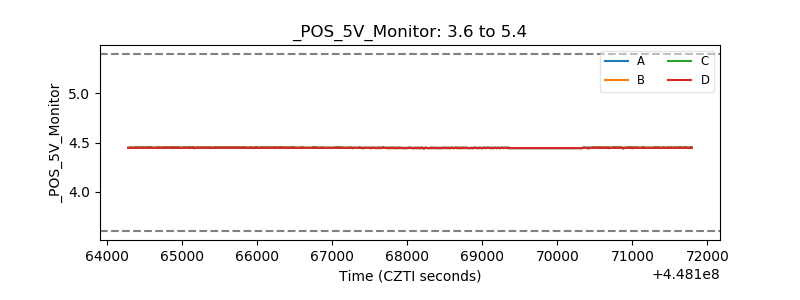 |
| _ROLL_ROT | 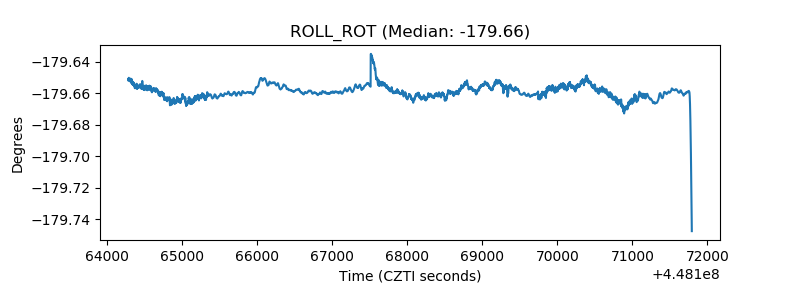 |
| _Roll_DEC | 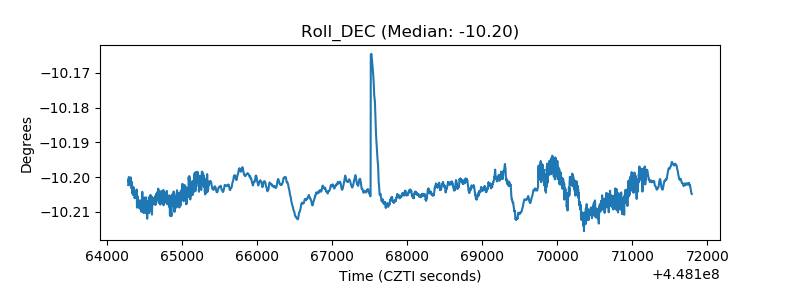 |
| _Roll_RA | 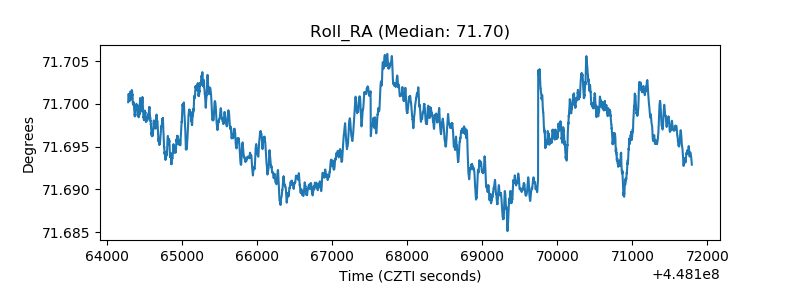 |
| Veto Counter | 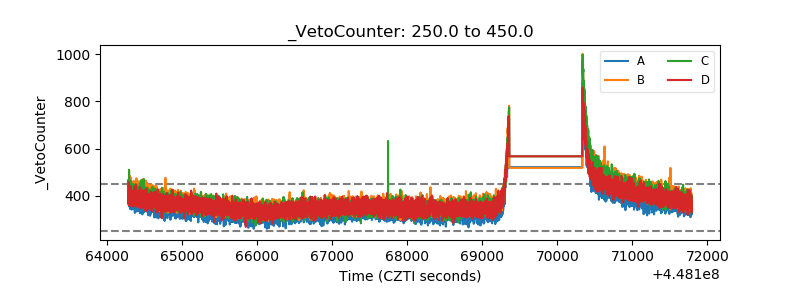 |