| Param | Original file | Final file |
|---|---|---|
| Filename | modeM0/AS1T05_183T01_9000006124_45762cztM0_level2.fits | modeM0/AS1T05_183T01_9000006124_45762cztM0_level2_quad_clean.evt |
| Size (bytes) | 601,260,480 | 102,781,440 |
| Size | 573.4 MB | 98.0 MB |
| Events in quadrant A | 6,166,687 | 702,421 |
| Events in quadrant B | 7,044,670 | 639,418 |
| Events in quadrant C | 3,477,062 | 710,755 |
| Events in quadrant D | 5,081,111 | 620,389 |
| Mode SS | |||
|---|---|---|---|
| Quadrant | BADHDUFLAG | Total packets | Discarded packets |
| A | 0 | 128 | 0 |
| B | 0 | 128 | 0 |
| C | 0 | 128 | 0 |
| D | 0 | 128 | 0 |
| Mode M0 | |||
|---|---|---|---|
| Quadrant | BADHDUFLAG | Total packets | Discarded packets |
| A | 0 | 22242 | 1 |
| B | 0 | 25409 | 1 |
| C | 0 | 14432 | 1 |
| D | 0 | 19225 | 1 |
| Mode M9 | |||
|---|---|---|---|
| Quadrant | BADHDUFLAG | Total packets | Discarded packets |
| A | 0 | 11 | 0 |
| B | 0 | 11 | 0 |
| C | 0 | 11 | 0 |
| D | 0 | 11 | 0 |
| Quadrant | Total seconds | Saturated seconds | Saturation percentage |
|---|---|---|---|
| A | 6288 | 302 | 4.802799% |
| B | 6288 | 1229 | 19.545165% |
| C | 6289 | 187 | 2.973446% |
| D | 6289 | 513 | 8.157100% |
Noise dominated data is calculated using 1-second bins in cleaned event files. If a bin has >2000 counts, and if more than 50% of those come from <1% of pixels, then it is considered to be noise-dominated and hence unusable.
| Quadrant | # 1 sec bins | Bins with >0 counts | Bins with >2000 counts | High rate bins dominated by noise | Noise dominated (total time) | Noise dominated (detector-on time) | Marked lightcurve |
|---|---|---|---|---|---|---|---|
| A | 7418 | 6289 | 114 | 114 | 1.54% | 1.81% | 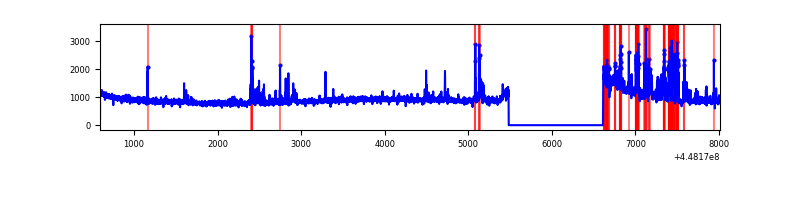 |
| B | 7418 | 6289 | 763 | 763 | 10.29% | 12.13% | 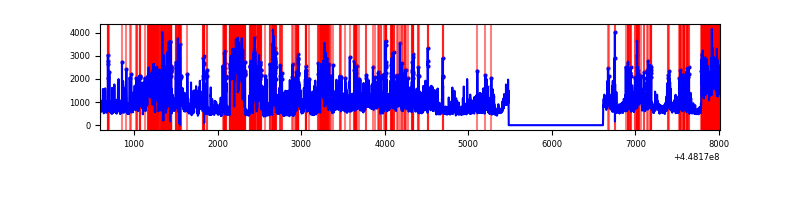 |
| C | 7419 | 6290 | 123 | 123 | 1.66% | 1.96% | 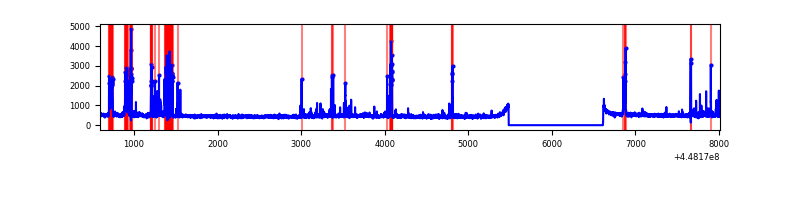 |
| D | 7419 | 6290 | 464 | 464 | 6.25% | 7.38% | 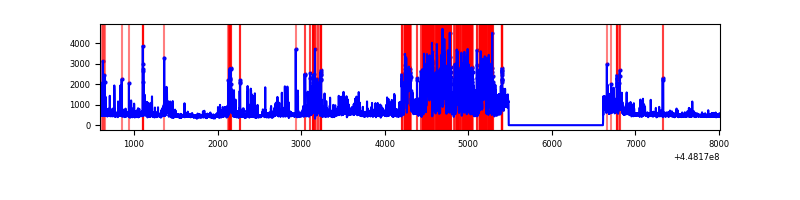 |
Top three noisy pixels from each quadrant. If the there are fewer than three noisy pixels in the level2.evt file, extra rows are filled as -1
| Pixel properties | Quadrant properties | ||||||
|---|---|---|---|---|---|---|---|
| Quadrant | DetID | PixID | Counts | Sigma | Mean | Median | Sigma |
| A | 10 | 83 | 2739004 | 17781.38 | 737 | 722 | 154.0 |
| A | 13 | 248 | 477045 | 3093.06 | 737 | 722 | 154.0 |
| A | 14 | 235 | 83561 | 537.93 | 737 | 722 | 154.0 |
| B | 3 | 112 | 2156453 | 16167.46 | 685 | 664 | 133.3 |
| B | 5 | 172 | 1730707 | 12974.55 | 685 | 664 | 133.3 |
| B | 12 | 18 | 259751 | 1943.04 | 685 | 664 | 133.3 |
| C | 14 | 254 | 521248 | 3061.72 | 725 | 730 | 170.0 |
| C | 14 | 220 | 61611 | 358.11 | 725 | 730 | 170.0 |
| C | 2 | 14 | 30914 | 177.54 | 725 | 730 | 170.0 |
| D | 2 | 249 | 1249936 | 7036.26 | 706 | 683 | 177.5 |
| D | 1 | 52 | 382522 | 2150.66 | 706 | 683 | 177.5 |
| D | 13 | 249 | 311942 | 1753.13 | 706 | 683 | 177.5 |
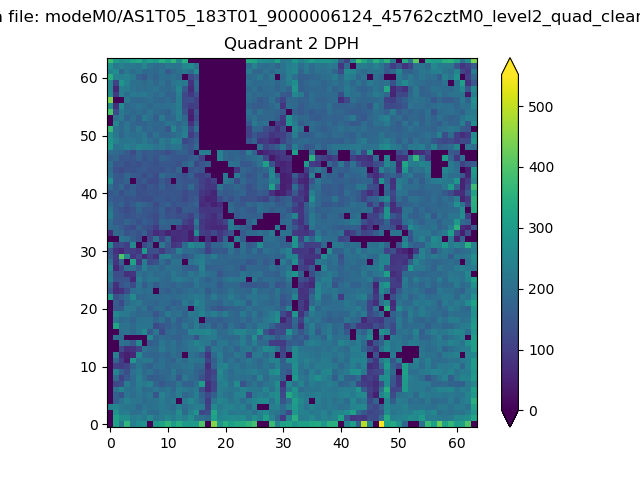
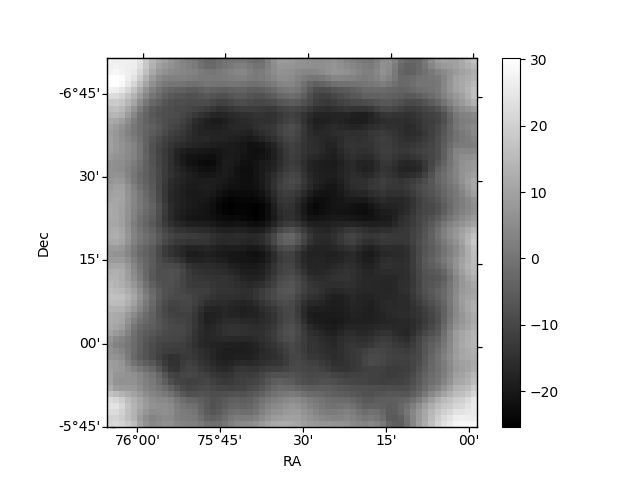
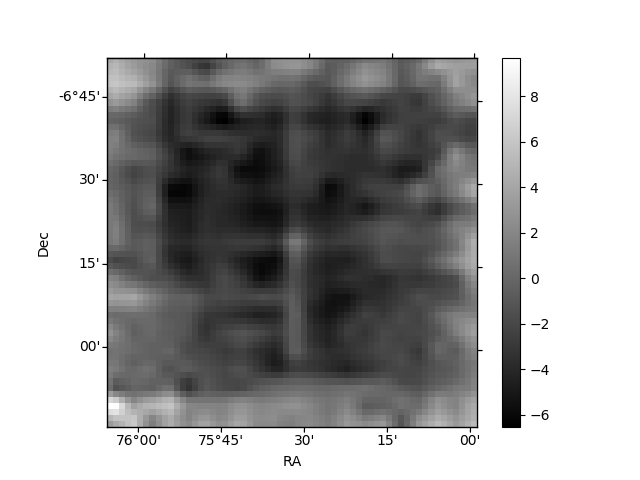
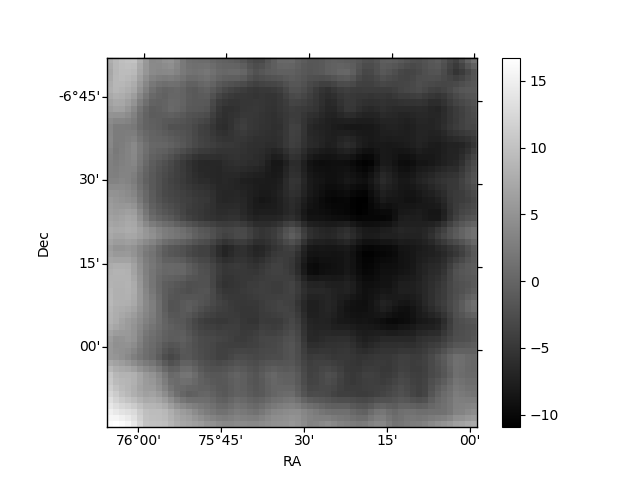
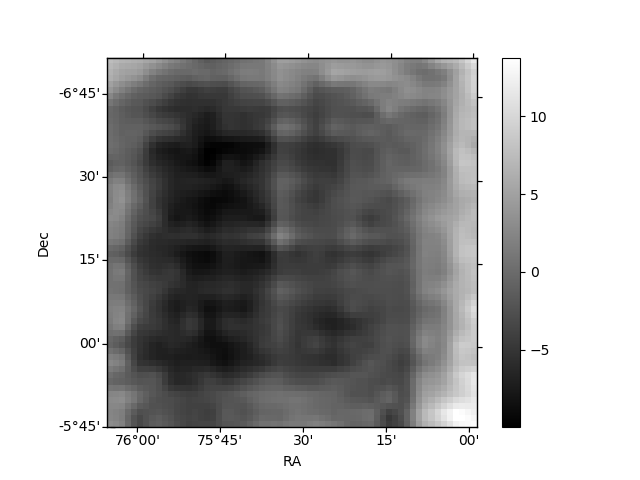
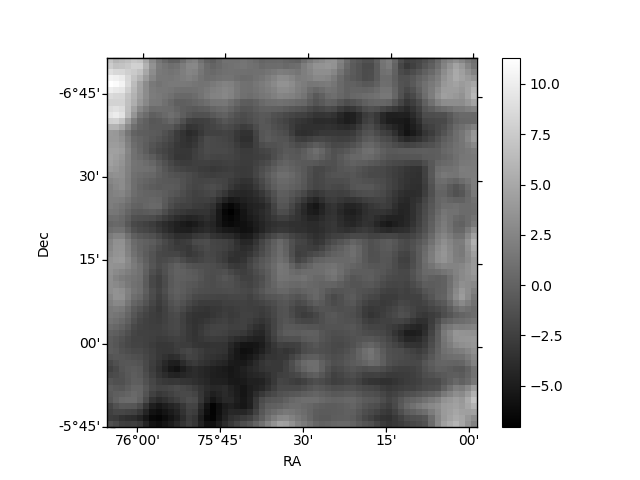
Histogram calculated using DETX and DETY for each event in the final _common_clean file
| Quadrant A | 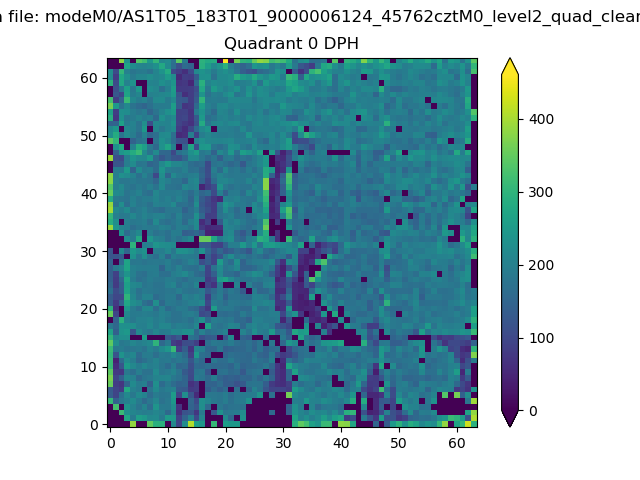 |
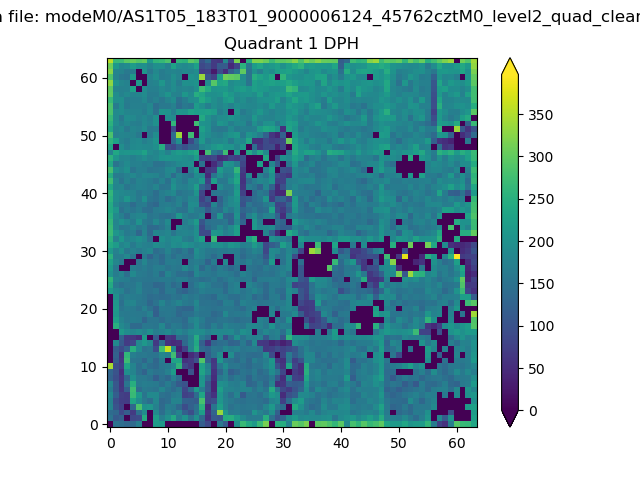 |
Quadrant B |
|---|---|---|---|
| Quadrant D | 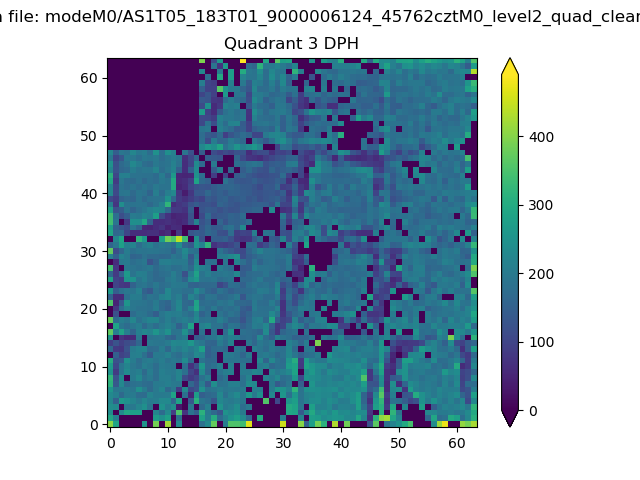 |
 |
Quadrant C |
| Plot type | Count rate plots | Images |
|---|---|---|
| Comparison with Poisson distribution Blue bars denote a histogram of data divided into 1 sec bins. Red curve is a Poisson curve with rate = median count rate of data. |
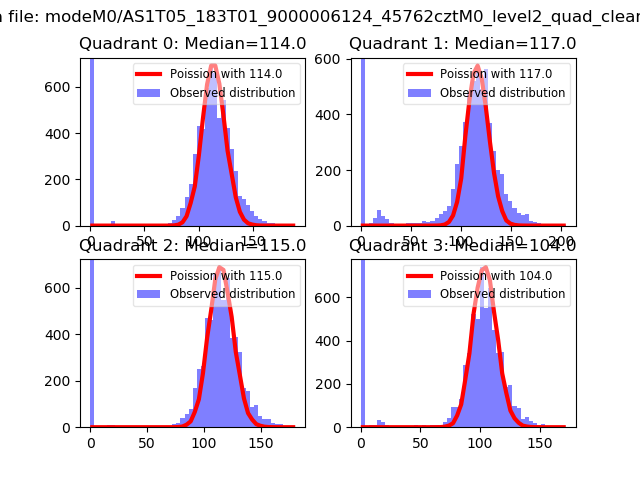 |
 |
| Quadrant-wise count rates Data is divided into 100 sec bins |
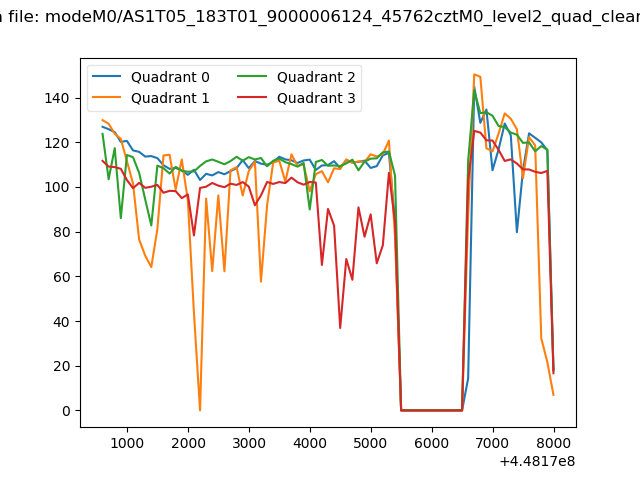 |
|
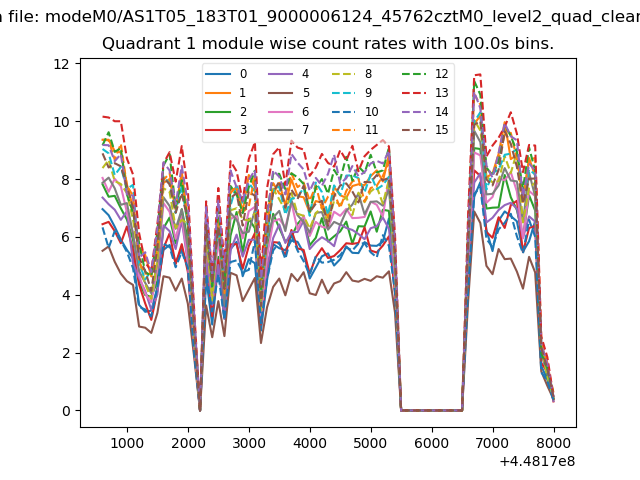
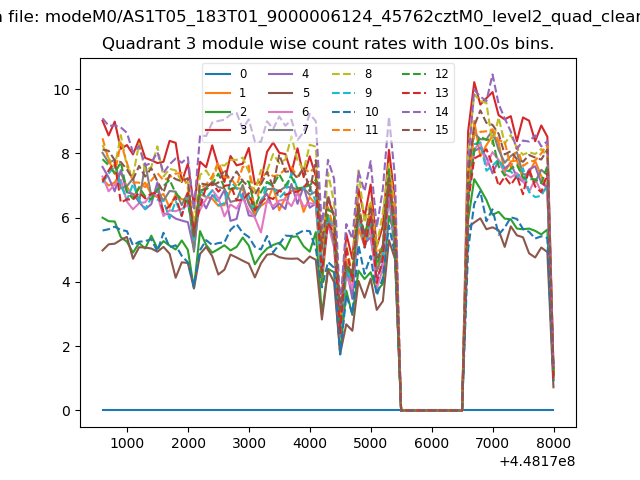
| Module-wise count rates for Quadrant A Data is divided into 100 sec bins |
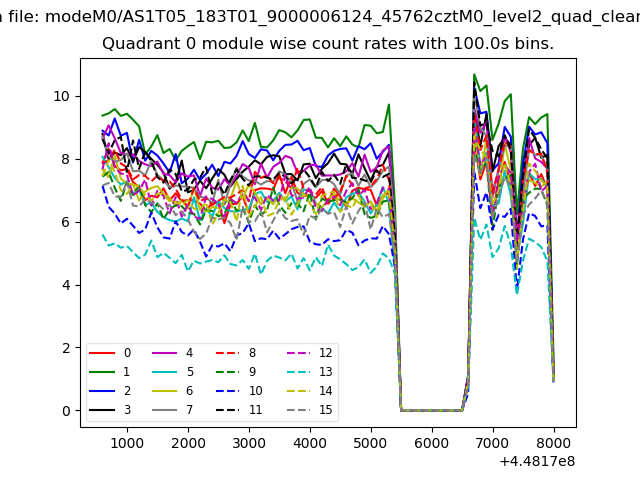 |
 |
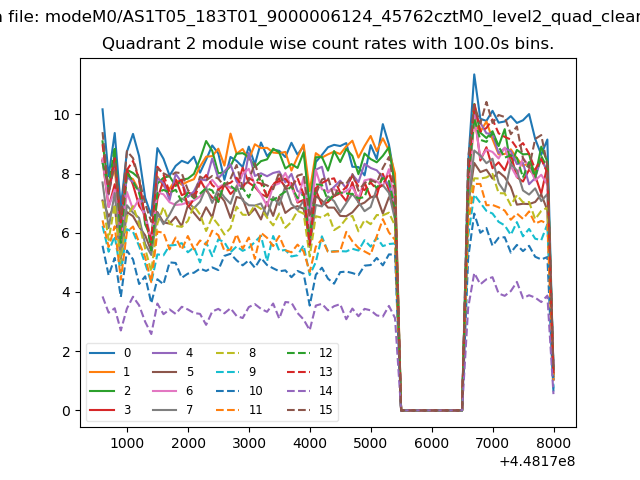
| Module-wise count rates for Quadrant B Data is divided into 100 sec bins |
 |
 |
| Module-wise count rates for Quadrant C Data is divided into 100 sec bins |
 |
 |
| Module-wise count rates for Quadrant D Data is divided into 100 sec bins |
 |
 |
| Parameter | Plot |
|---|---|
| CZT HV Monitor | 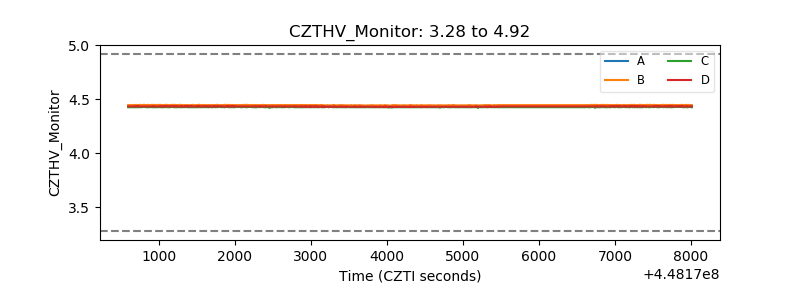 |
| D_VDD | 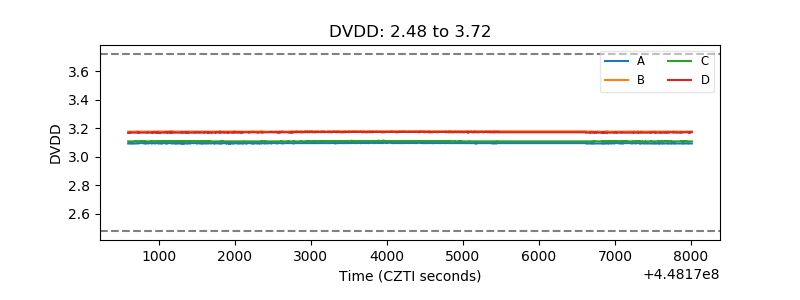 |
| Temperature 1 | 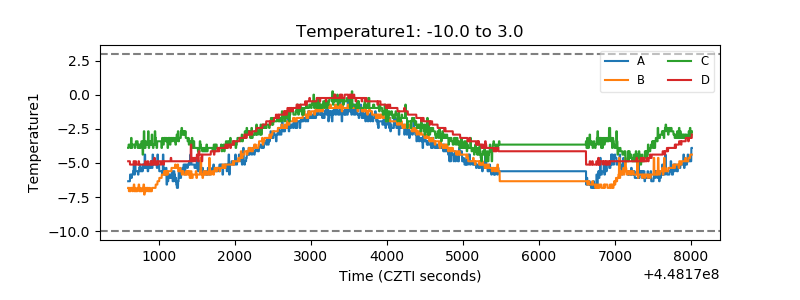 |
| Veto HV Monitor | 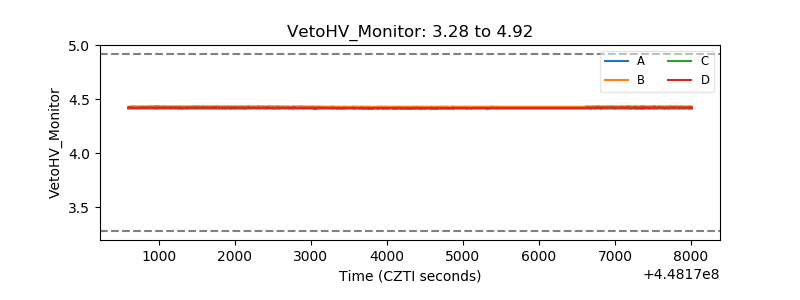 |
| Veto LLD | 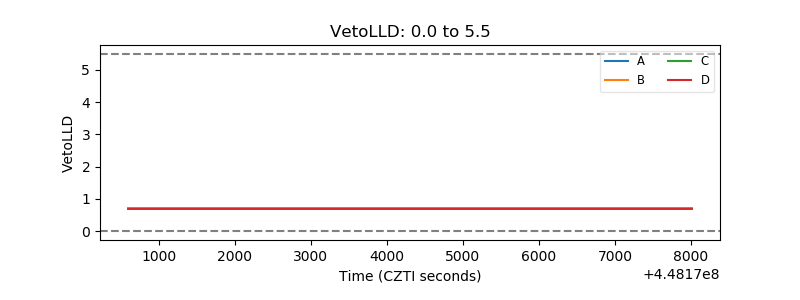 |
| Alpha Counter | 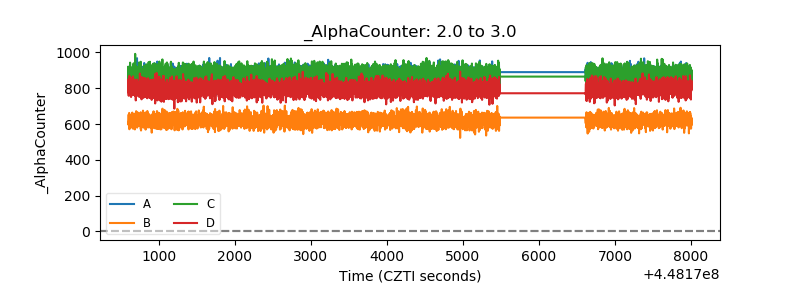 |
| _CPM_Rate | 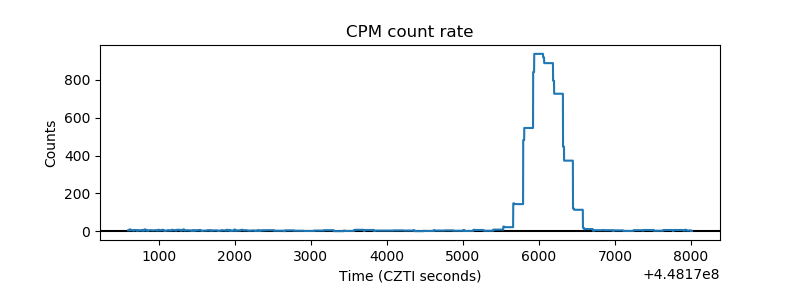 |
| CZT Counter | 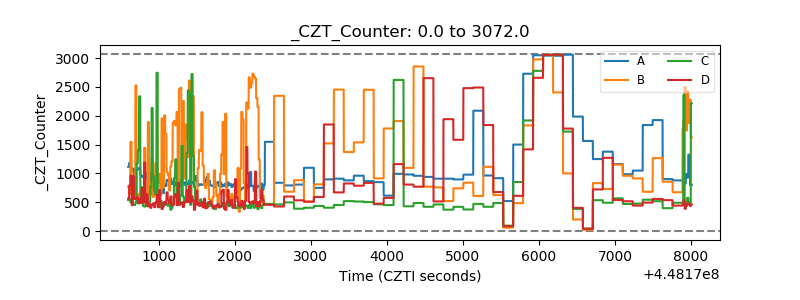 |
| +2.5 Volts monitor | 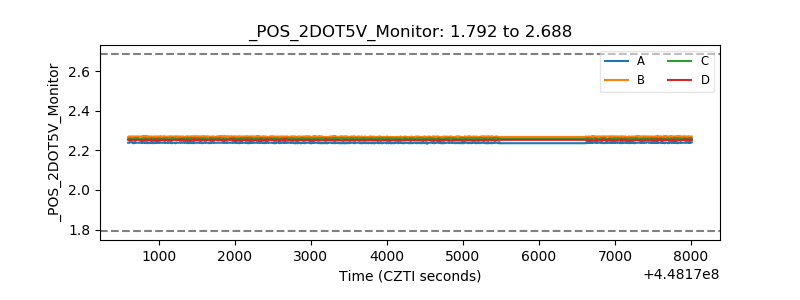 |
| +5 Volts monitor | 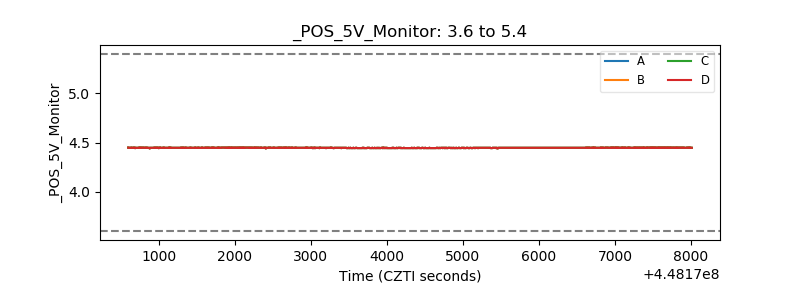 |
| _ROLL_ROT | 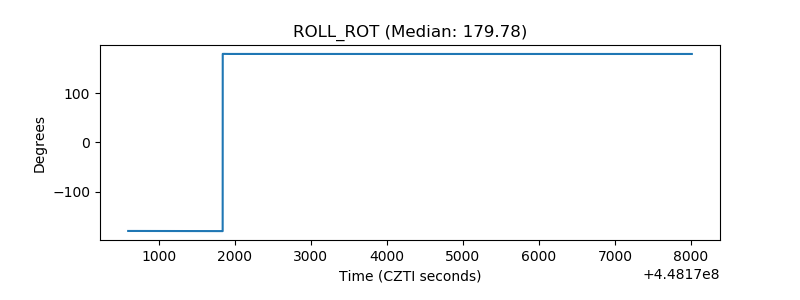 |
| _Roll_DEC | 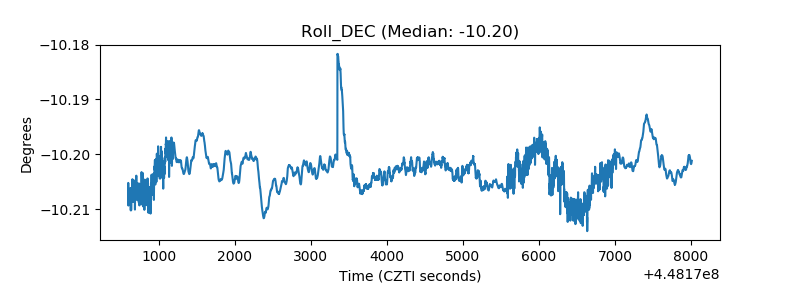 |
| _Roll_RA | 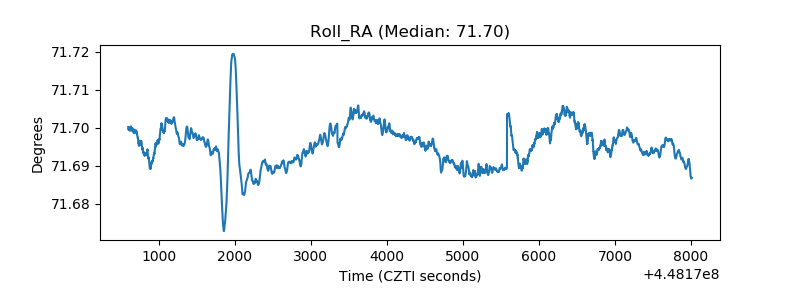 |
| Veto Counter | 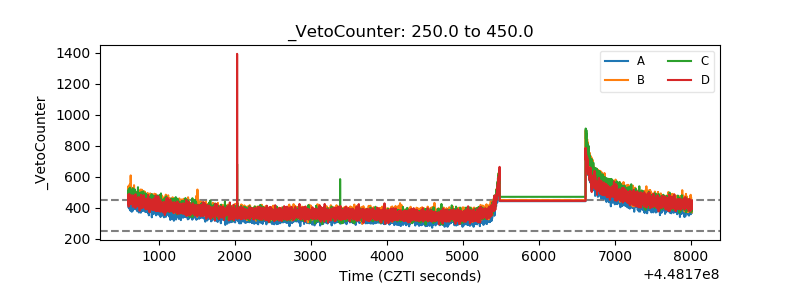 |