| Param | Original file | Final file |
|---|---|---|
| Filename | modeM0/AS1T05_183T01_9000006124_45763cztM0_level2.fits | modeM0/AS1T05_183T01_9000006124_45763cztM0_level2_quad_clean.evt |
| Size (bytes) | 614,635,200 | 105,880,320 |
| Size | 586.2 MB | 101.0 MB |
| Events in quadrant A | 6,265,267 | 728,159 |
| Events in quadrant B | 7,237,020 | 642,210 |
| Events in quadrant C | 3,527,150 | 743,987 |
| Events in quadrant D | 5,239,922 | 656,681 |
| Mode SS | |||
|---|---|---|---|
| Quadrant | BADHDUFLAG | Total packets | Discarded packets |
| A | 0 | 126 | 0 |
| B | 0 | 126 | 0 |
| C | 0 | 126 | 0 |
| D | 0 | 126 | 0 |
| Mode M0 | |||
|---|---|---|---|
| Quadrant | BADHDUFLAG | Total packets | Discarded packets |
| A | 0 | 22514 | 1 |
| B | 0 | 25973 | 1 |
| C | 0 | 14372 | 1 |
| D | 0 | 19747 | 1 |
| Mode M9 | |||
|---|---|---|---|
| Quadrant | BADHDUFLAG | Total packets | Discarded packets |
| A | 0 | 12 | 0 |
| B | 0 | 12 | 0 |
| C | 0 | 12 | 0 |
| D | 0 | 12 | 0 |
| Quadrant | Total seconds | Saturated seconds | Saturation percentage |
|---|---|---|---|
| A | 6232 | 375 | 6.017330% |
| B | 6232 | 1376 | 22.079589% |
| C | 6233 | 144 | 2.310284% |
| D | 6233 | 429 | 6.882721% |
Noise dominated data is calculated using 1-second bins in cleaned event files. If a bin has >2000 counts, and if more than 50% of those come from <1% of pixels, then it is considered to be noise-dominated and hence unusable.
| Quadrant | # 1 sec bins | Bins with >0 counts | Bins with >2000 counts | High rate bins dominated by noise | Noise dominated (total time) | Noise dominated (detector-on time) | Marked lightcurve |
|---|---|---|---|---|---|---|---|
| A | 7417 | 6233 | 109 | 109 | 1.47% | 1.75% | 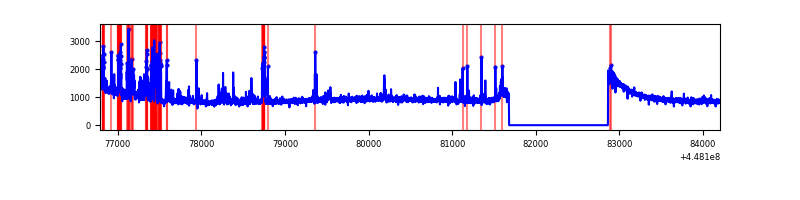 |
| B | 7417 | 6233 | 838 | 838 | 11.30% | 13.44% | 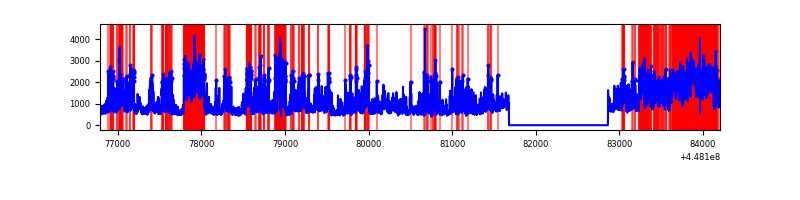 |
| C | 7418 | 6234 | 72 | 72 | 0.97% | 1.15% | 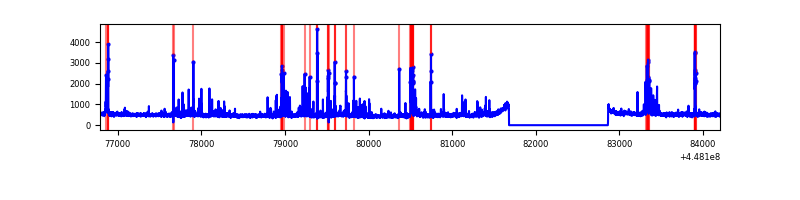 |
| D | 7418 | 6234 | 326 | 326 | 4.39% | 5.23% | 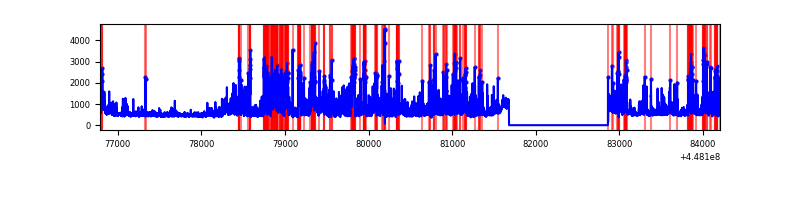 |
Top three noisy pixels from each quadrant. If the there are fewer than three noisy pixels in the level2.evt file, extra rows are filled as -1
| Pixel properties | Quadrant properties | ||||||
|---|---|---|---|---|---|---|---|
| Quadrant | DetID | PixID | Counts | Sigma | Mean | Median | Sigma |
| A | 10 | 83 | 2757710 | 17639.05 | 760 | 746 | 156.3 |
| A | 13 | 248 | 443297 | 2831.44 | 760 | 746 | 156.3 |
| A | 14 | 235 | 93585 | 593.98 | 760 | 746 | 156.3 |
| B | 3 | 112 | 2729709 | 19700.61 | 712 | 693 | 138.5 |
| B | 5 | 172 | 1066149 | 7691.46 | 712 | 693 | 138.5 |
| B | 12 | 18 | 273309 | 1968.0 | 712 | 693 | 138.5 |
| C | 14 | 254 | 259229 | 1480.13 | 750 | 757 | 174.6 |
| C | 2 | 14 | 90916 | 516.29 | 750 | 757 | 174.6 |
| C | 1 | 3 | 76110 | 431.51 | 750 | 757 | 174.6 |
| D | 1 | 52 | 858686 | 4680.52 | 738 | 719 | 183.3 |
| D | 1 | 47 | 523894 | 2854.11 | 738 | 719 | 183.3 |
| D | 13 | 249 | 522287 | 2845.34 | 738 | 719 | 183.3 |
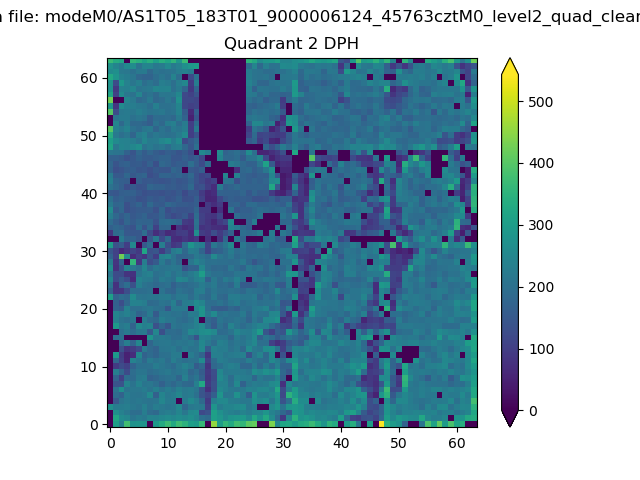
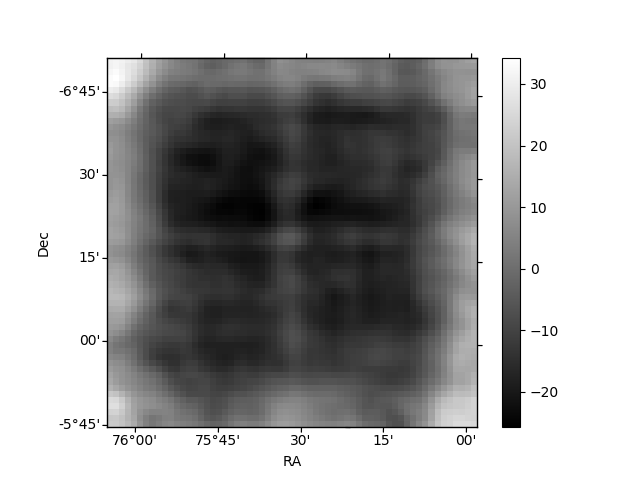
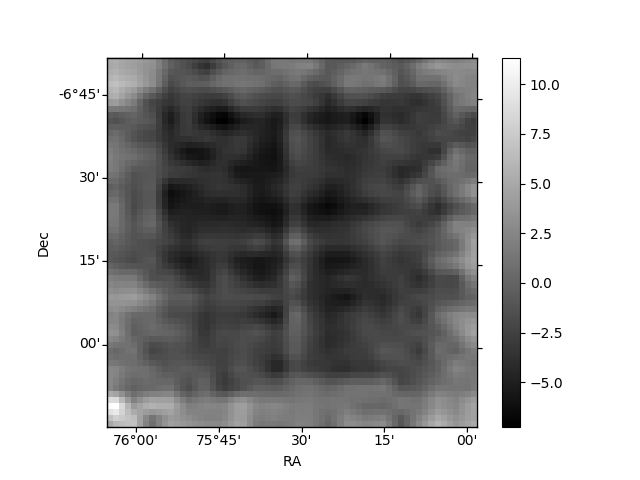
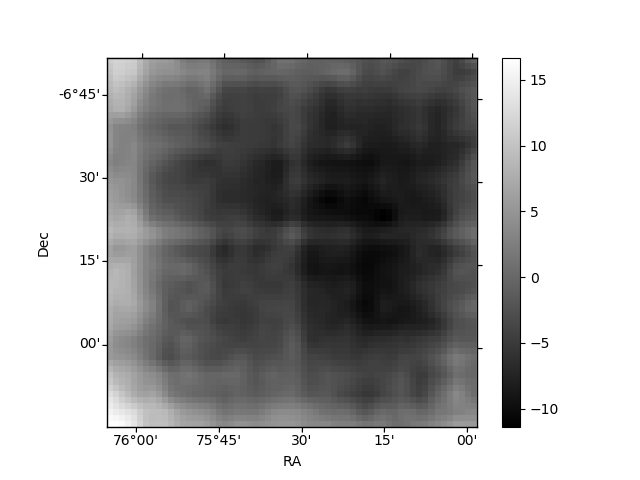
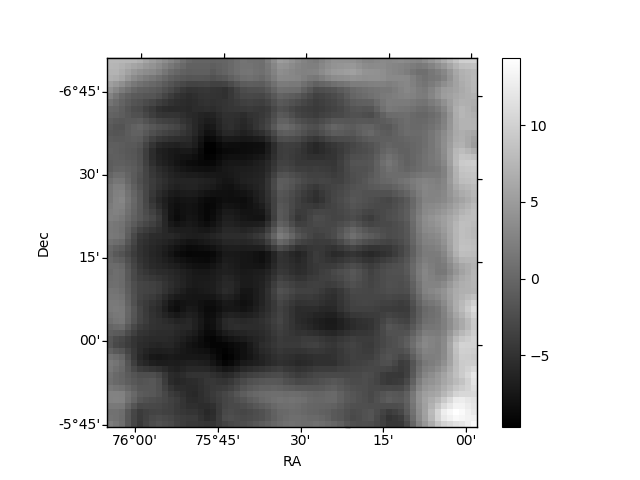
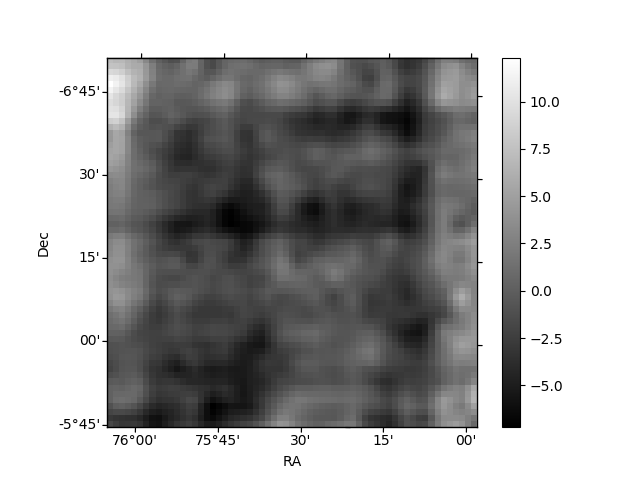
Histogram calculated using DETX and DETY for each event in the final _common_clean file
| Quadrant A | 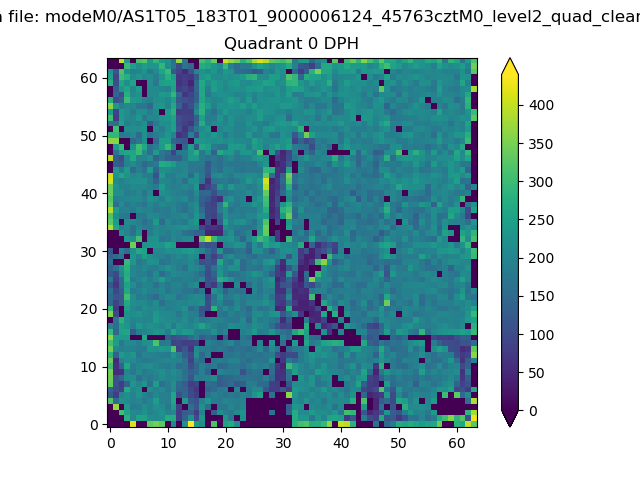 |
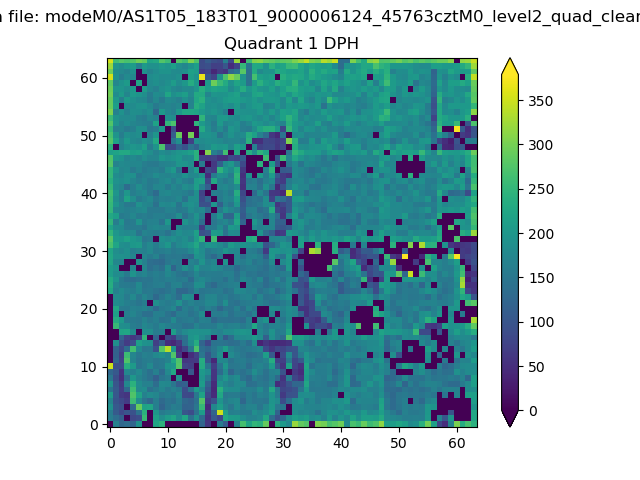 |
Quadrant B |
|---|---|---|---|
| Quadrant D | 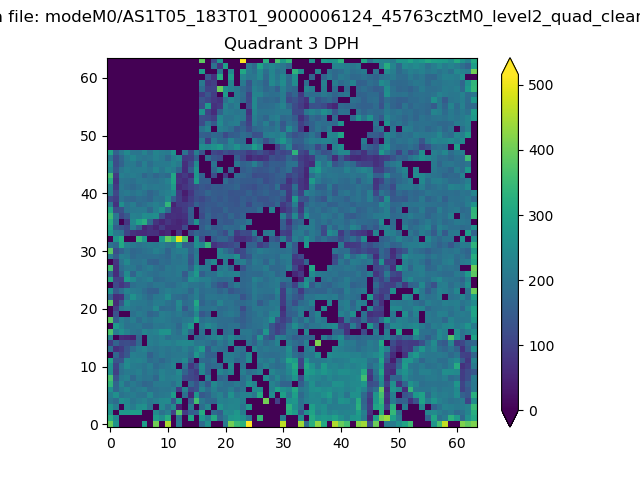 |
 |
Quadrant C |
| Plot type | Count rate plots | Images |
|---|---|---|
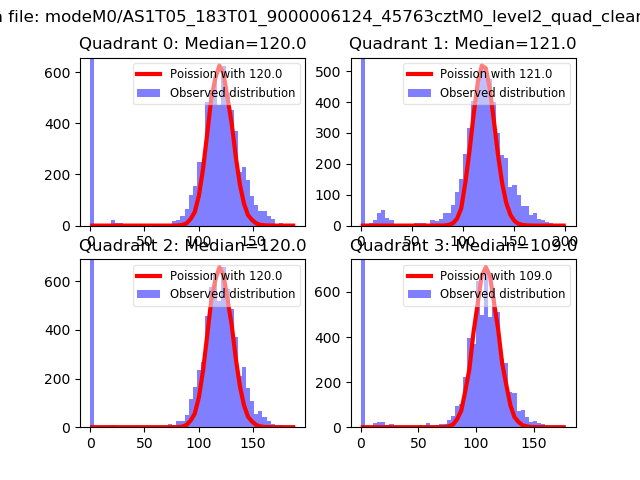
| Comparison with Poisson distribution Blue bars denote a histogram of data divided into 1 sec bins. Red curve is a Poisson curve with rate = median count rate of data. |
 |
 |
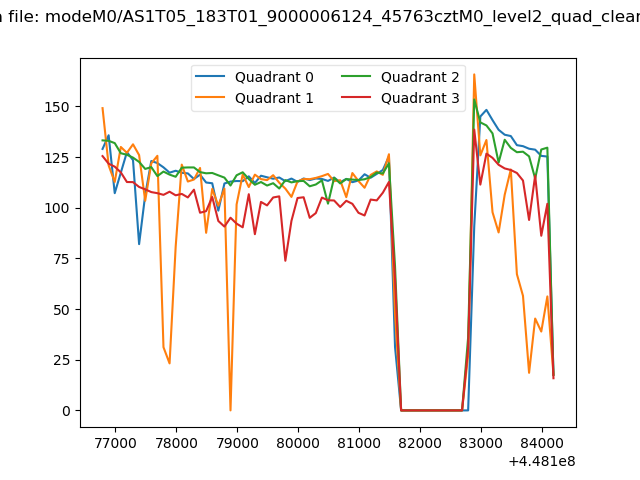
| Quadrant-wise count rates Data is divided into 100 sec bins |
 |
|
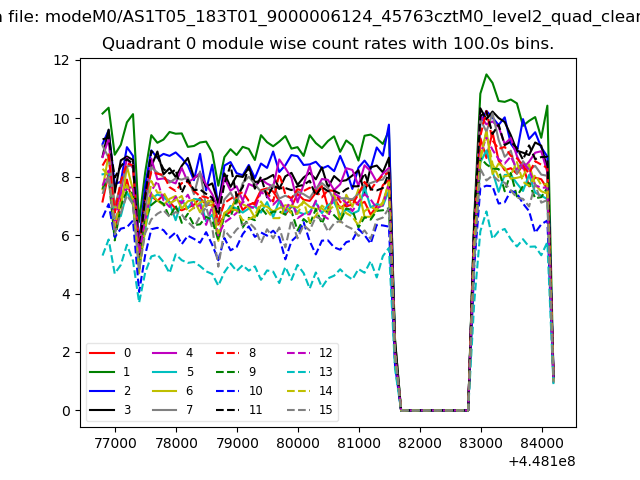
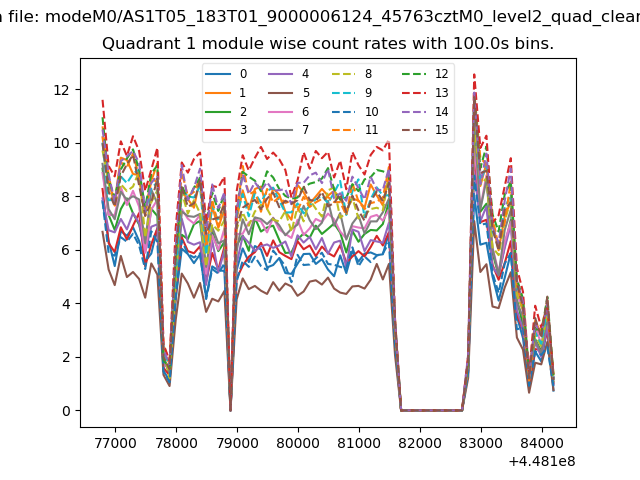
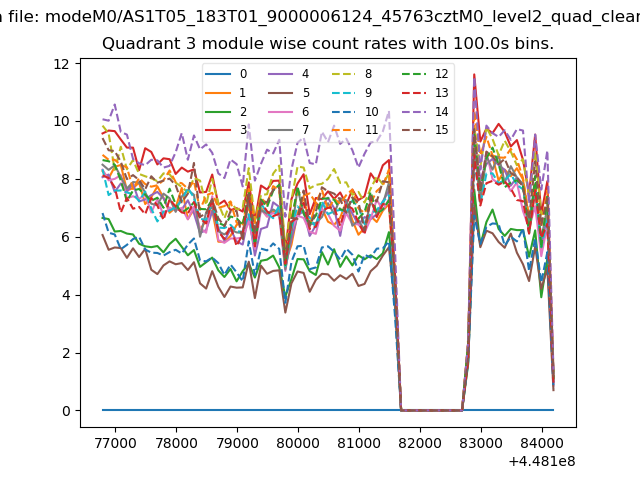
| Module-wise count rates for Quadrant A Data is divided into 100 sec bins |
 |
 |
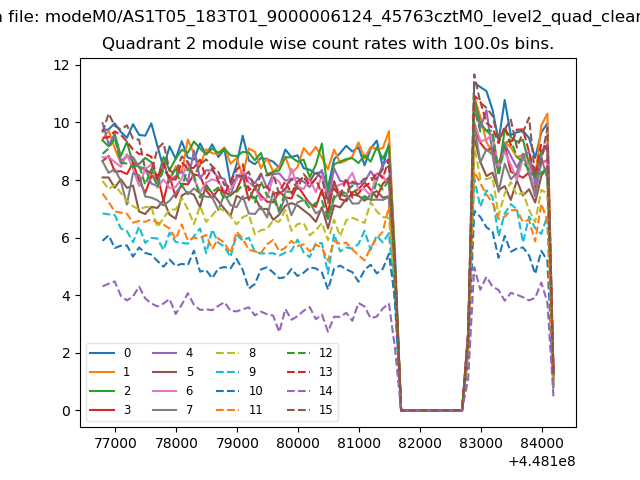
| Module-wise count rates for Quadrant B Data is divided into 100 sec bins |
 |
 |
| Module-wise count rates for Quadrant C Data is divided into 100 sec bins |
 |
 |
| Module-wise count rates for Quadrant D Data is divided into 100 sec bins |
 |
 |
| Parameter | Plot |
|---|---|
| CZT HV Monitor | 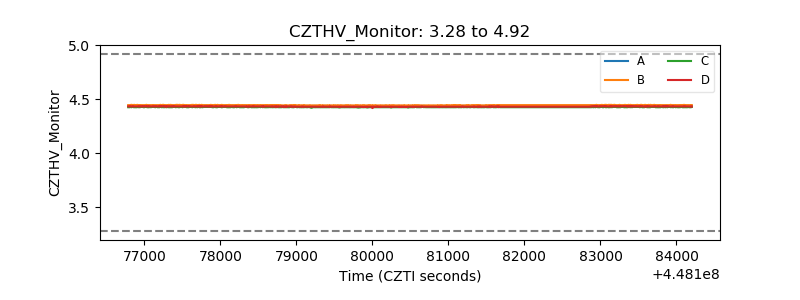 |
| D_VDD | 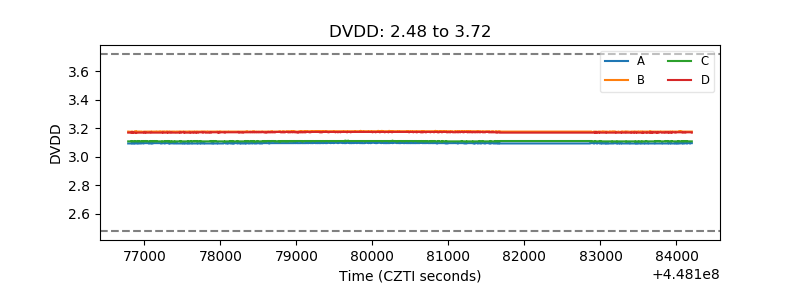 |
| Temperature 1 | 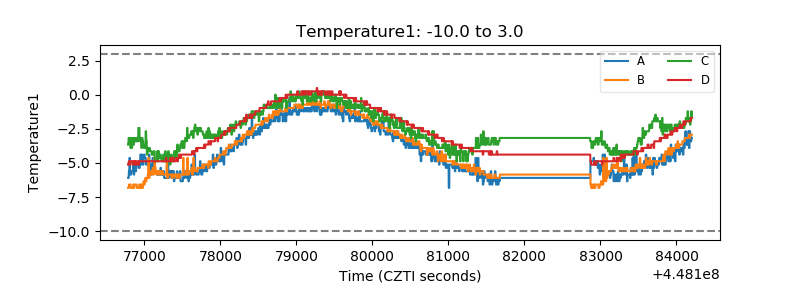 |
| Veto HV Monitor |  |
| Veto LLD | 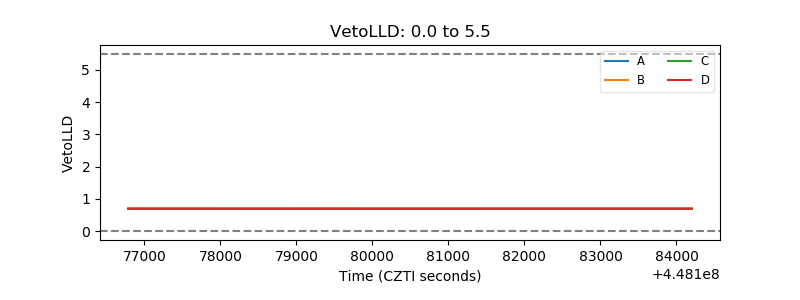 |
| Alpha Counter | 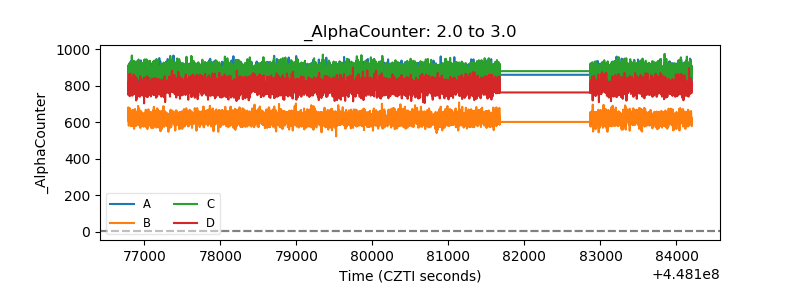 |
| _CPM_Rate | 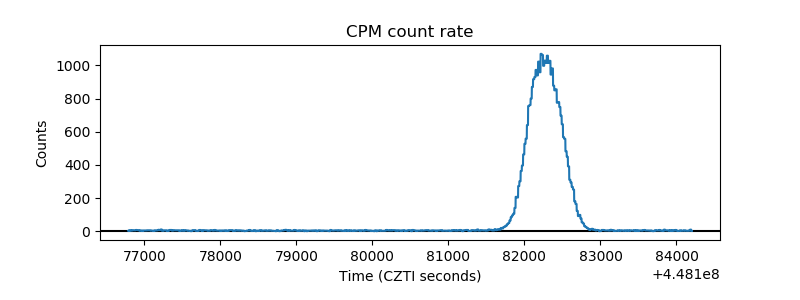 |
| CZT Counter | 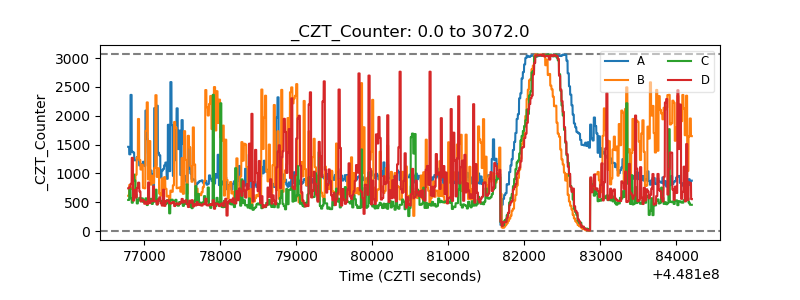 |
| +2.5 Volts monitor | 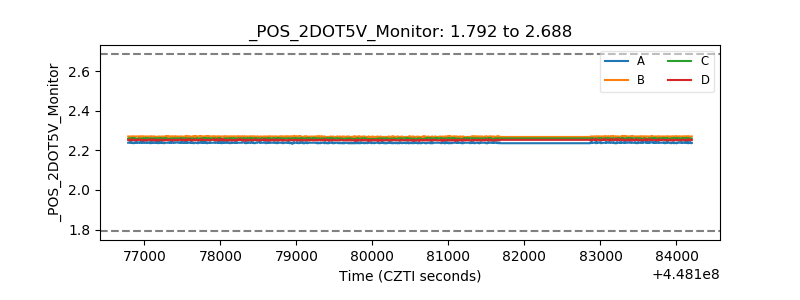 |
| +5 Volts monitor | 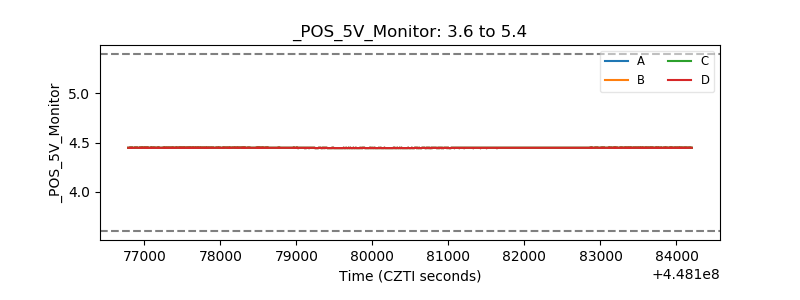 |
| _ROLL_ROT | 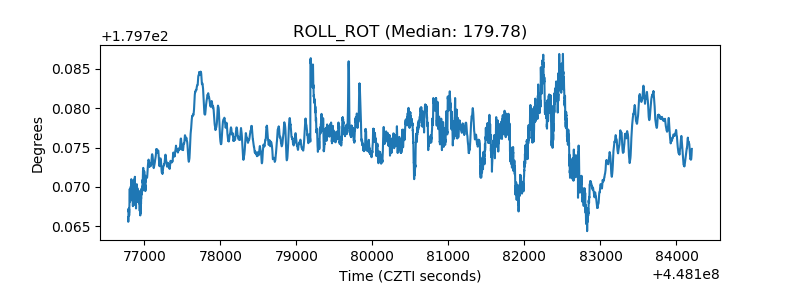 |
| _Roll_DEC | 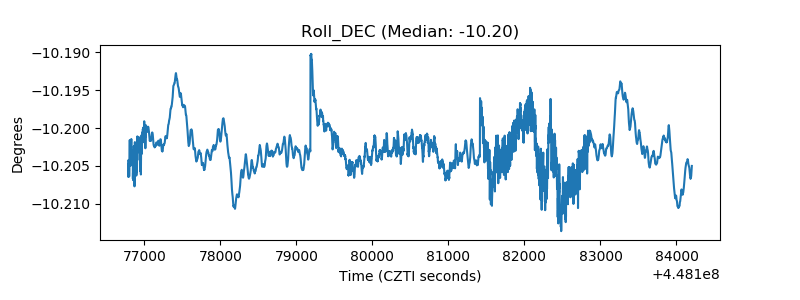 |
| _Roll_RA | 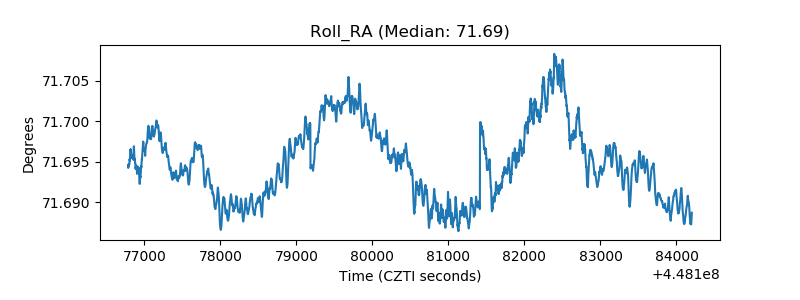 |
| Veto Counter | 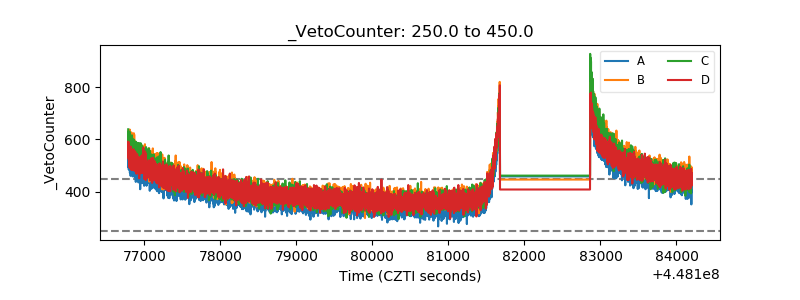 |