| Param | Original file | Final file |
|---|---|---|
| Filename | modeM0/AS1T05_183T01_9000006124_45765cztM0_level2.fits | modeM0/AS1T05_183T01_9000006124_45765cztM0_level2_quad_clean.evt |
| Size (bytes) | 636,969,600 | 102,899,520 |
| Size | 607.5 MB | 98.1 MB |
| Events in quadrant A | 5,969,905 | 722,774 |
| Events in quadrant B | 7,468,083 | 628,995 |
| Events in quadrant C | 3,888,230 | 716,754 |
| Events in quadrant D | 5,773,986 | 615,464 |
| Mode SS | |||
|---|---|---|---|
| Quadrant | BADHDUFLAG | Total packets | Discarded packets |
| A | 0 | 126 | 0 |
| B | 0 | 126 | 0 |
| C | 0 | 126 | 0 |
| D | 0 | 126 | 0 |
| Mode M0 | |||
|---|---|---|---|
| Quadrant | BADHDUFLAG | Total packets | Discarded packets |
| A | 0 | 21511 | 1 |
| B | 0 | 26576 | 1 |
| C | 0 | 15540 | 1 |
| D | 0 | 21307 | 1 |
| Mode M9 | |||
|---|---|---|---|
| Quadrant | BADHDUFLAG | Total packets | Discarded packets |
| A | 0 | 11 | 0 |
| B | 0 | 11 | 0 |
| C | 0 | 11 | 0 |
| D | 0 | 11 | 0 |
| Quadrant | Total seconds | Saturated seconds | Saturation percentage |
|---|---|---|---|
| A | 6180 | 286 | 4.627832% |
| B | 6181 | 1413 | 22.860379% |
| C | 6181 | 295 | 4.772691% |
| D | 6181 | 749 | 12.117780% |
Noise dominated data is calculated using 1-second bins in cleaned event files. If a bin has >2000 counts, and if more than 50% of those come from <1% of pixels, then it is considered to be noise-dominated and hence unusable.
| Quadrant | # 1 sec bins | Bins with >0 counts | Bins with >2000 counts | High rate bins dominated by noise | Noise dominated (total time) | Noise dominated (detector-on time) | Marked lightcurve |
|---|---|---|---|---|---|---|---|
| A | 7320 | 6181 | 38 | 38 | 0.52% | 0.61% | 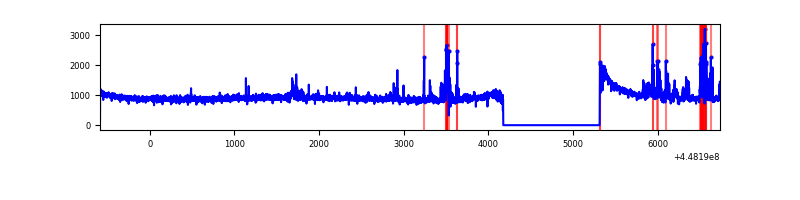 |
| B | 7321 | 6181 | 829 | 829 | 11.32% | 13.41% | 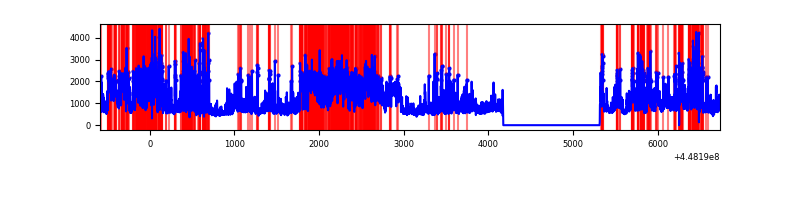 |
| C | 7321 | 6182 | 179 | 179 | 2.45% | 2.90% | 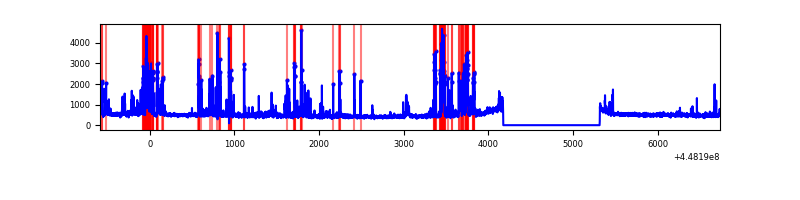 |
| D | 7321 | 6182 | 539 | 539 | 7.36% | 8.72% | 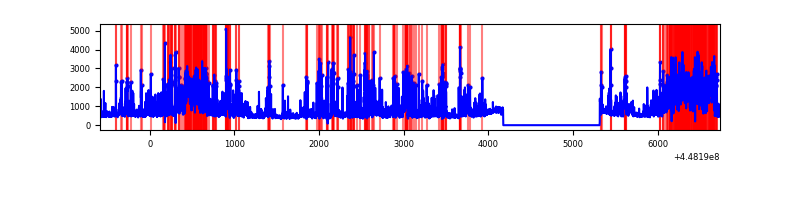 |
Top three noisy pixels from each quadrant. If the there are fewer than three noisy pixels in the level2.evt file, extra rows are filled as -1
| Pixel properties | Quadrant properties | ||||||
|---|---|---|---|---|---|---|---|
| Quadrant | DetID | PixID | Counts | Sigma | Mean | Median | Sigma |
| A | 10 | 83 | 2747005 | 17373.98 | 752 | 736 | 158.1 |
| A | 13 | 248 | 198867 | 1253.45 | 752 | 736 | 158.1 |
| A | 14 | 235 | 87784 | 550.7 | 752 | 736 | 158.1 |
| B | 3 | 112 | 2524692 | 18536.96 | 697 | 677 | 136.2 |
| B | 12 | 18 | 1214292 | 8913.07 | 697 | 677 | 136.2 |
| B | 5 | 172 | 323404 | 2370.18 | 697 | 677 | 136.2 |
| C | 14 | 254 | 563341 | 3317.24 | 726 | 733 | 169.6 |
| C | 14 | 96 | 373289 | 2196.66 | 726 | 733 | 169.6 |
| C | 3 | 233 | 63292 | 368.86 | 726 | 733 | 169.6 |
| D | 1 | 52 | 1641714 | 9151.23 | 717 | 697 | 179.3 |
| D | 13 | 249 | 531745 | 2961.42 | 717 | 697 | 179.3 |
| D | 1 | 47 | 258954 | 1440.19 | 717 | 697 | 179.3 |
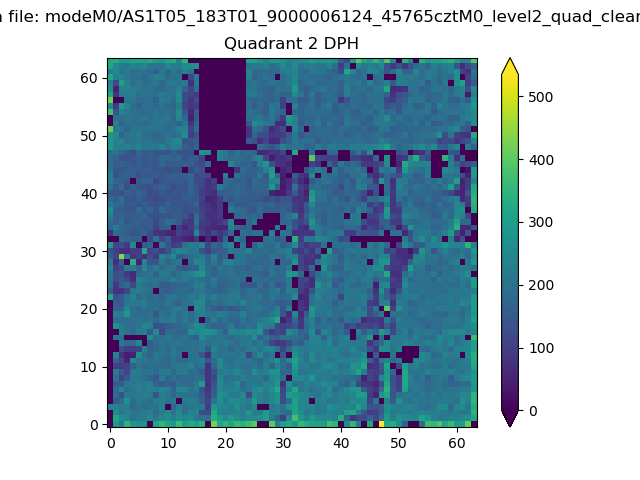
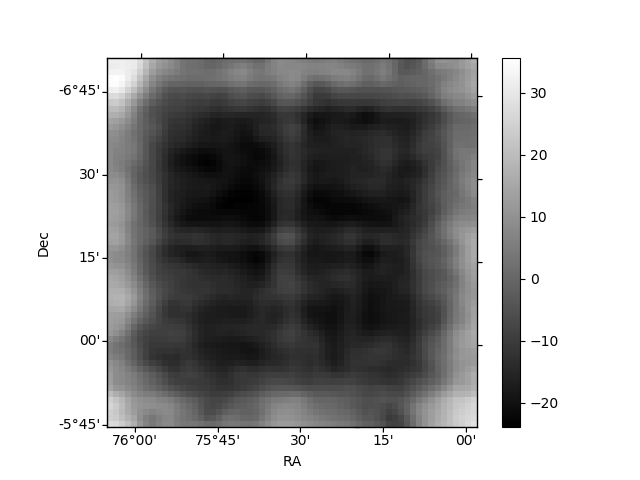
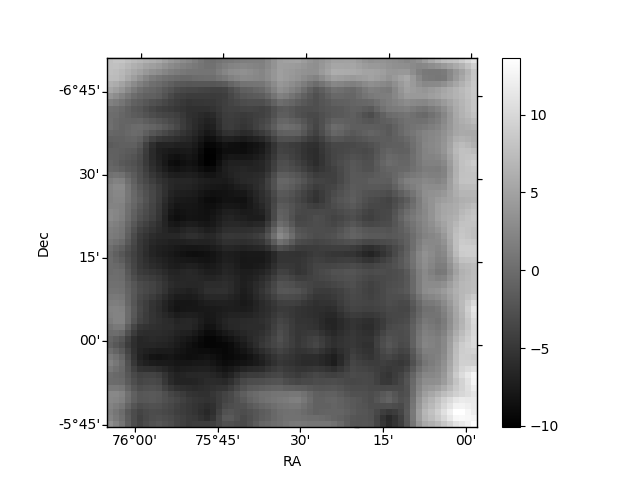
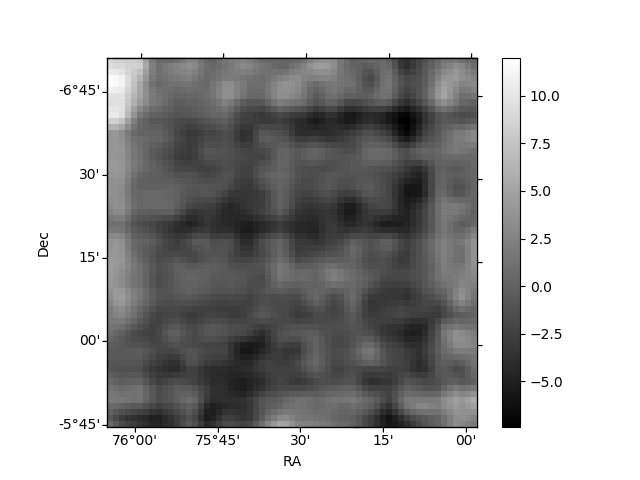
Histogram calculated using DETX and DETY for each event in the final _common_clean file
| Quadrant A | 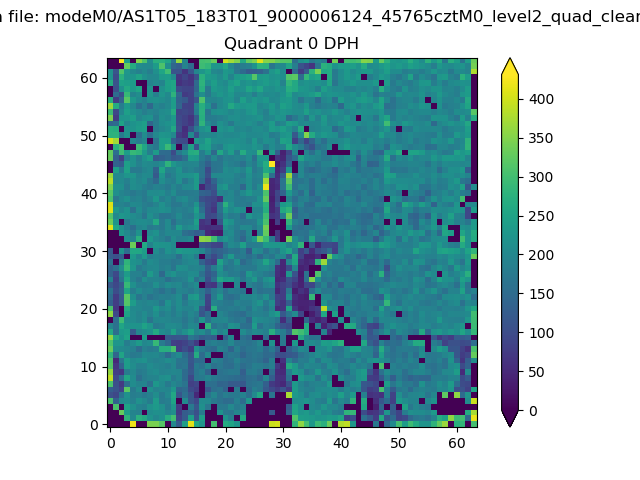 |
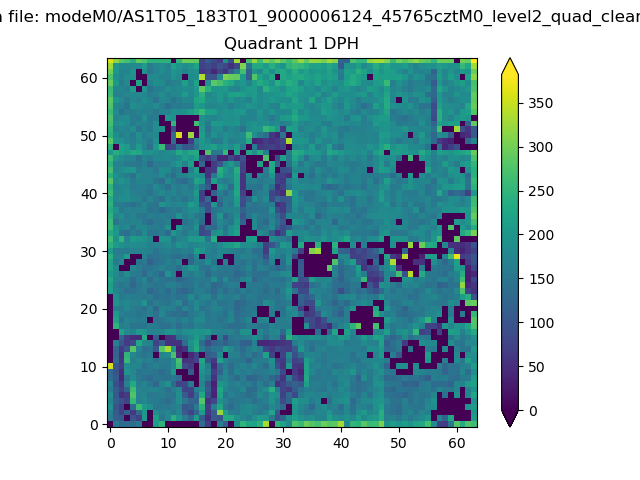 |
Quadrant B |
|---|---|---|---|
| Quadrant D | 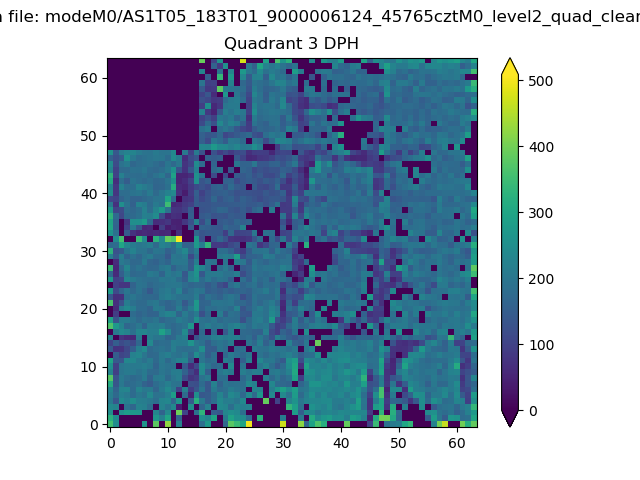 |
 |
Quadrant C |
| Plot type | Count rate plots | Images |
|---|---|---|
| Comparison with Poisson distribution Blue bars denote a histogram of data divided into 1 sec bins. Red curve is a Poisson curve with rate = median count rate of data. |
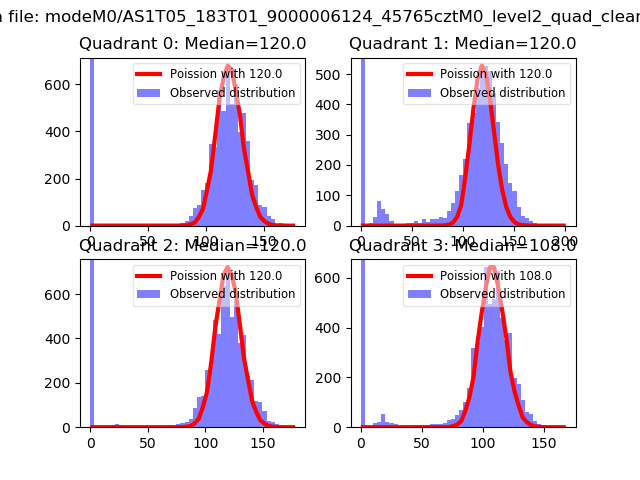 |
 |
| Quadrant-wise count rates Data is divided into 100 sec bins |
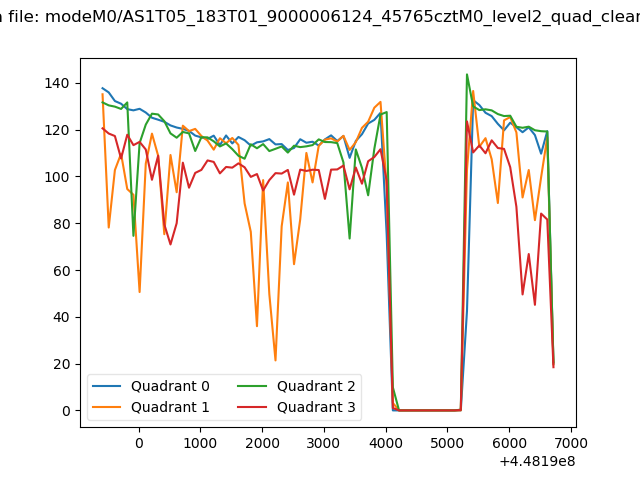 |
|
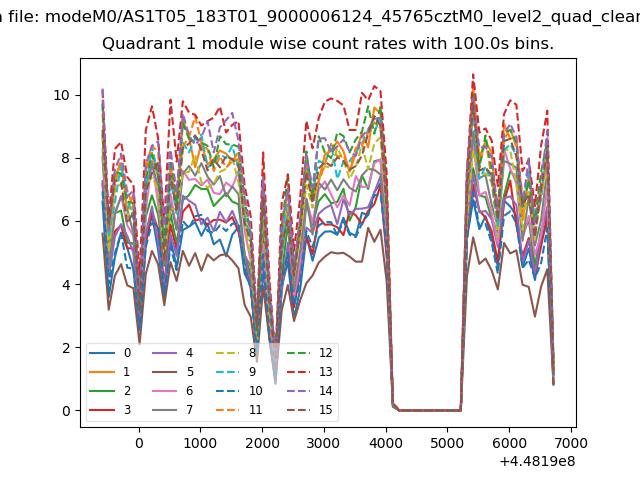
| Module-wise count rates for Quadrant A Data is divided into 100 sec bins |
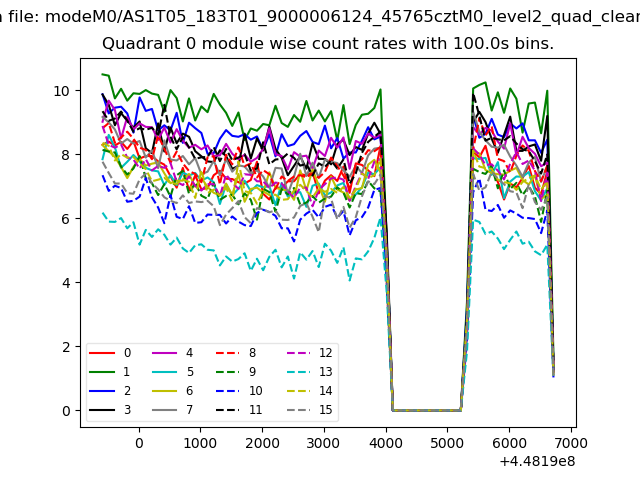 |
 |
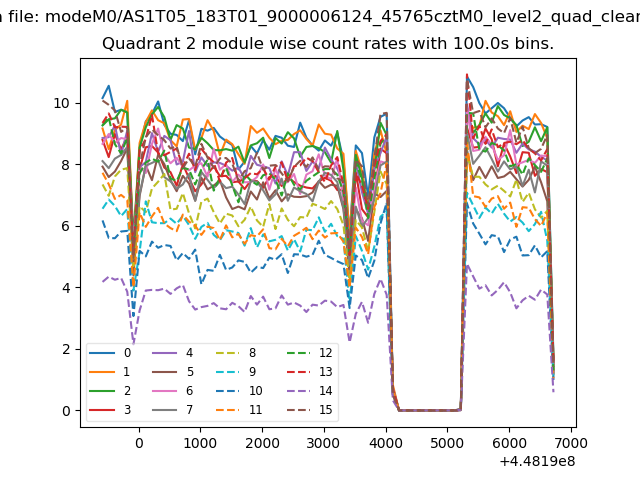
| Module-wise count rates for Quadrant B Data is divided into 100 sec bins |
 |
 |
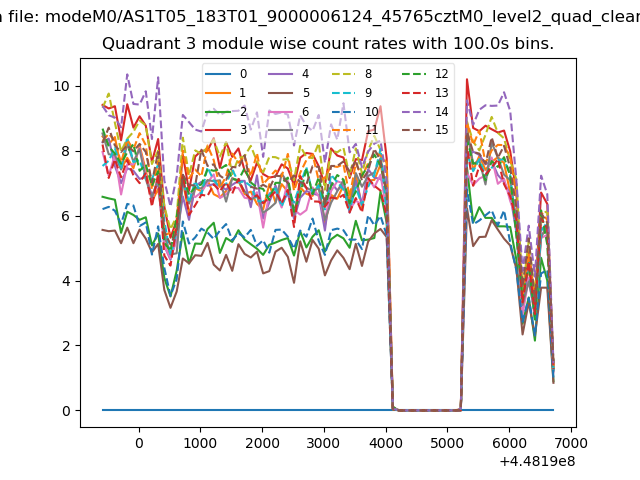
| Module-wise count rates for Quadrant C Data is divided into 100 sec bins |
 |
 |
| Module-wise count rates for Quadrant D Data is divided into 100 sec bins |
 |
 |
| Parameter | Plot |
|---|---|
| CZT HV Monitor | 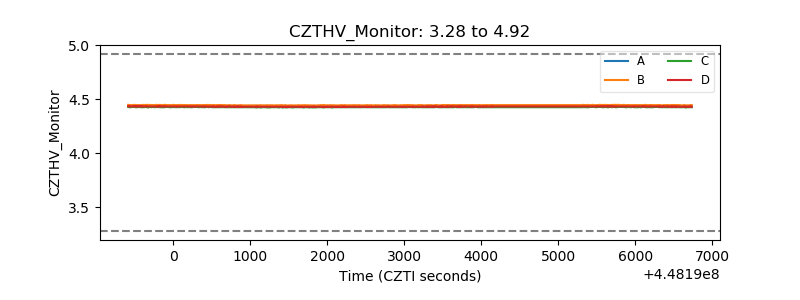 |
| D_VDD | 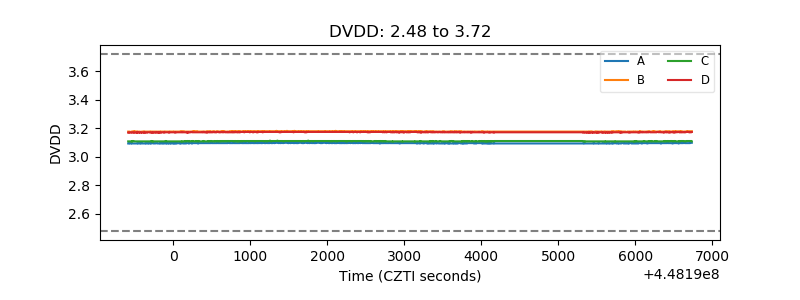 |
| Temperature 1 | 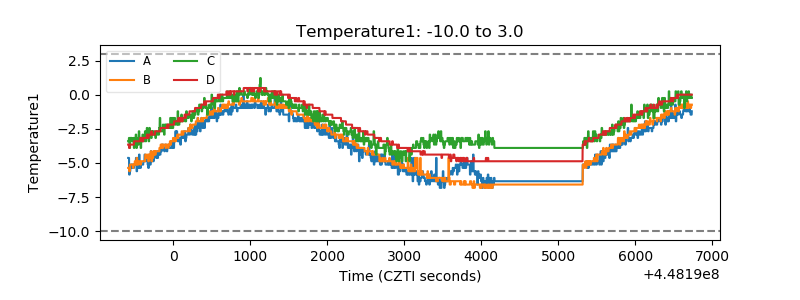 |
| Veto HV Monitor | 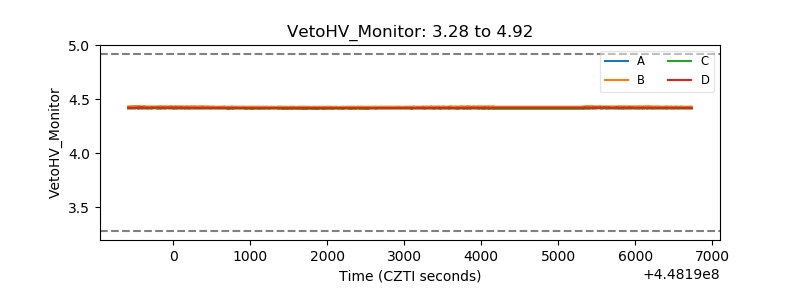 |
| Veto LLD | 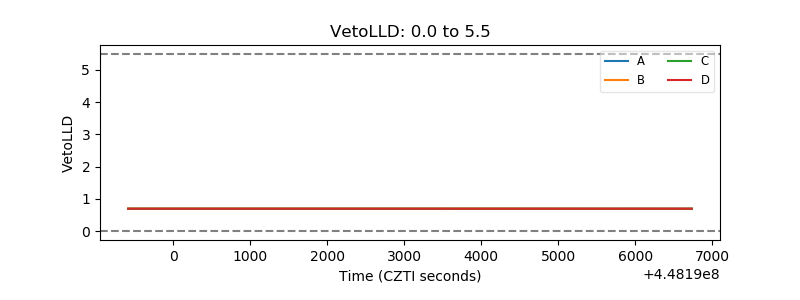 |
| Alpha Counter | 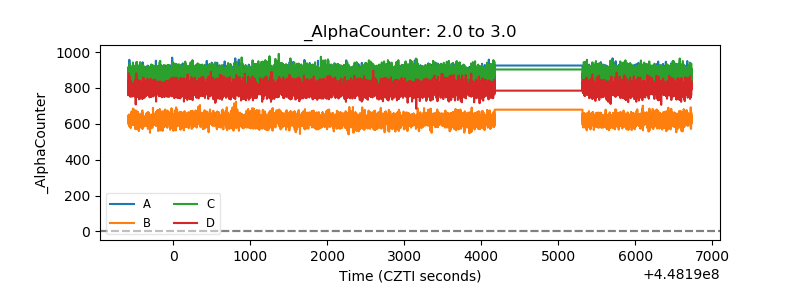 |
| _CPM_Rate | 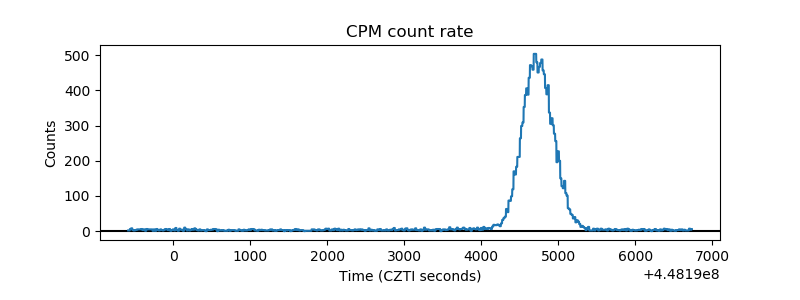 |
| CZT Counter | 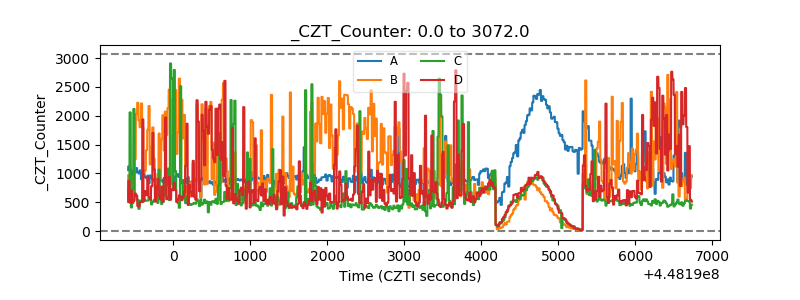 |
| +2.5 Volts monitor |  |
| +5 Volts monitor | 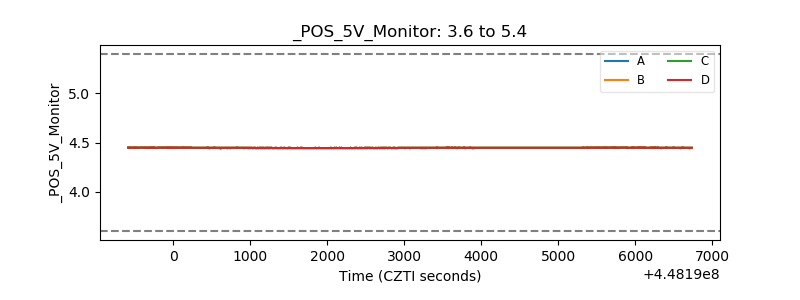 |
| _ROLL_ROT | 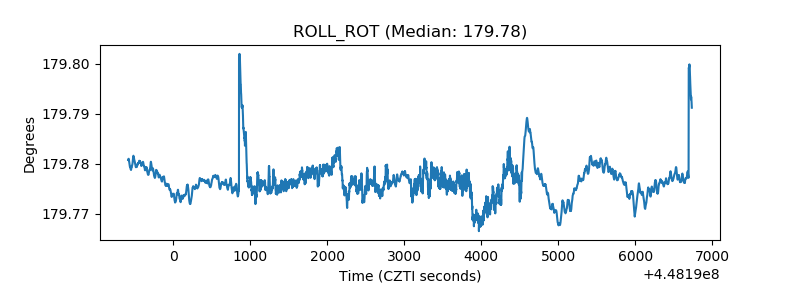 |
| _Roll_DEC | 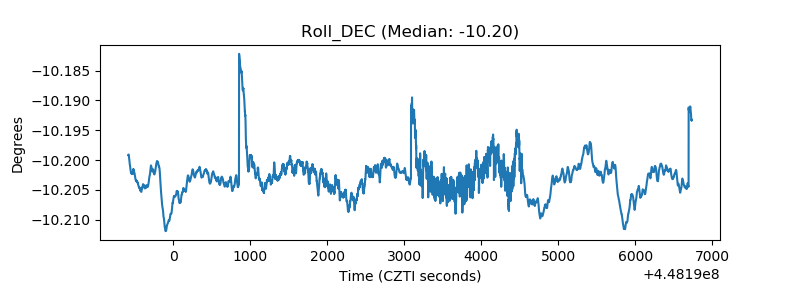 |
| _Roll_RA | 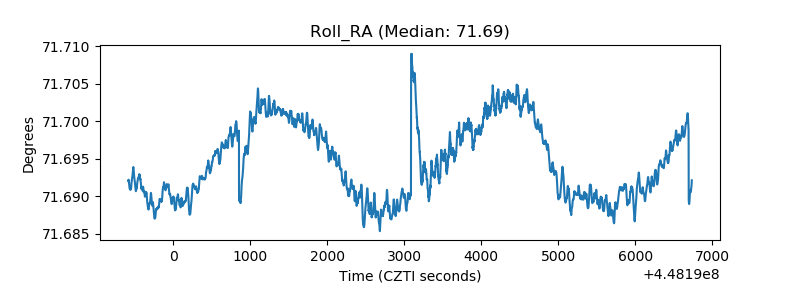 |
| Veto Counter | 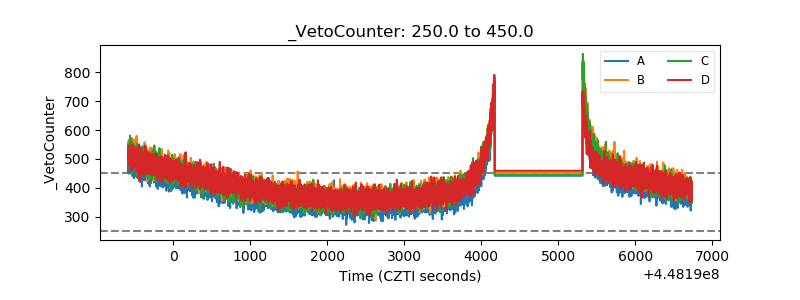 |