| Param | Original file | Final file |
|---|---|---|
| Filename | modeM0/AS1T05_183T01_9000006124_45766cztM0_level2.fits | modeM0/AS1T05_183T01_9000006124_45766cztM0_level2_quad_clean.evt |
| Size (bytes) | 649,347,840 | 105,275,520 |
| Size | 619.3 MB | 100.4 MB |
| Events in quadrant A | 6,399,219 | 709,869 |
| Events in quadrant B | 6,338,547 | 706,914 |
| Events in quadrant C | 3,246,145 | 740,197 |
| Events in quadrant D | 7,549,949 | 576,784 |
| Mode SS | |||
|---|---|---|---|
| Quadrant | BADHDUFLAG | Total packets | Discarded packets |
| A | 0 | 132 | 0 |
| B | 0 | 132 | 0 |
| C | 0 | 132 | 0 |
| D | 0 | 132 | 0 |
| Mode M0 | |||
|---|---|---|---|
| Quadrant | BADHDUFLAG | Total packets | Discarded packets |
| A | 0 | 23182 | 1 |
| B | 0 | 23525 | 1 |
| C | 0 | 14125 | 1 |
| D | 0 | 26858 | 1 |
| Mode M9 | |||
|---|---|---|---|
| Quadrant | BADHDUFLAG | Total packets | Discarded packets |
| A | 0 | 10 | 0 |
| B | 0 | 10 | 0 |
| C | 0 | 10 | 0 |
| D | 0 | 10 | 0 |
| Quadrant | Total seconds | Saturated seconds | Saturation percentage |
|---|---|---|---|
| A | 6505 | 412 | 6.333590% |
| B | 6505 | 644 | 9.900077% |
| C | 6505 | 105 | 1.614143% |
| D | 6506 | 1218 | 18.721180% |
Noise dominated data is calculated using 1-second bins in cleaned event files. If a bin has >2000 counts, and if more than 50% of those come from <1% of pixels, then it is considered to be noise-dominated and hence unusable.
| Quadrant | # 1 sec bins | Bins with >0 counts | Bins with >2000 counts | High rate bins dominated by noise | Noise dominated (total time) | Noise dominated (detector-on time) | Marked lightcurve |
|---|---|---|---|---|---|---|---|
| A | 7480 | 6506 | 78 | 78 | 1.04% | 1.20% | 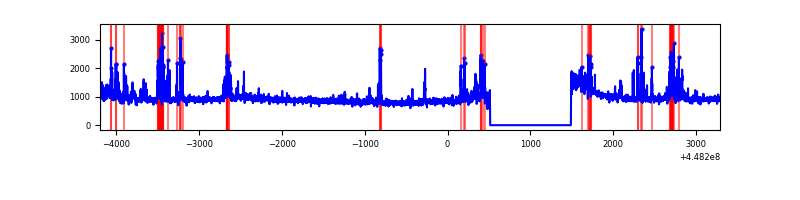 |
| B | 7480 | 6505 | 310 | 310 | 4.14% | 4.77% | 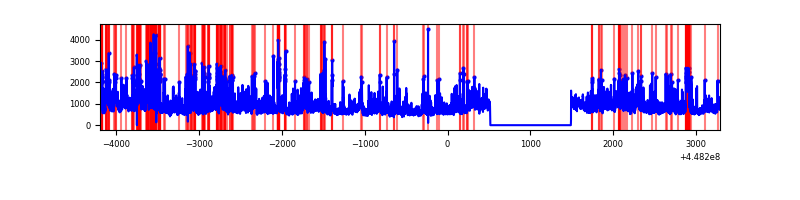 |
| C | 7480 | 6506 | 34 | 34 | 0.45% | 0.52% | 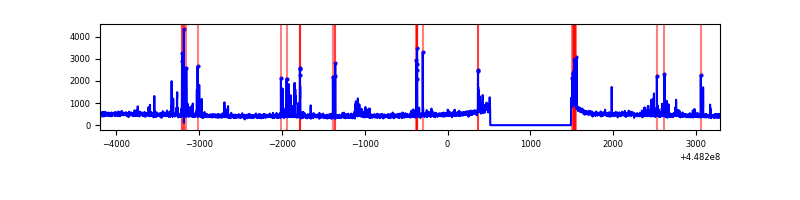 |
| D | 7481 | 6507 | 1078 | 1078 | 14.41% | 16.57% | 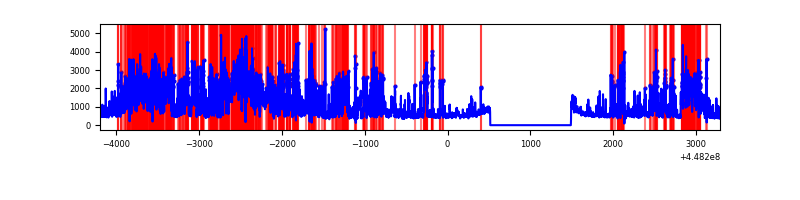 |
Top three noisy pixels from each quadrant. If the there are fewer than three noisy pixels in the level2.evt file, extra rows are filled as -1
| Pixel properties | Quadrant properties | ||||||
|---|---|---|---|---|---|---|---|
| Quadrant | DetID | PixID | Counts | Sigma | Mean | Median | Sigma |
| A | 10 | 83 | 2900464 | 18435.7 | 757 | 742 | 157.3 |
| A | 13 | 248 | 504313 | 3201.58 | 757 | 742 | 157.3 |
| A | 12 | 189 | 24398 | 150.4 | 757 | 742 | 157.3 |
| B | 3 | 112 | 1856857 | 12768.62 | 741 | 719 | 145.4 |
| B | 5 | 172 | 324812 | 2229.48 | 741 | 719 | 145.4 |
| B | 5 | 255 | 219081 | 1502.14 | 741 | 719 | 145.4 |
| C | 14 | 254 | 198033 | 1118.63 | 747 | 753 | 176.4 |
| C | 14 | 96 | 45177 | 251.9 | 747 | 753 | 176.4 |
| C | 3 | 233 | 25803 | 142.04 | 747 | 753 | 176.4 |
| D | 1 | 52 | 2144994 | 11900.15 | 706 | 687 | 180.2 |
| D | 2 | 249 | 762276 | 4226.55 | 706 | 687 | 180.2 |
| D | 13 | 249 | 741620 | 4111.92 | 706 | 687 | 180.2 |
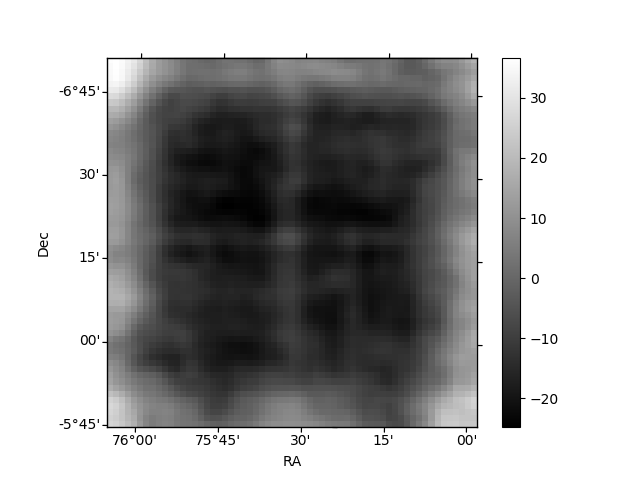
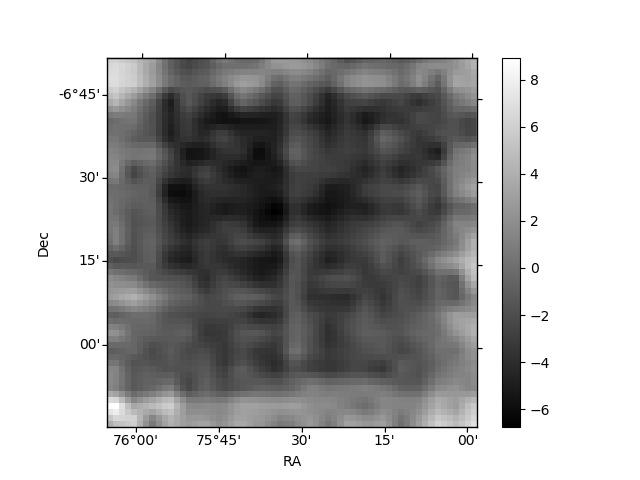
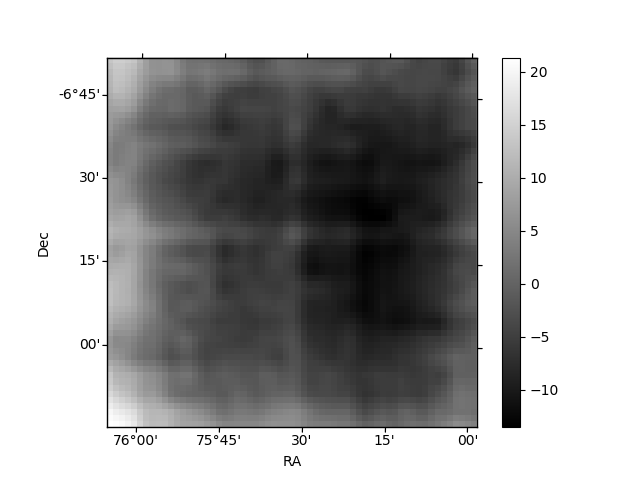
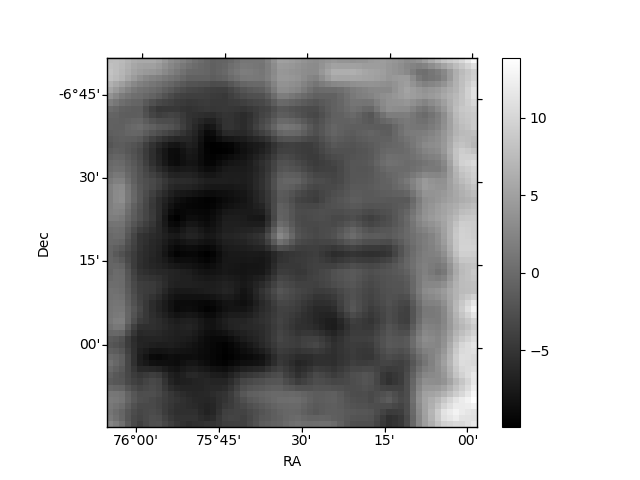
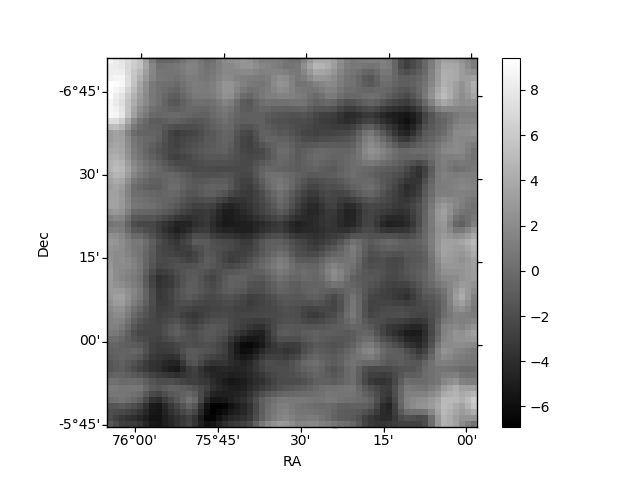
Histogram calculated using DETX and DETY for each event in the final _common_clean file
| Quadrant A | 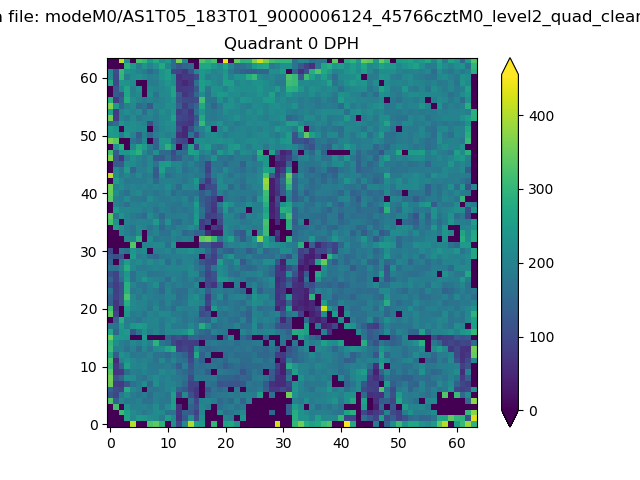 |
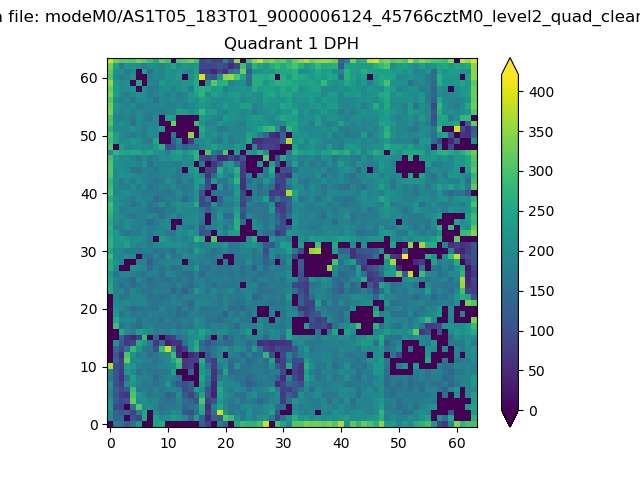 |
Quadrant B |
|---|---|---|---|
| Quadrant D | 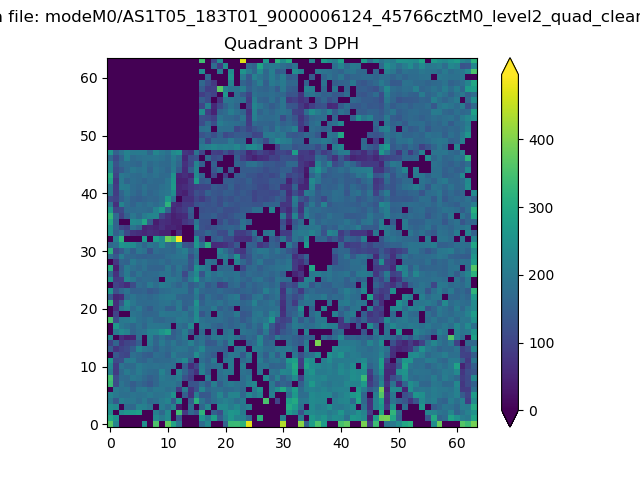 |
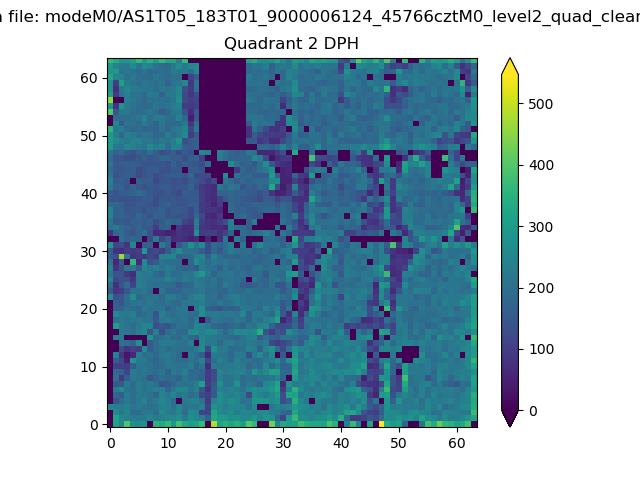 |
Quadrant C |
| Plot type | Count rate plots | Images |
|---|---|---|
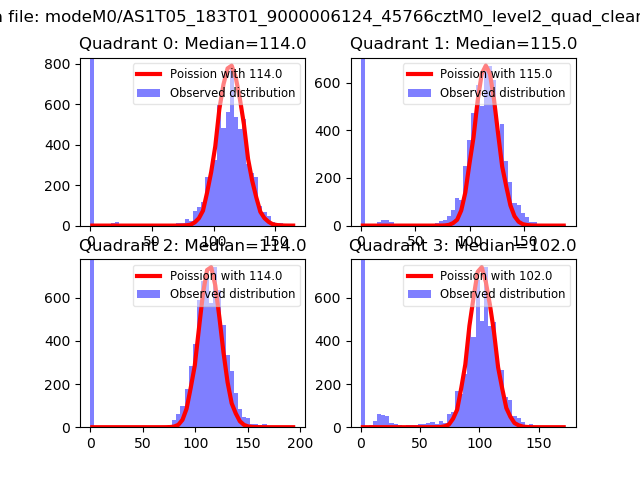
| Comparison with Poisson distribution Blue bars denote a histogram of data divided into 1 sec bins. Red curve is a Poisson curve with rate = median count rate of data. |
 |
 |
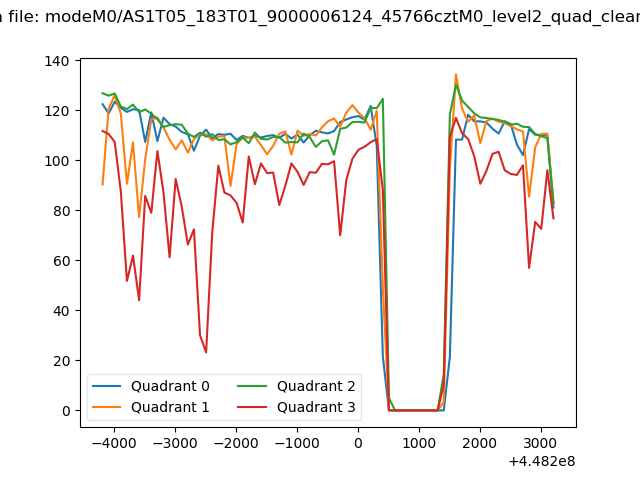
| Quadrant-wise count rates Data is divided into 100 sec bins |
 |
|
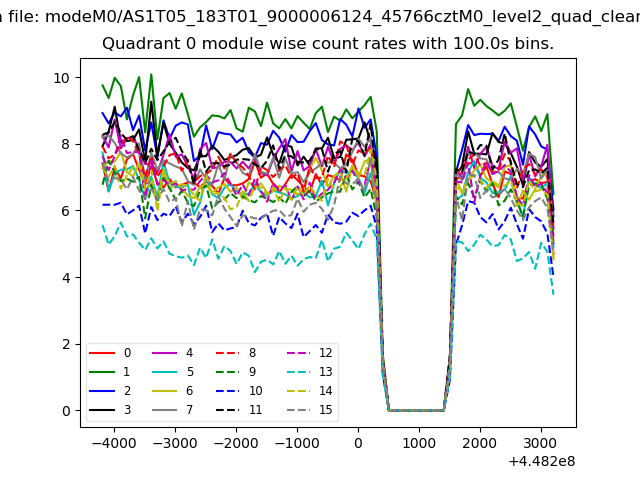
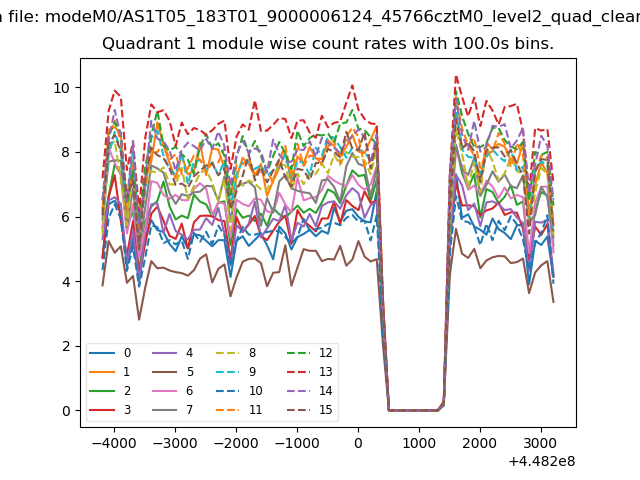
| Module-wise count rates for Quadrant A Data is divided into 100 sec bins |
 |
 |
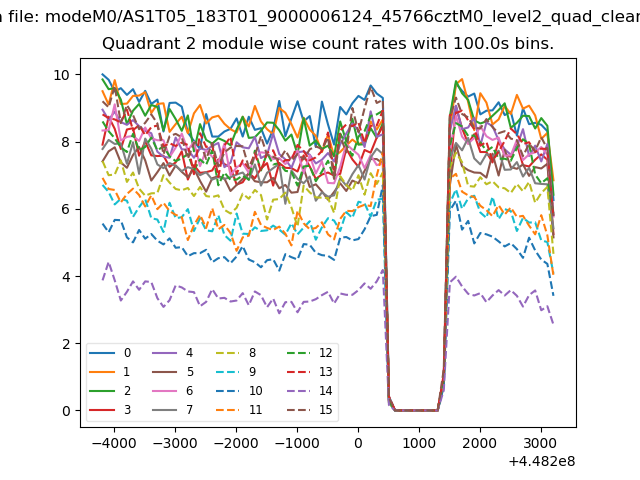
| Module-wise count rates for Quadrant B Data is divided into 100 sec bins |
 |
 |
| Module-wise count rates for Quadrant C Data is divided into 100 sec bins |
 |
 |
| Module-wise count rates for Quadrant D Data is divided into 100 sec bins |
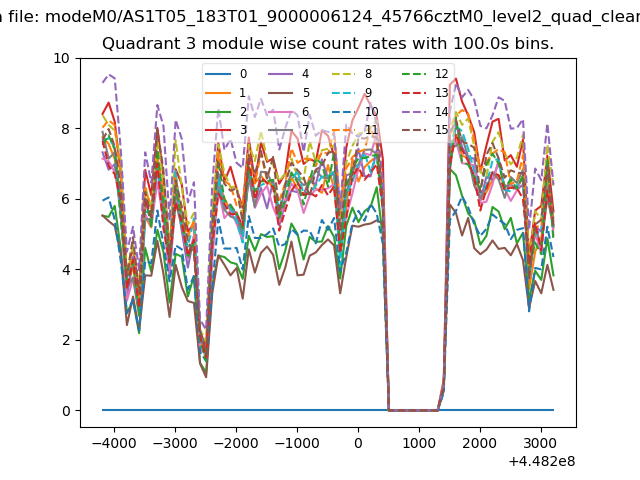 |
 |
| Parameter | Plot |
|---|---|
| CZT HV Monitor | 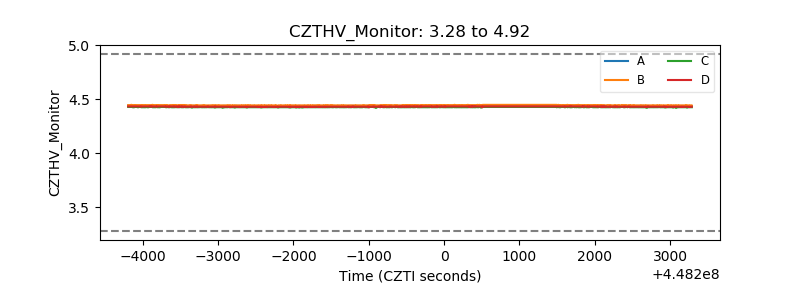 |
| D_VDD | 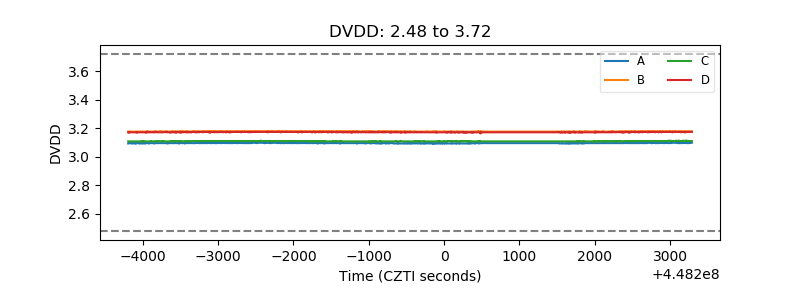 |
| Temperature 1 | 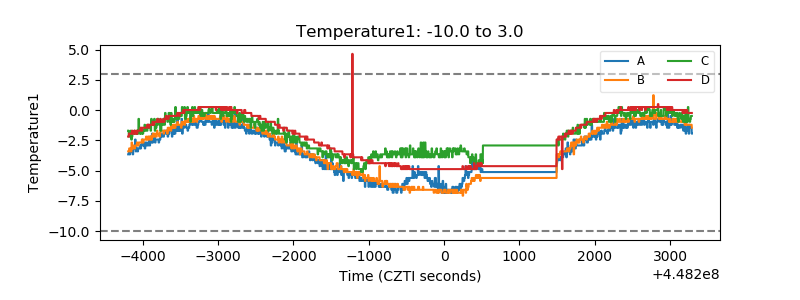 |
| Veto HV Monitor | 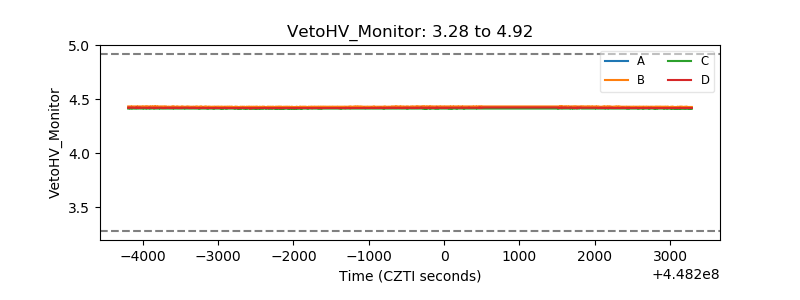 |
| Veto LLD | 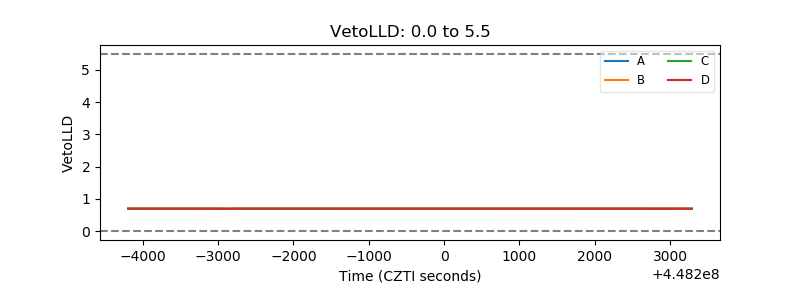 |
| Alpha Counter | 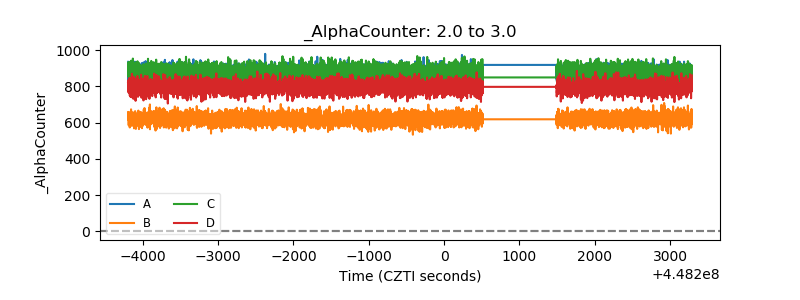 |
| _CPM_Rate | 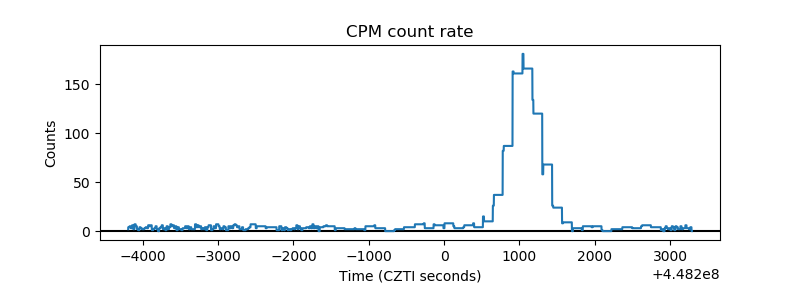 |
| CZT Counter | 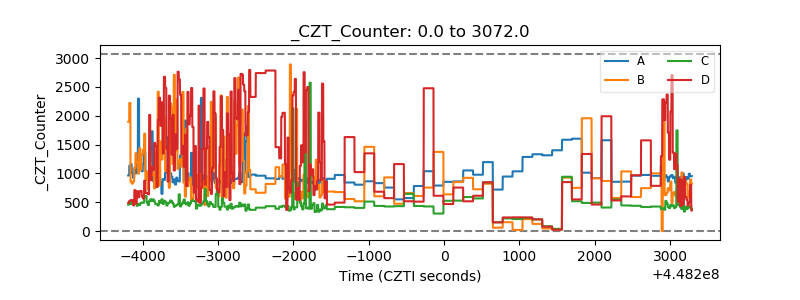 |
| +2.5 Volts monitor | 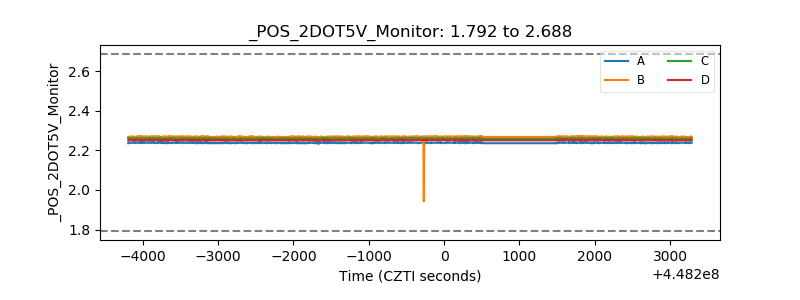 |
| +5 Volts monitor | 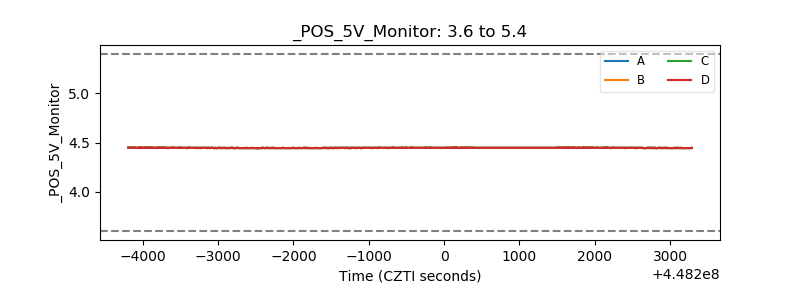 |
| _ROLL_ROT | 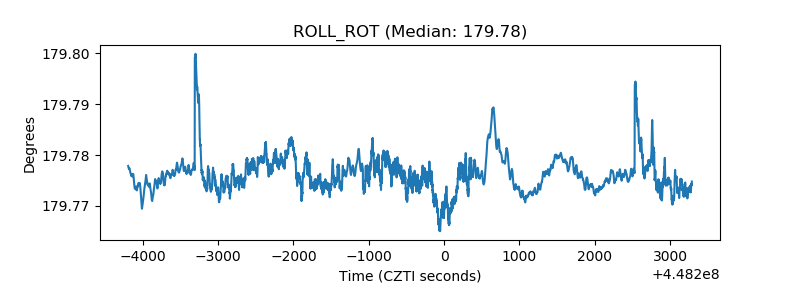 |
| _Roll_DEC | 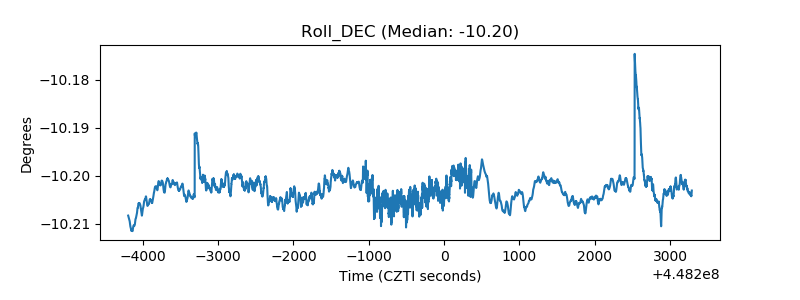 |
| _Roll_RA | 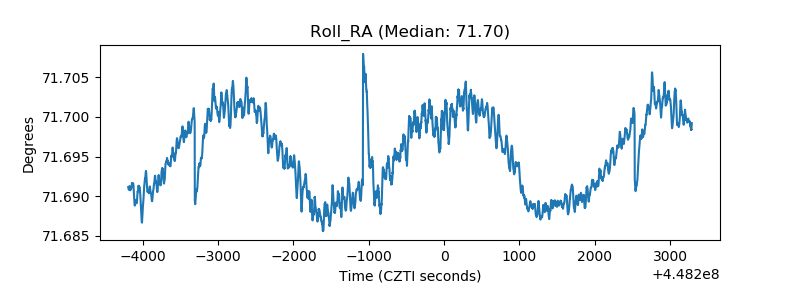 |
| Veto Counter | 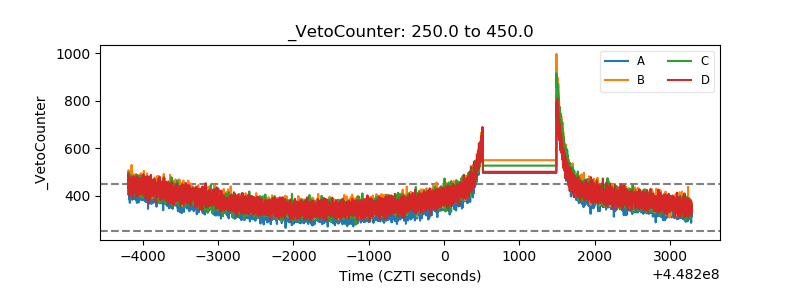 |