| Param | Original file | Final file |
|---|---|---|
| Filename | modeM0/AS1T05_183T01_9000006124_45767cztM0_level2.fits | modeM0/AS1T05_183T01_9000006124_45767cztM0_level2_quad_clean.evt |
| Size (bytes) | 657,144,000 | 107,288,640 |
| Size | 626.7 MB | 102.3 MB |
| Events in quadrant A | 6,743,100 | 716,083 |
| Events in quadrant B | 7,497,035 | 687,041 |
| Events in quadrant C | 3,438,891 | 754,499 |
| Events in quadrant D | 6,115,376 | 612,748 |
| Mode SS | |||
|---|---|---|---|
| Quadrant | BADHDUFLAG | Total packets | Discarded packets |
| A | 0 | 138 | 0 |
| B | 0 | 138 | 0 |
| C | 0 | 138 | 0 |
| D | 0 | 138 | 0 |
| Mode M0 | |||
|---|---|---|---|
| Quadrant | BADHDUFLAG | Total packets | Discarded packets |
| A | 0 | 24588 | 3 |
| B | 0 | 27247 | 1 |
| C | 0 | 15024 | 1 |
| D | 0 | 22882 | 1 |
| Mode M9 | |||
|---|---|---|---|
| Quadrant | BADHDUFLAG | Total packets | Discarded packets |
| A | 0 | 6 | 0 |
| B | 0 | 6 | 0 |
| C | 0 | 6 | 0 |
| D | 0 | 6 | 0 |
| Quadrant | Total seconds | Saturated seconds | Saturation percentage |
|---|---|---|---|
| A | 6859 | 481 | 7.012684% |
| B | 6860 | 1063 | 15.495627% |
| C | 6860 | 111 | 1.618076% |
| D | 6860 | 952 | 13.877551% |
Noise dominated data is calculated using 1-second bins in cleaned event files. If a bin has >2000 counts, and if more than 50% of those come from <1% of pixels, then it is considered to be noise-dominated and hence unusable.
| Quadrant | # 1 sec bins | Bins with >0 counts | Bins with >2000 counts | High rate bins dominated by noise | Noise dominated (total time) | Noise dominated (detector-on time) | Marked lightcurve |
|---|---|---|---|---|---|---|---|
| A | 7414 | 6860 | 136 | 136 | 1.83% | 1.98% | 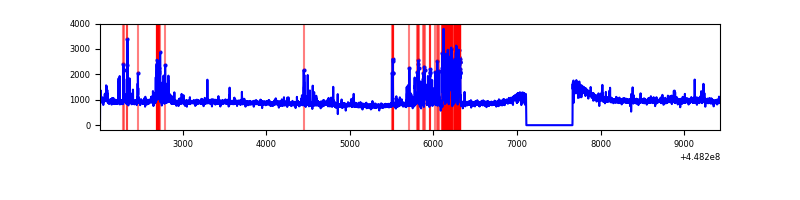 |
| B | 7415 | 6861 | 477 | 477 | 6.43% | 6.95% | 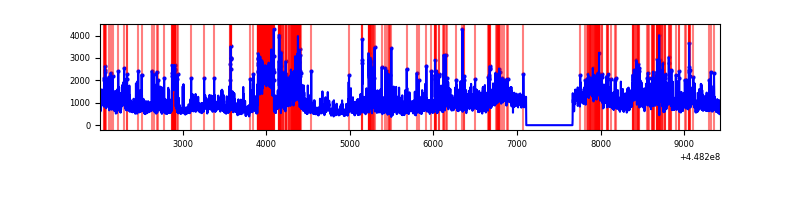 |
| C | 7415 | 6861 | 31 | 31 | 0.42% | 0.45% | 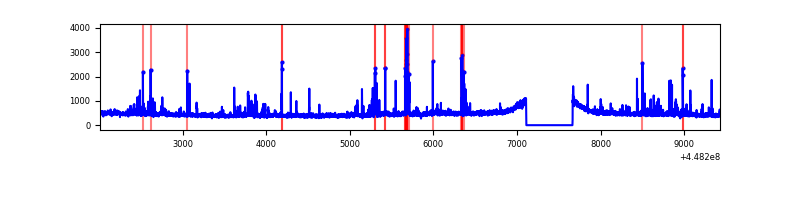 |
| D | 7415 | 6861 | 723 | 723 | 9.75% | 10.54% | 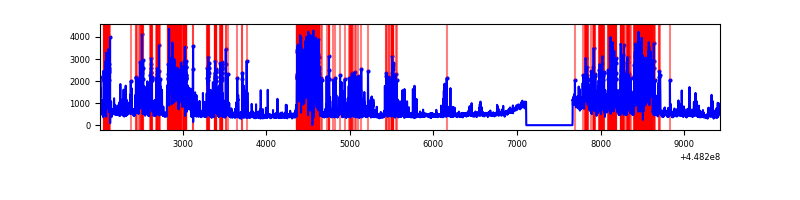 |
Top three noisy pixels from each quadrant. If the there are fewer than three noisy pixels in the level2.evt file, extra rows are filled as -1
| Pixel properties | Quadrant properties | ||||||
|---|---|---|---|---|---|---|---|
| Quadrant | DetID | PixID | Counts | Sigma | Mean | Median | Sigma |
| A | 10 | 83 | 3049707 | 18342.07 | 790 | 772 | 166.2 |
| A | 13 | 248 | 581044 | 3490.86 | 790 | 772 | 166.2 |
| A | 14 | 235 | 24898 | 145.14 | 790 | 772 | 166.2 |
| B | 3 | 112 | 2858482 | 18659.93 | 766 | 744 | 153.1 |
| B | 0 | 171 | 420421 | 2740.33 | 766 | 744 | 153.1 |
| B | 15 | 201 | 399947 | 2606.64 | 766 | 744 | 153.1 |
| C | 14 | 254 | 276989 | 1482.45 | 787 | 795 | 186.3 |
| C | 3 | 233 | 43268 | 227.97 | 787 | 795 | 186.3 |
| C | 14 | 96 | 16497 | 84.28 | 787 | 795 | 186.3 |
| D | 2 | 249 | 1502287 | 7895.9 | 749 | 725 | 190.2 |
| D | 13 | 249 | 738501 | 3879.57 | 749 | 725 | 190.2 |
| D | 8 | 48 | 476039 | 2499.42 | 749 | 725 | 190.2 |
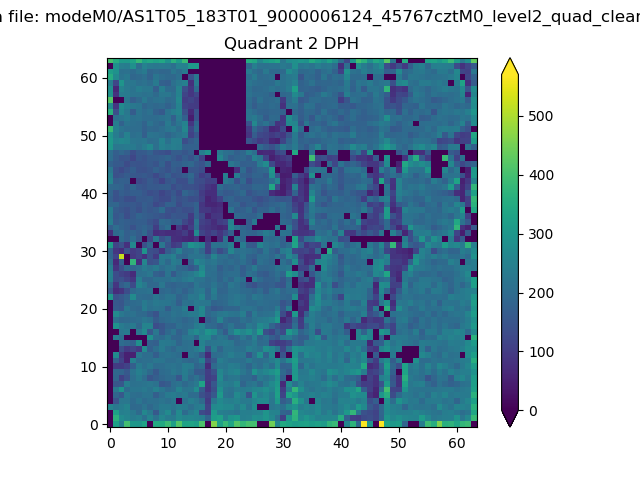
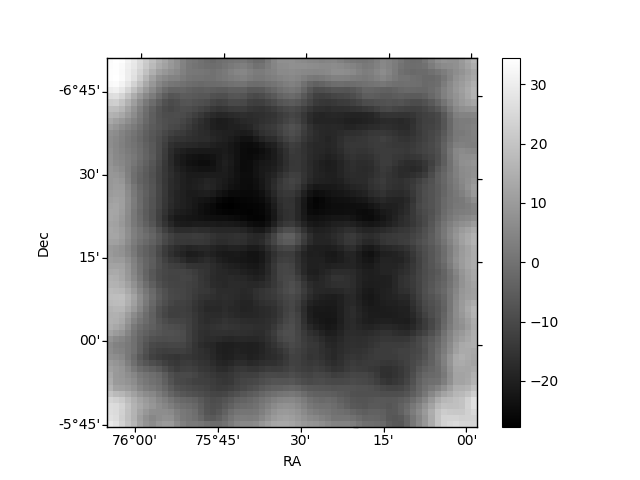
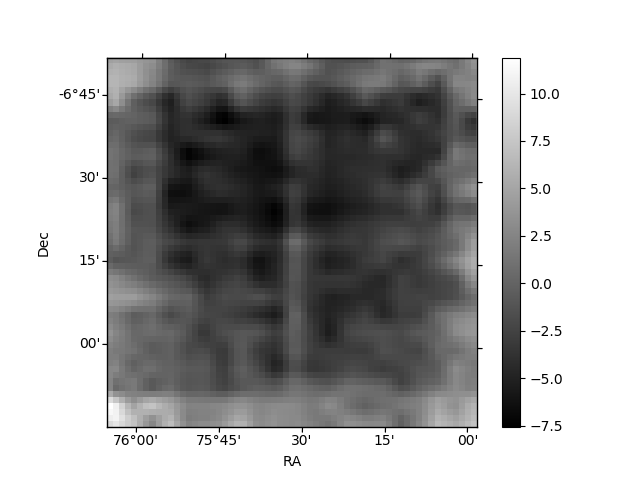
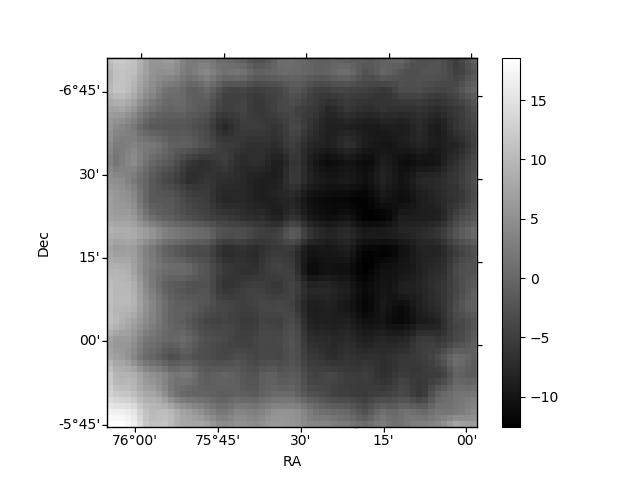
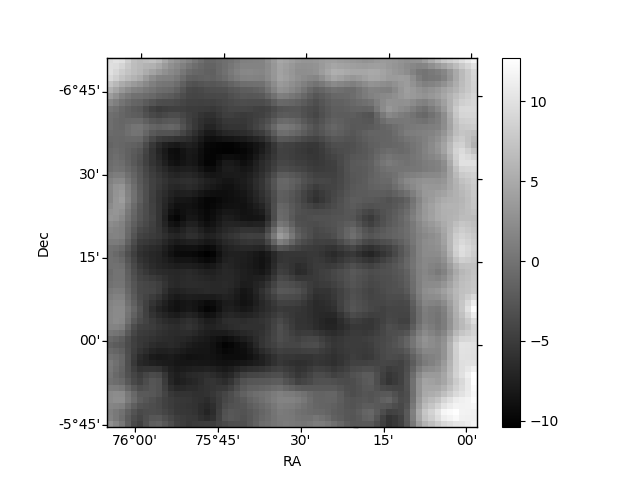
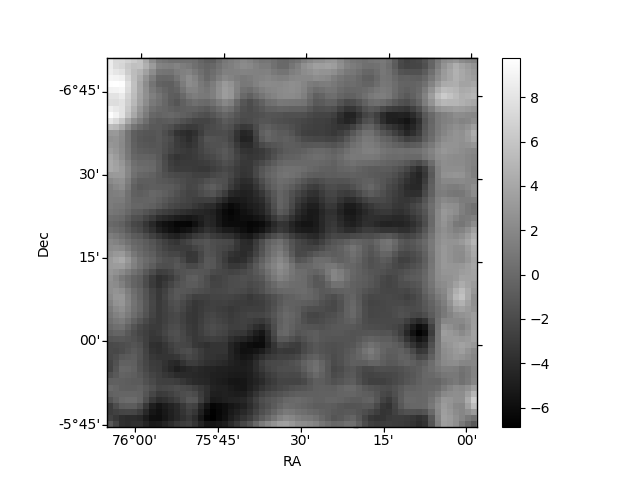
Histogram calculated using DETX and DETY for each event in the final _common_clean file
| Quadrant A | 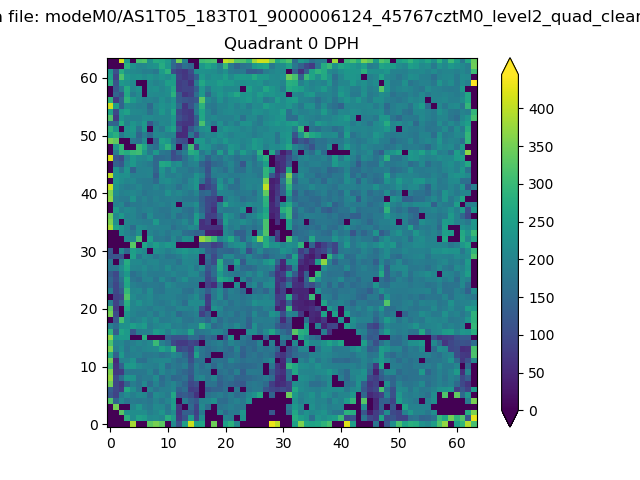 |
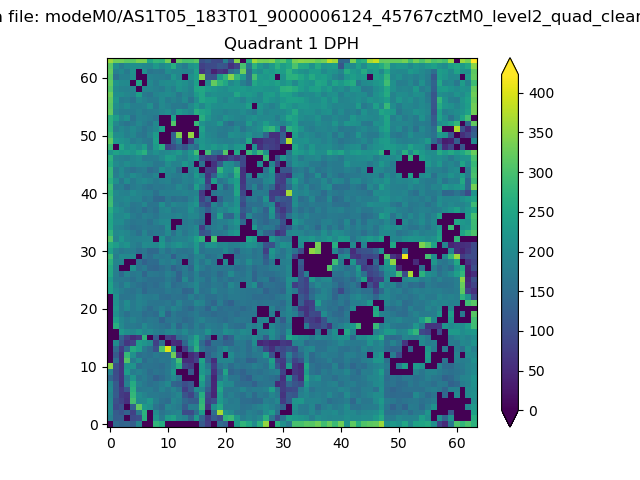 |
Quadrant B |
|---|---|---|---|
| Quadrant D | 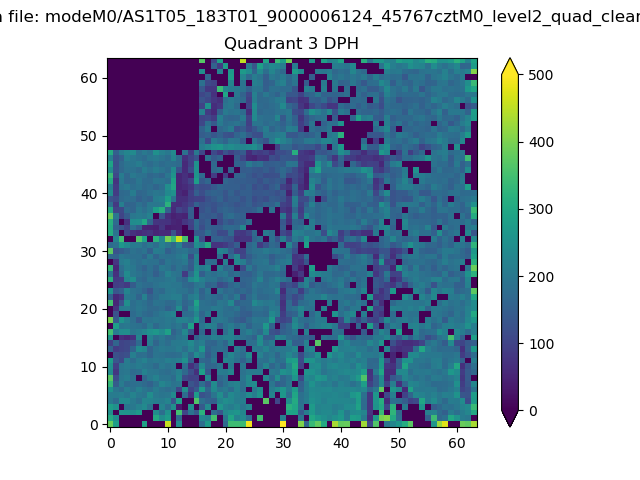 |
 |
Quadrant C |
| Plot type | Count rate plots | Images |
|---|---|---|
| Comparison with Poisson distribution Blue bars denote a histogram of data divided into 1 sec bins. Red curve is a Poisson curve with rate = median count rate of data. |
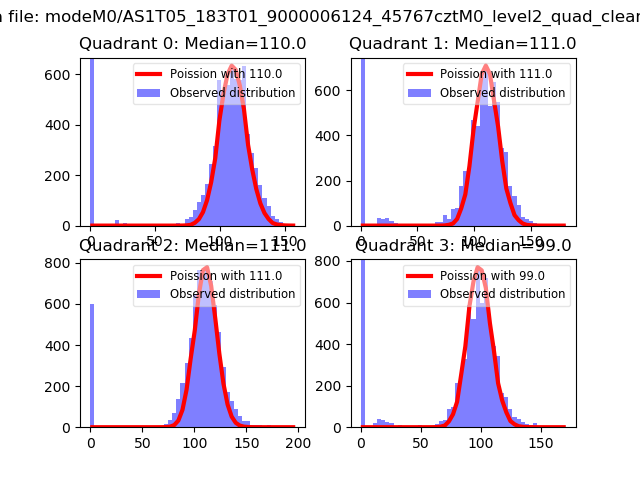 |
 |
| Quadrant-wise count rates Data is divided into 100 sec bins |
 |
|
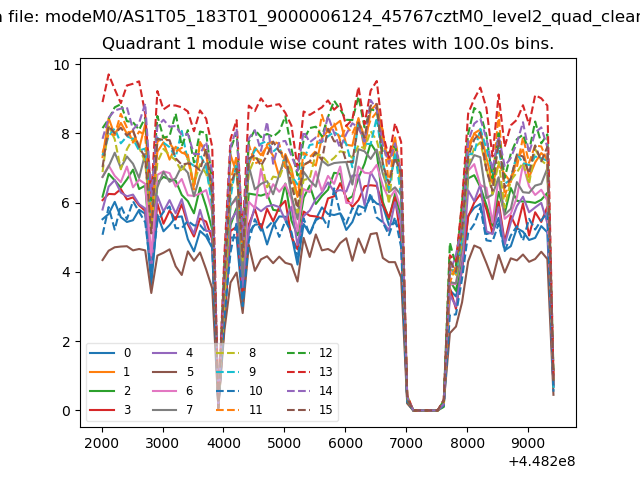
| Module-wise count rates for Quadrant A Data is divided into 100 sec bins |
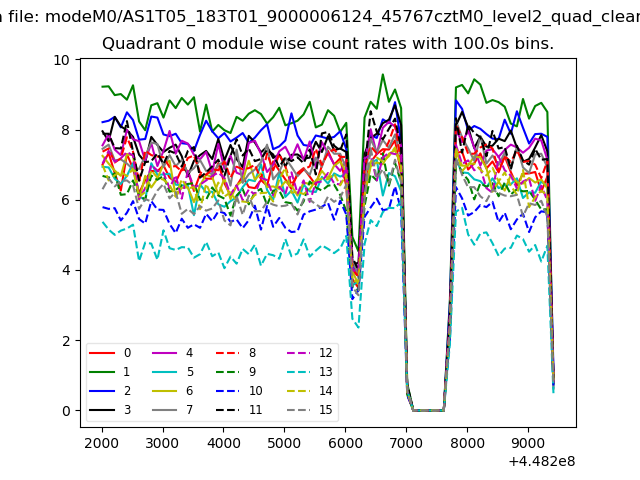 |
 |
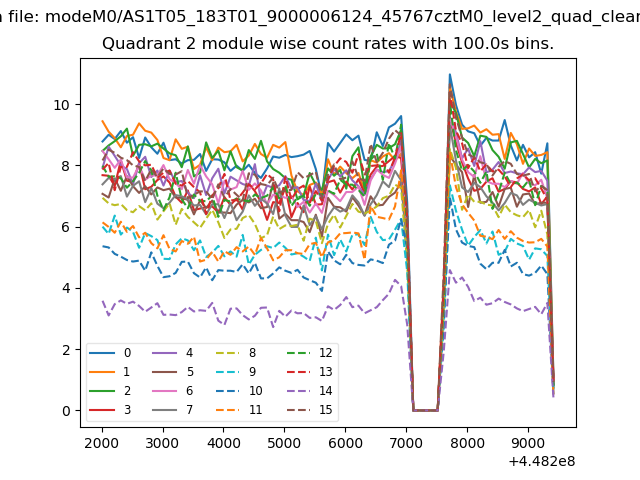
| Module-wise count rates for Quadrant B Data is divided into 100 sec bins |
 |
 |
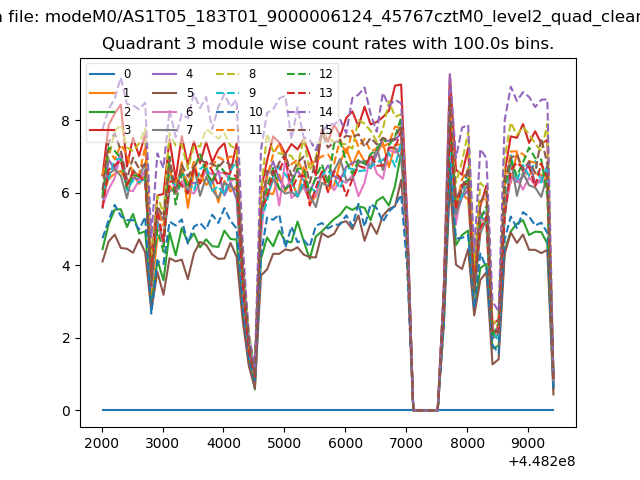
| Module-wise count rates for Quadrant C Data is divided into 100 sec bins |
 |
 |
| Module-wise count rates for Quadrant D Data is divided into 100 sec bins |
 |
 |
| Parameter | Plot |
|---|---|
| CZT HV Monitor | 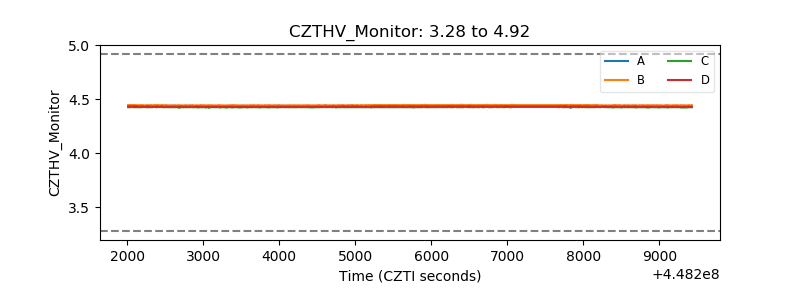 |
| D_VDD | 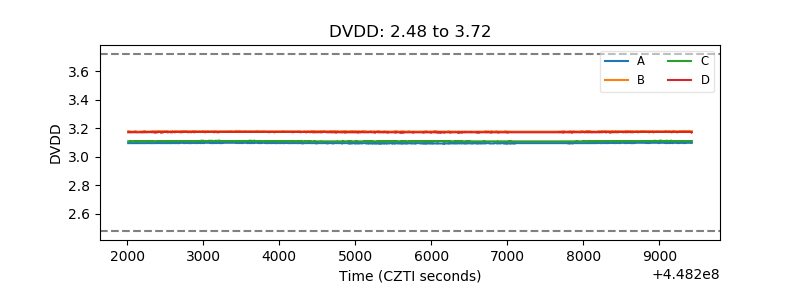 |
| Temperature 1 | 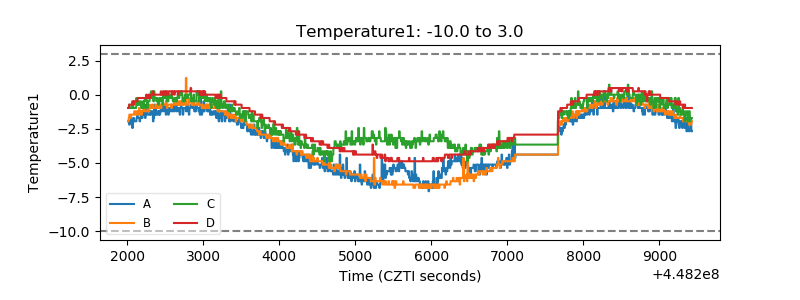 |
| Veto HV Monitor | 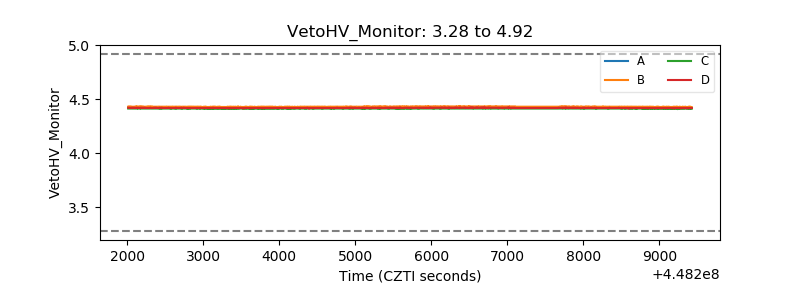 |
| Veto LLD | 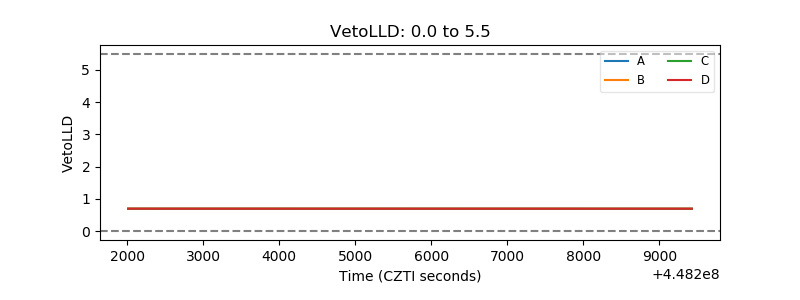 |
| Alpha Counter | 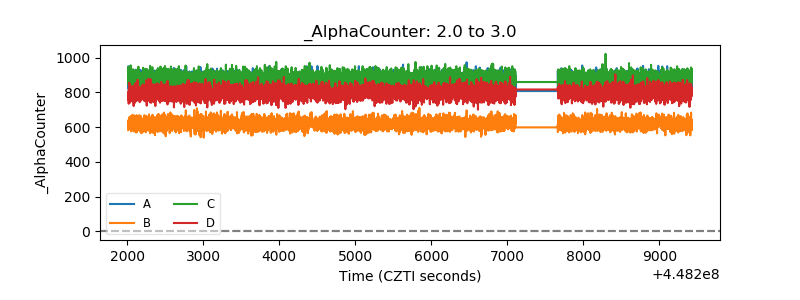 |
| _CPM_Rate | 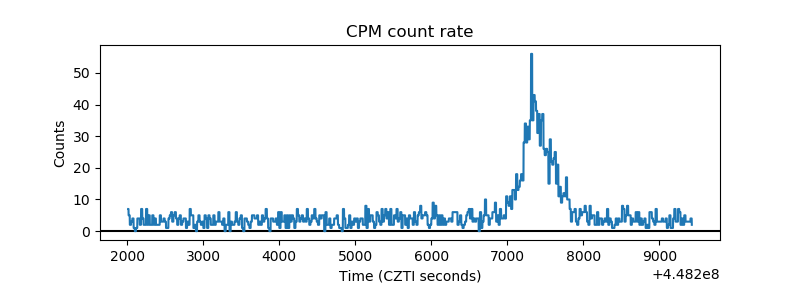 |
| CZT Counter | 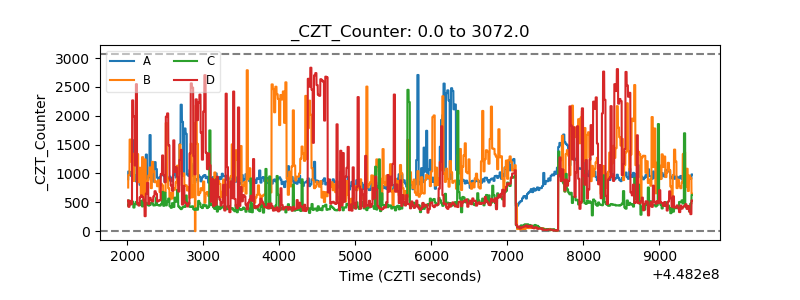 |
| +2.5 Volts monitor | 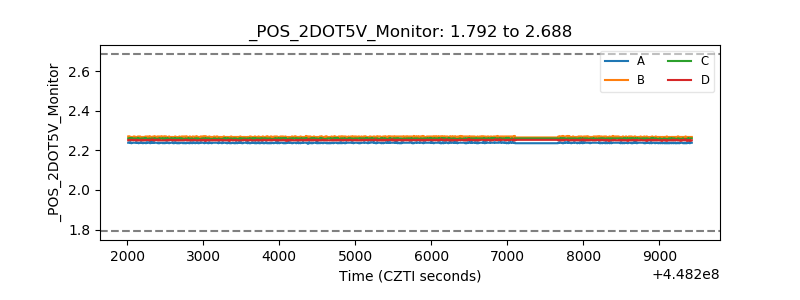 |
| +5 Volts monitor | 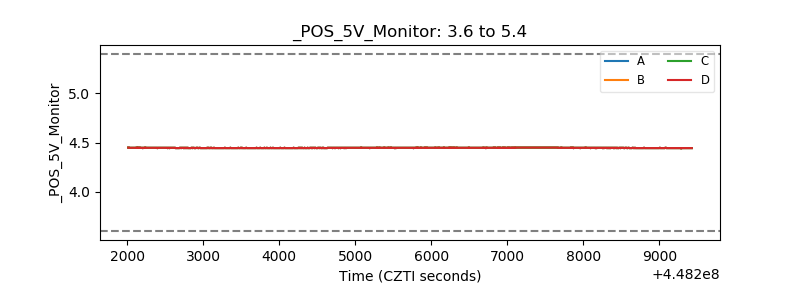 |
| _ROLL_ROT | 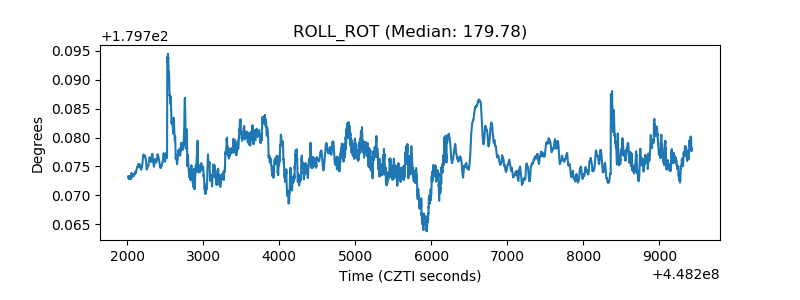 |
| _Roll_DEC | 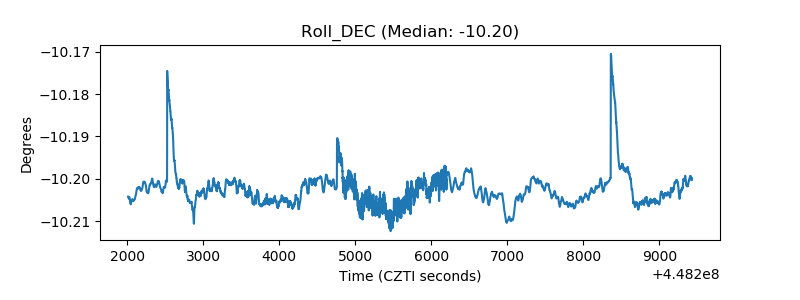 |
| _Roll_RA | 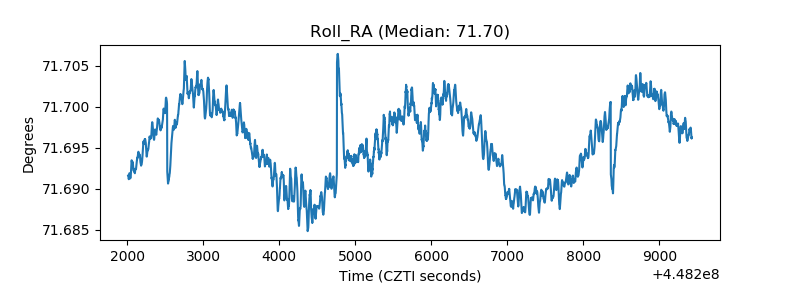 |
| Veto Counter | 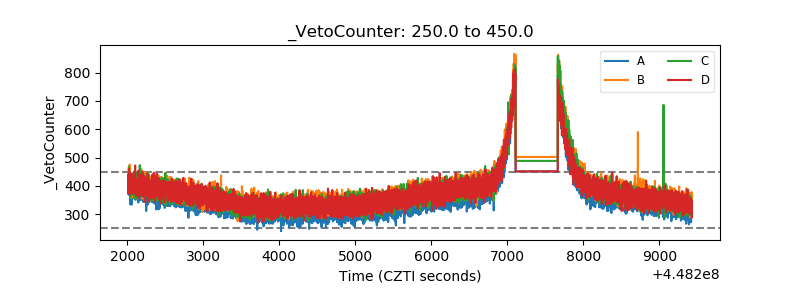 |