| Param | Original file | Final file |
|---|---|---|
| Filename | modeM0/AS1T05_183T01_9000006124_45768cztM0_level2.fits | modeM0/AS1T05_183T01_9000006124_45768cztM0_level2_quad_clean.evt |
| Size (bytes) | 721,356,480 | 112,184,640 |
| Size | 687.9 MB | 107.0 MB |
| Events in quadrant A | 6,990,970 | 788,780 |
| Events in quadrant B | 9,815,217 | 616,481 |
| Events in quadrant C | 3,871,013 | 801,244 |
| Events in quadrant D | 5,457,747 | 679,655 |
| Mode SS | |||
|---|---|---|---|
| Quadrant | BADHDUFLAG | Total packets | Discarded packets |
| A | 0 | 146 | 0 |
| B | 0 | 146 | 0 |
| C | 0 | 146 | 0 |
| D | 0 | 146 | 0 |
| Mode M0 | |||
|---|---|---|---|
| Quadrant | BADHDUFLAG | Total packets | Discarded packets |
| A | 0 | 25942 | 4 |
| B | 0 | 34339 | 1 |
| C | 0 | 16661 | 1 |
| D | 0 | 21209 | 1 |
| Quadrant | Total seconds | Saturated seconds | Saturation percentage |
|---|---|---|---|
| A | 7332 | 302 | 4.118931% |
| B | 7333 | 2086 | 28.446748% |
| C | 7333 | 78 | 1.063685% |
| D | 7333 | 639 | 8.714032% |
Noise dominated data is calculated using 1-second bins in cleaned event files. If a bin has >2000 counts, and if more than 50% of those come from <1% of pixels, then it is considered to be noise-dominated and hence unusable.
| Quadrant | # 1 sec bins | Bins with >0 counts | Bins with >2000 counts | High rate bins dominated by noise | Noise dominated (total time) | Noise dominated (detector-on time) | Marked lightcurve |
|---|---|---|---|---|---|---|---|
| A | 7347 | 7333 | 63 | 63 | 0.86% | 0.86% | 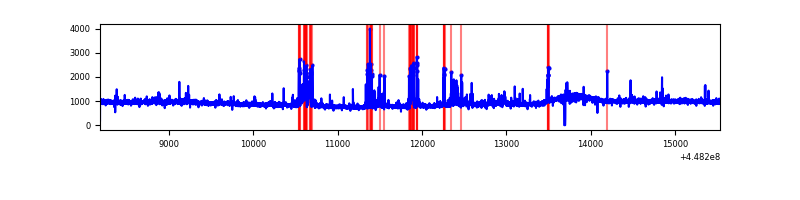 |
| B | 7348 | 7334 | 1214 | 1214 | 16.52% | 16.55% | 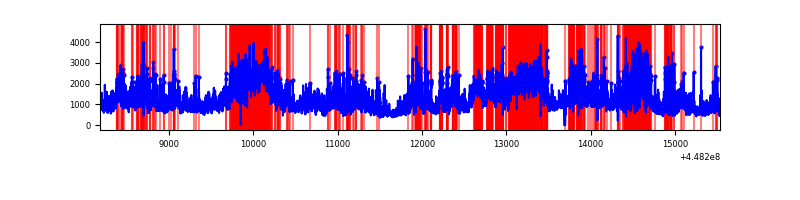 |
| C | 7348 | 7334 | 46 | 46 | 0.63% | 0.63% | 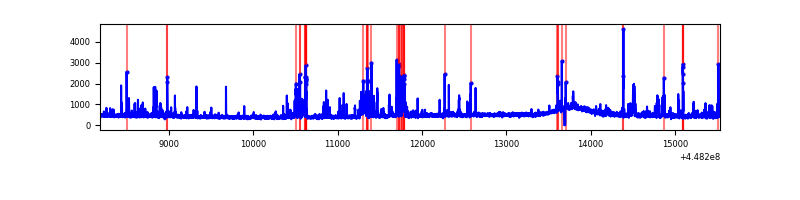 |
| D | 7348 | 7334 | 474 | 474 | 6.45% | 6.46% | 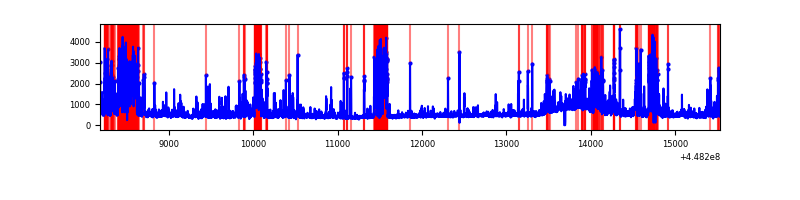 |
Top three noisy pixels from each quadrant. If the there are fewer than three noisy pixels in the level2.evt file, extra rows are filled as -1
| Pixel properties | Quadrant properties | ||||||
|---|---|---|---|---|---|---|---|
| Quadrant | DetID | PixID | Counts | Sigma | Mean | Median | Sigma |
| A | 10 | 83 | 3225550 | 17737.15 | 858 | 836 | 181.8 |
| A | 13 | 248 | 285785 | 1567.33 | 858 | 836 | 181.8 |
| A | 14 | 235 | 104010 | 567.5 | 858 | 836 | 181.8 |
| B | 3 | 112 | 4178269 | 28083.2 | 752 | 730 | 148.8 |
| B | 12 | 18 | 1381145 | 9279.74 | 752 | 730 | 148.8 |
| B | 0 | 171 | 498355 | 3345.25 | 752 | 730 | 148.8 |
| C | 14 | 96 | 230406 | 1144.88 | 843 | 847 | 200.5 |
| C | 14 | 254 | 178708 | 887.05 | 843 | 847 | 200.5 |
| C | 1 | 3 | 78868 | 389.11 | 843 | 847 | 200.5 |
| D | 2 | 249 | 1148687 | 5559.44 | 813 | 787 | 206.5 |
| D | 13 | 249 | 475388 | 2298.56 | 813 | 787 | 206.5 |
| D | 11 | 176 | 303976 | 1468.39 | 813 | 787 | 206.5 |
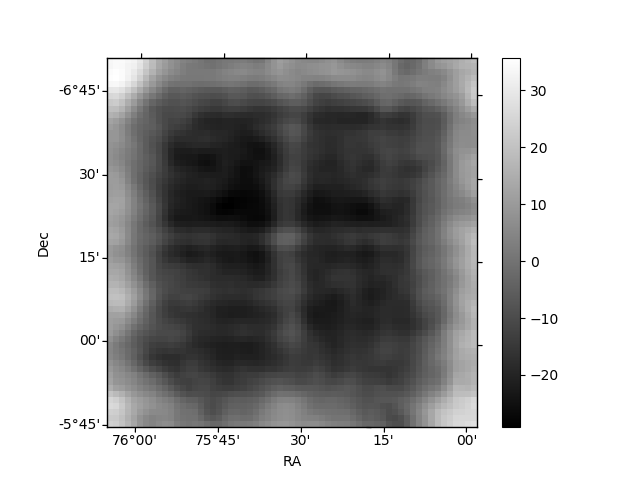
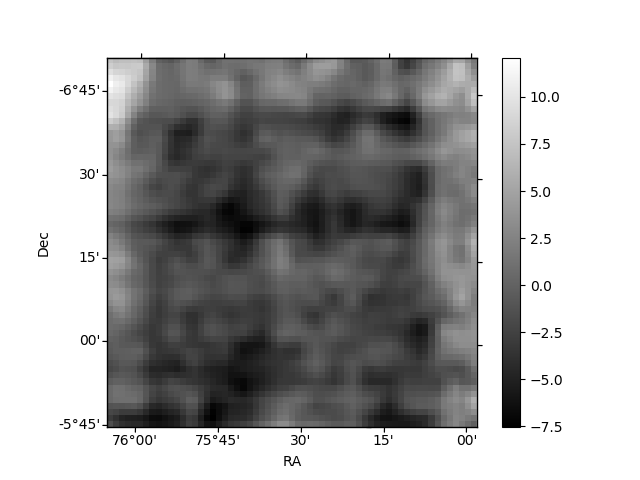
Histogram calculated using DETX and DETY for each event in the final _common_clean file
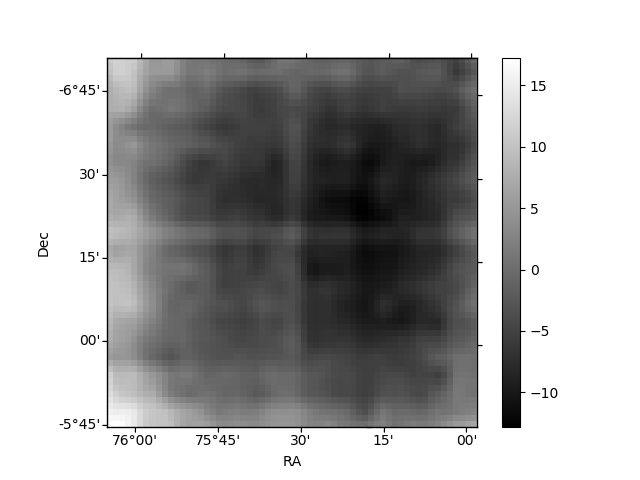
| Quadrant A | 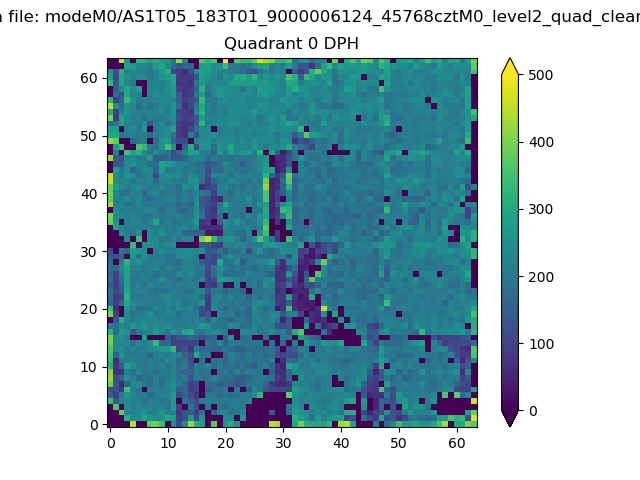 |
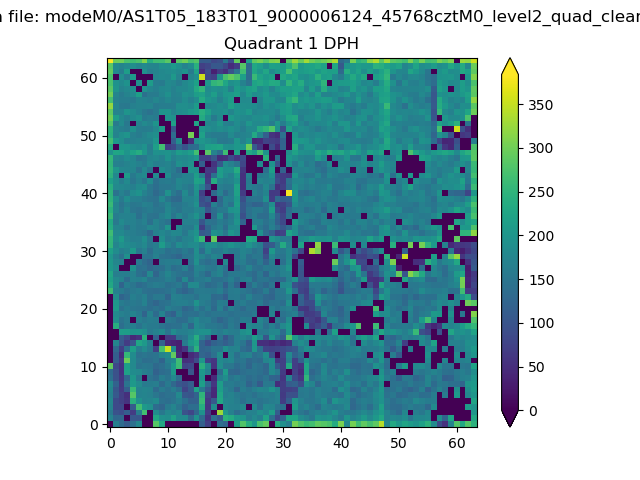 |
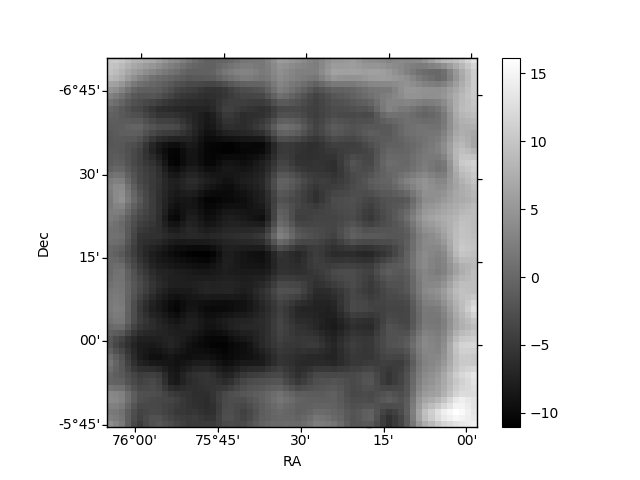
Quadrant B |
|---|---|---|---|
| Quadrant D | 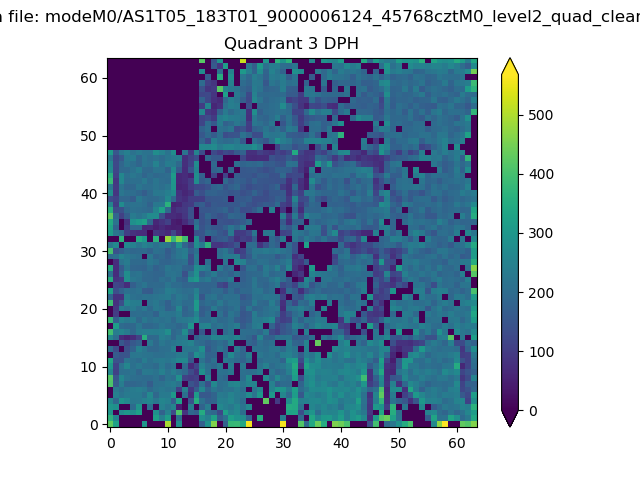 |
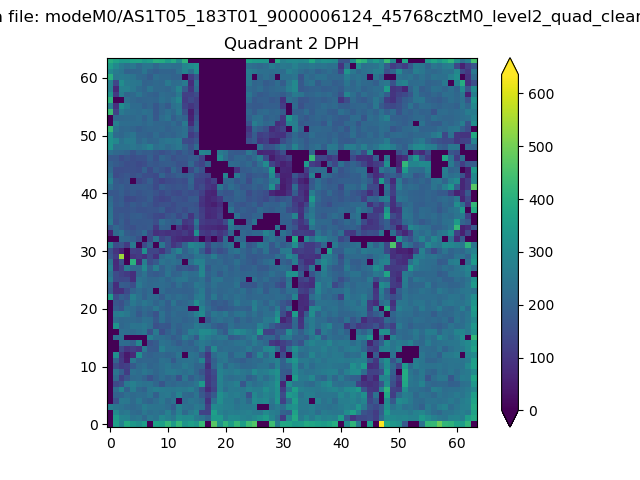 |
Quadrant C |
| Plot type | Count rate plots | Images |
|---|---|---|
| Comparison with Poisson distribution Blue bars denote a histogram of data divided into 1 sec bins. Red curve is a Poisson curve with rate = median count rate of data. |
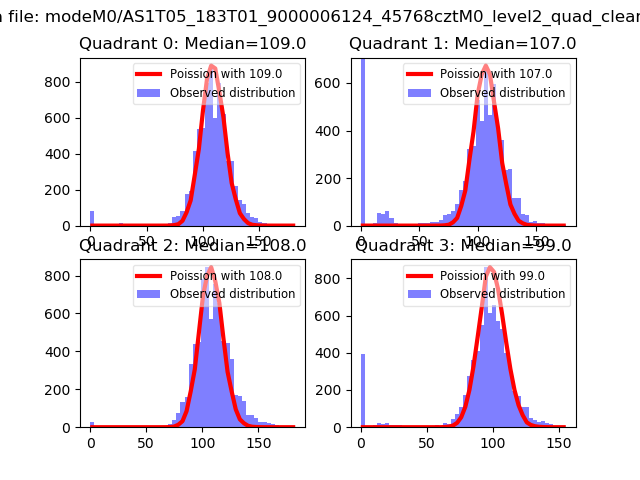 |
 |
| Quadrant-wise count rates Data is divided into 100 sec bins |
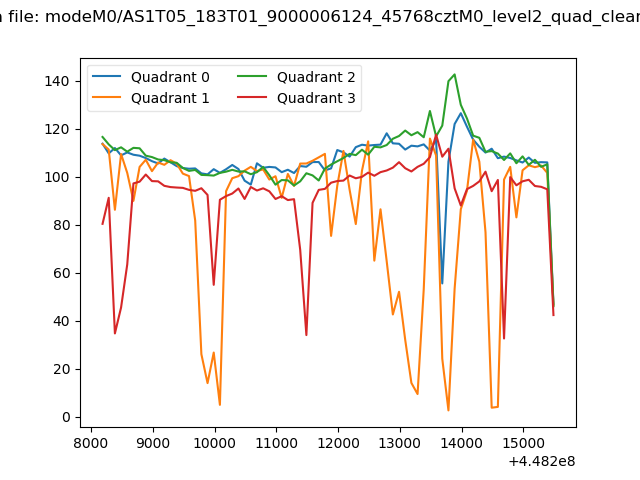 |
|
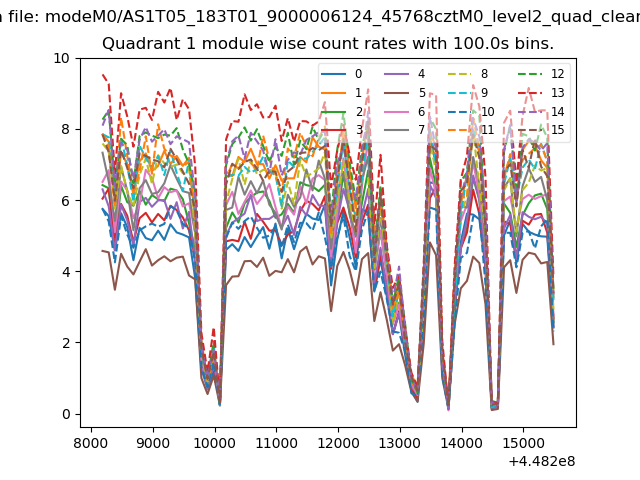
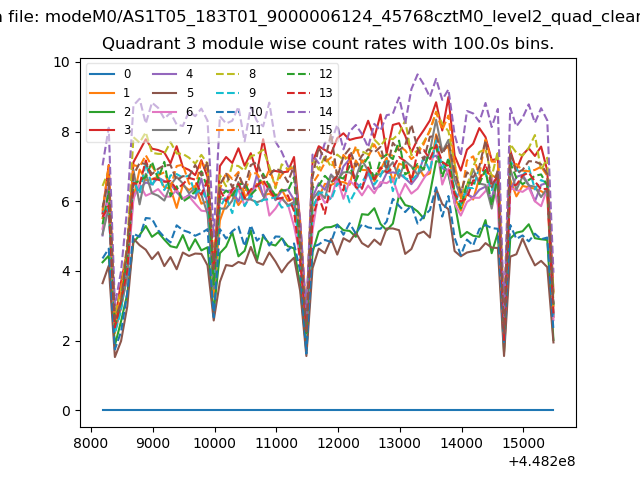
| Module-wise count rates for Quadrant A Data is divided into 100 sec bins |
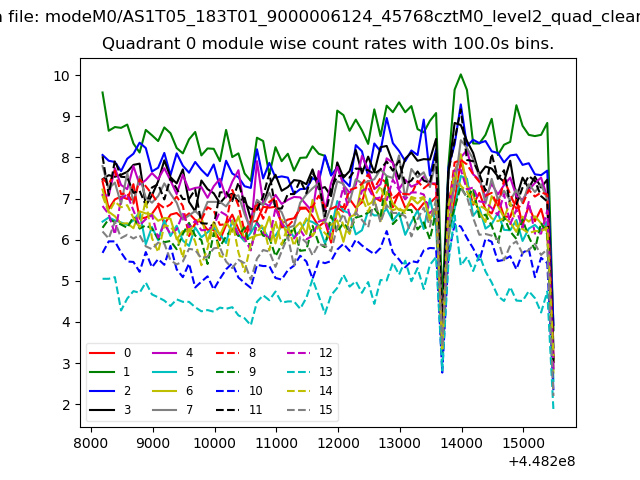 |
 |
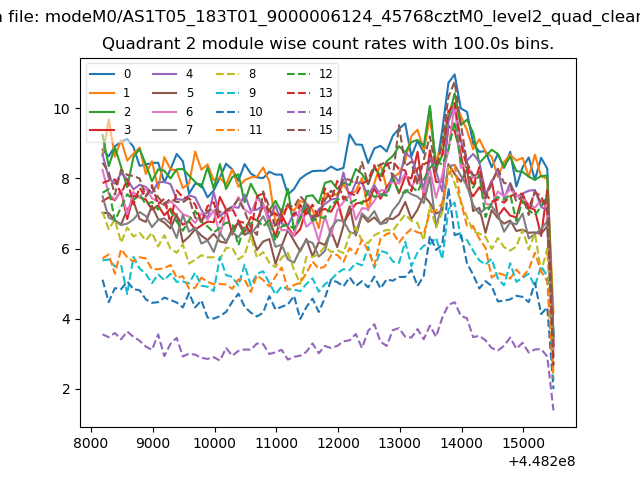
| Module-wise count rates for Quadrant B Data is divided into 100 sec bins |
 |
 |
| Module-wise count rates for Quadrant C Data is divided into 100 sec bins |
 |
 |
| Module-wise count rates for Quadrant D Data is divided into 100 sec bins |
 |
 |
| Parameter | Plot |
|---|---|
| CZT HV Monitor | 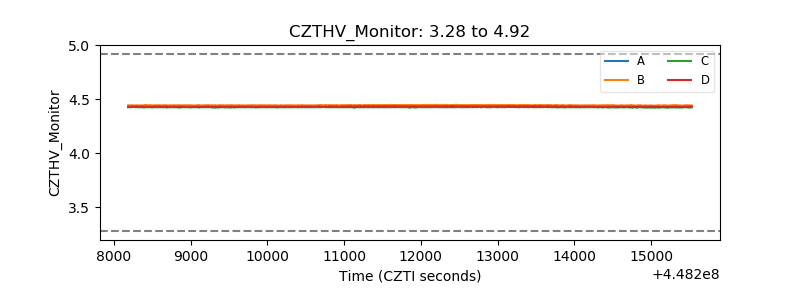 |
| D_VDD | 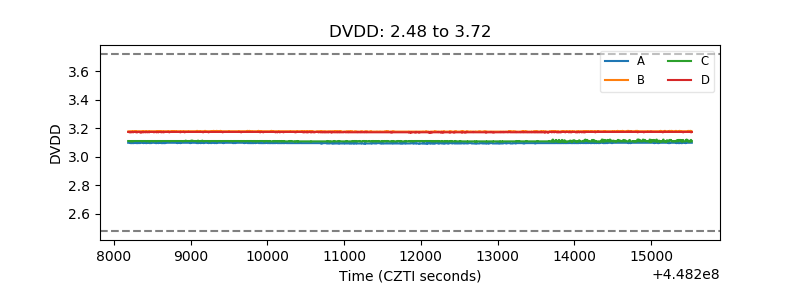 |
| Temperature 1 | 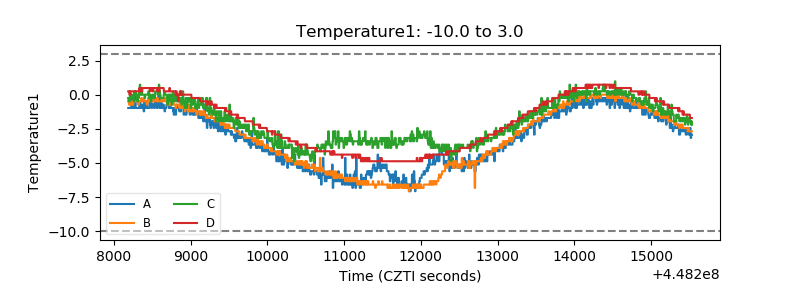 |
| Veto HV Monitor | 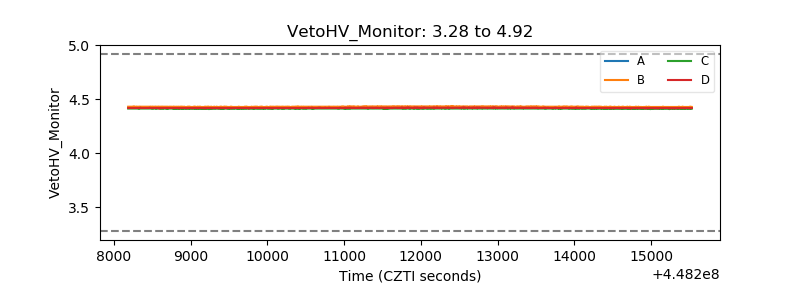 |
| Veto LLD | 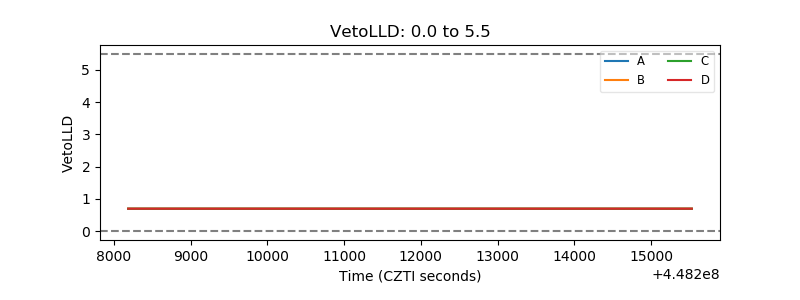 |
| Alpha Counter | 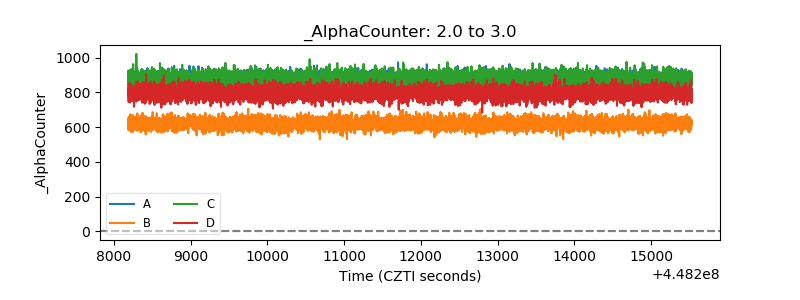 |
| _CPM_Rate | 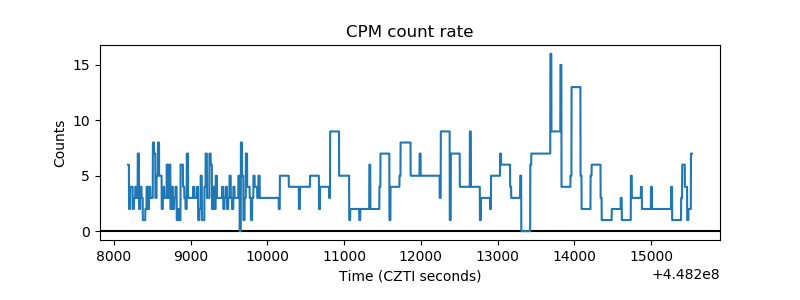 |
| CZT Counter | 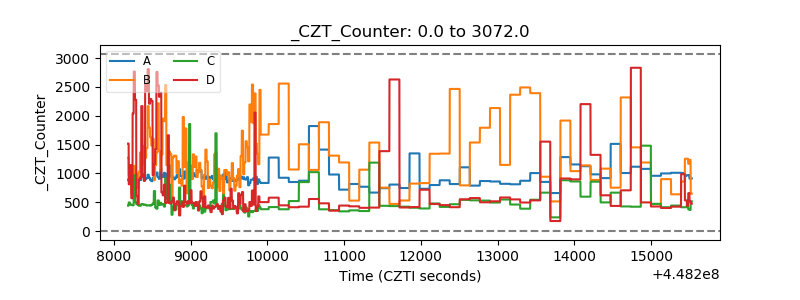 |
| +2.5 Volts monitor | 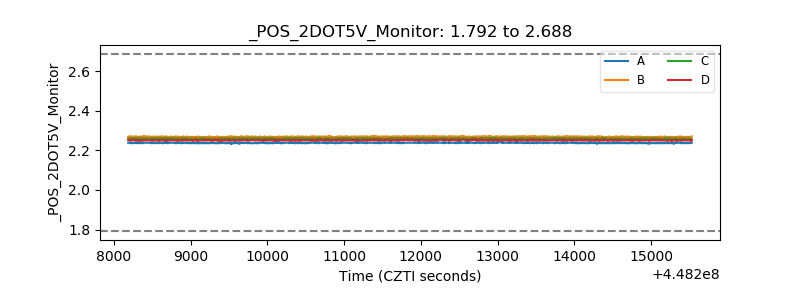 |
| +5 Volts monitor | 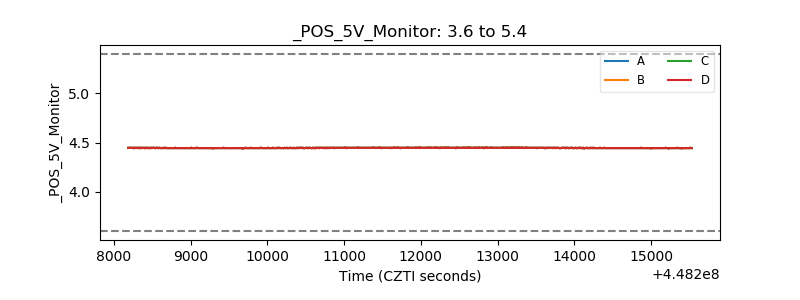 |
| _ROLL_ROT | 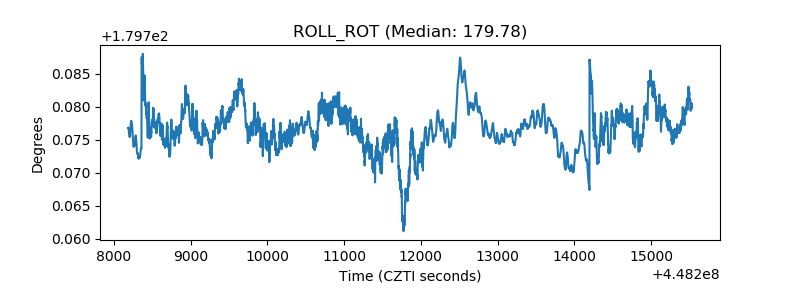 |
| _Roll_DEC | 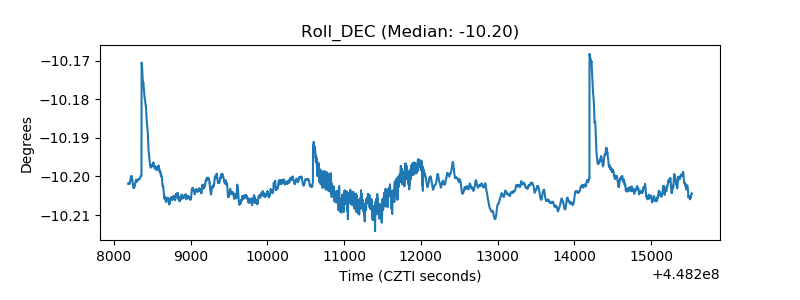 |
| _Roll_RA | 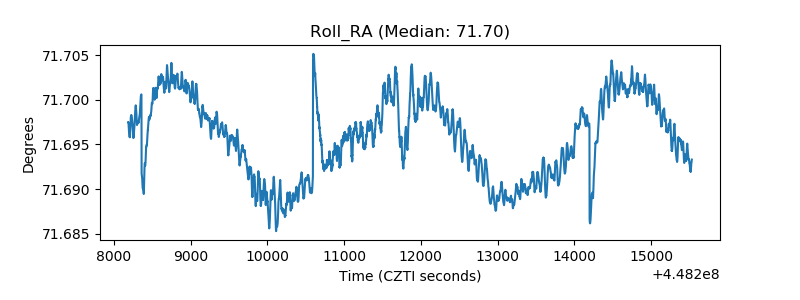 |
| Veto Counter | 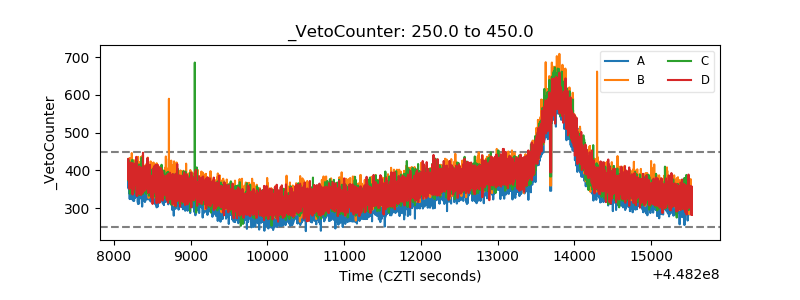 |