| Param | Original file | Final file |
|---|---|---|
| Filename | modeM0/AS1T05_183T01_9000006124_45769cztM0_level2.fits | modeM0/AS1T05_183T01_9000006124_45769cztM0_level2_quad_clean.evt |
| Size (bytes) | 721,293,120 | 122,898,240 |
| Size | 687.9 MB | 117.2 MB |
| Events in quadrant A | 7,244,480 | 833,702 |
| Events in quadrant B | 8,691,062 | 774,142 |
| Events in quadrant C | 4,396,142 | 836,623 |
| Events in quadrant D | 5,767,441 | 735,177 |
| Mode SS | |||
|---|---|---|---|
| Quadrant | BADHDUFLAG | Total packets | Discarded packets |
| A | 0 | 156 | 0 |
| B | 0 | 156 | 0 |
| C | 0 | 156 | 0 |
| D | 0 | 156 | 0 |
| Mode M0 | |||
|---|---|---|---|
| Quadrant | BADHDUFLAG | Total packets | Discarded packets |
| A | 0 | 27022 | 2 |
| B | 0 | 31367 | 0 |
| C | 0 | 18431 | 0 |
| D | 0 | 22369 | 0 |
| Quadrant | Total seconds | Saturated seconds | Saturation percentage |
|---|---|---|---|
| A | 7779 | 169 | 2.172516% |
| B | 7780 | 1056 | 13.573265% |
| C | 7780 | 97 | 1.246787% |
| D | 7780 | 455 | 5.848329% |
Noise dominated data is calculated using 1-second bins in cleaned event files. If a bin has >2000 counts, and if more than 50% of those come from <1% of pixels, then it is considered to be noise-dominated and hence unusable.
| Quadrant | # 1 sec bins | Bins with >0 counts | Bins with >2000 counts | High rate bins dominated by noise | Noise dominated (total time) | Noise dominated (detector-on time) | Marked lightcurve |
|---|---|---|---|---|---|---|---|
| A | 7779 | 7779 | 65 | 65 | 0.84% | 0.84% | 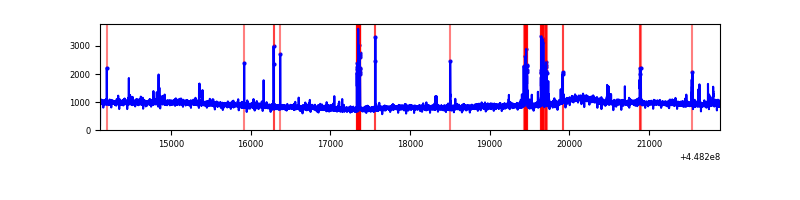 |
| B | 7780 | 7780 | 604 | 604 | 7.76% | 7.76% | 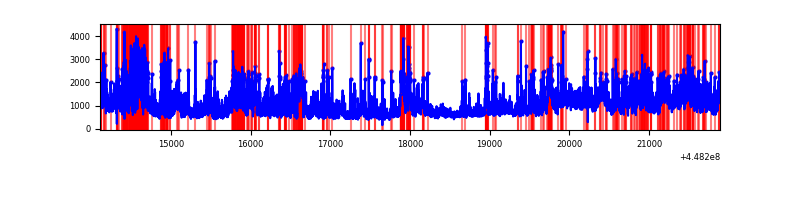 |
| C | 7780 | 7780 | 88 | 88 | 1.13% | 1.13% | 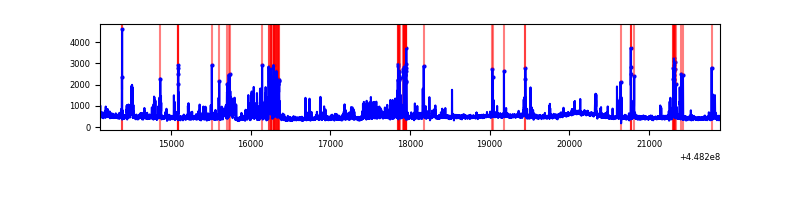 |
| D | 7780 | 7780 | 416 | 416 | 5.35% | 5.35% | 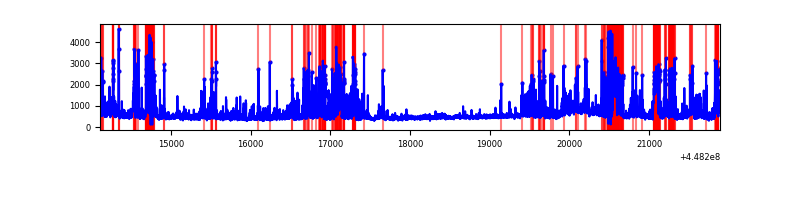 |
Top three noisy pixels from each quadrant. If the there are fewer than three noisy pixels in the level2.evt file, extra rows are filled as -1
| Pixel properties | Quadrant properties | ||||||
|---|---|---|---|---|---|---|---|
| Quadrant | DetID | PixID | Counts | Sigma | Mean | Median | Sigma |
| A | 10 | 83 | 3512886 | 18971.72 | 883 | 865 | 185.1 |
| A | 13 | 248 | 210287 | 1131.28 | 883 | 865 | 185.1 |
| A | 13 | 6 | 23284 | 121.11 | 883 | 865 | 185.1 |
| B | 3 | 112 | 2709082 | 16237.16 | 843 | 819 | 166.8 |
| B | 0 | 171 | 1042638 | 6246.14 | 843 | 819 | 166.8 |
| B | 12 | 18 | 698251 | 4181.39 | 843 | 819 | 166.8 |
| C | 2 | 14 | 311457 | 1512.57 | 867 | 876 | 205.3 |
| C | 14 | 220 | 200251 | 970.98 | 867 | 876 | 205.3 |
| C | 14 | 254 | 179709 | 870.94 | 867 | 876 | 205.3 |
| D | 2 | 249 | 610168 | 2824.83 | 851 | 824 | 215.7 |
| D | 8 | 48 | 420089 | 1943.65 | 851 | 824 | 215.7 |
| D | 11 | 176 | 403153 | 1865.14 | 851 | 824 | 215.7 |
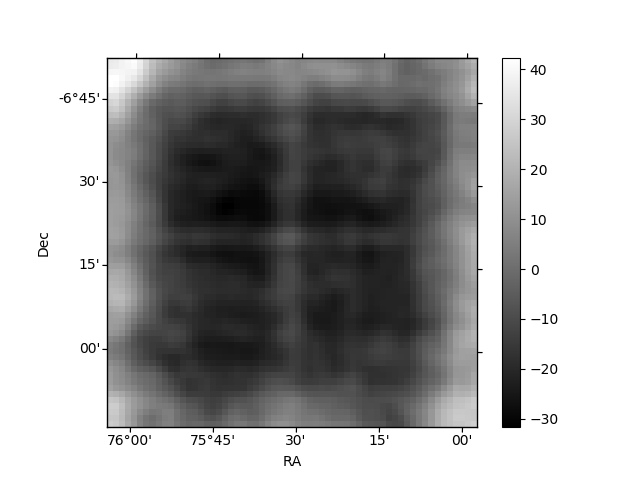
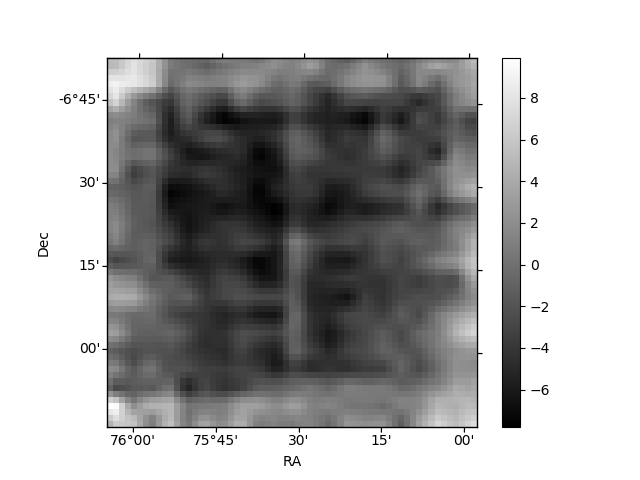
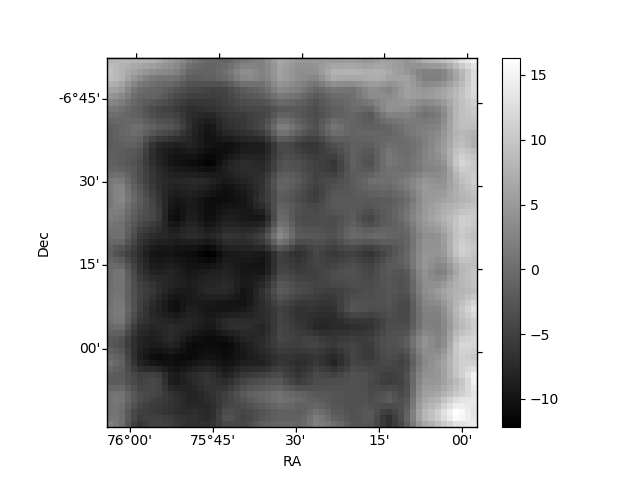
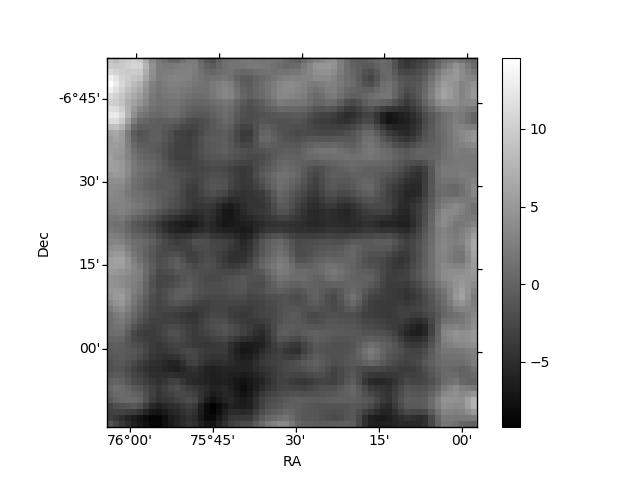
Histogram calculated using DETX and DETY for each event in the final _common_clean file
| Quadrant A | 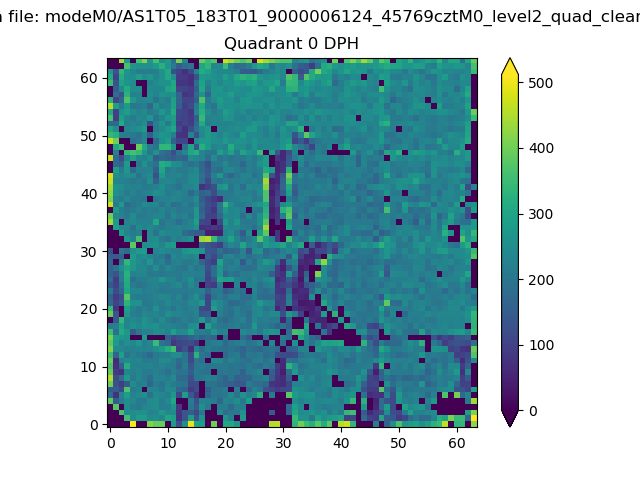 |
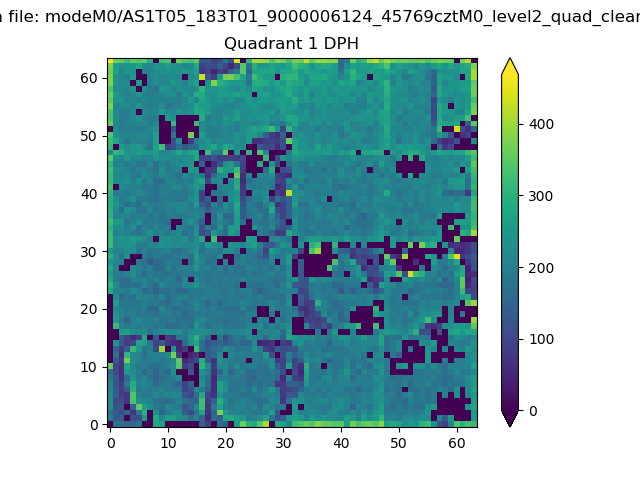 |
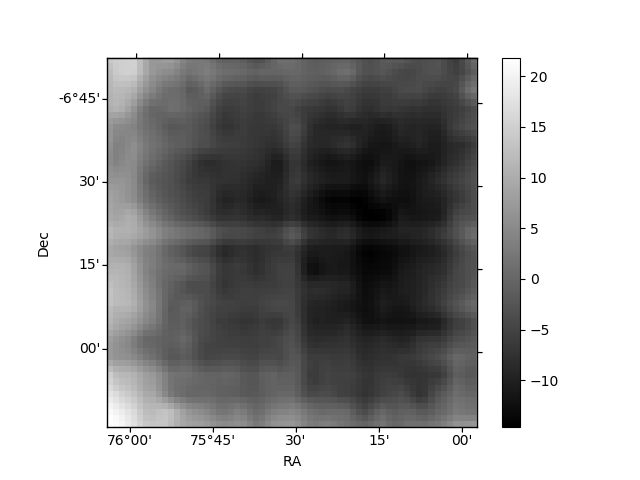
Quadrant B |
|---|---|---|---|
| Quadrant D | 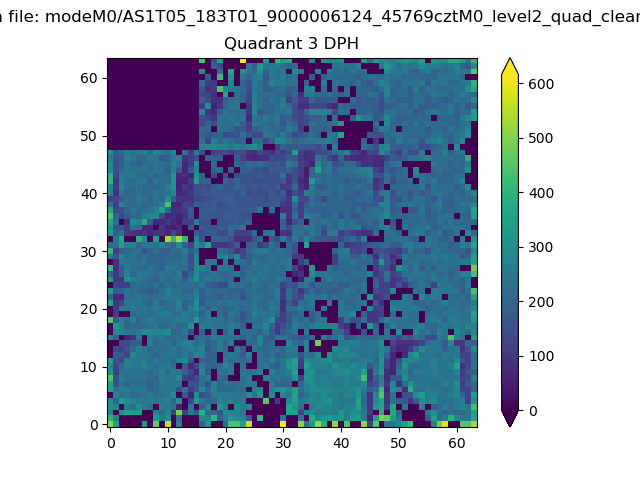 |
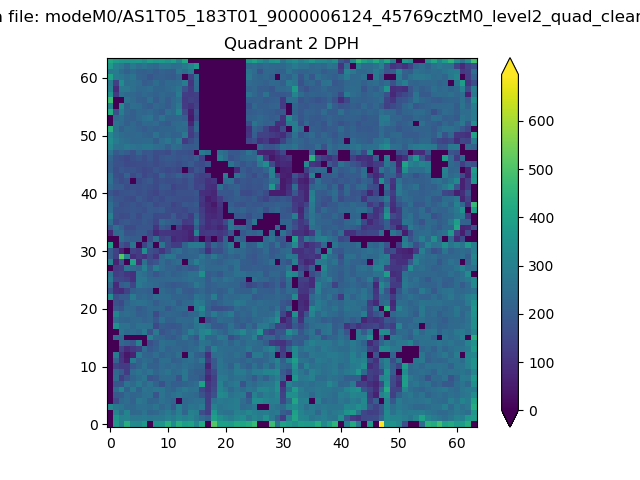 |
Quadrant C |
| Plot type | Count rate plots | Images |
|---|---|---|
| Comparison with Poisson distribution Blue bars denote a histogram of data divided into 1 sec bins. Red curve is a Poisson curve with rate = median count rate of data. |
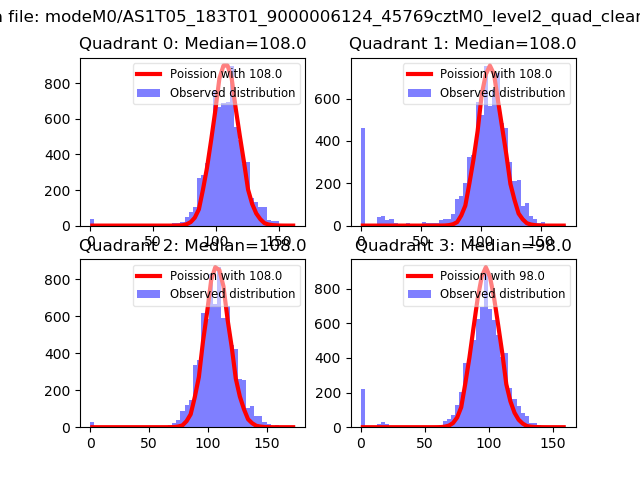 |
 |
| Quadrant-wise count rates Data is divided into 100 sec bins |
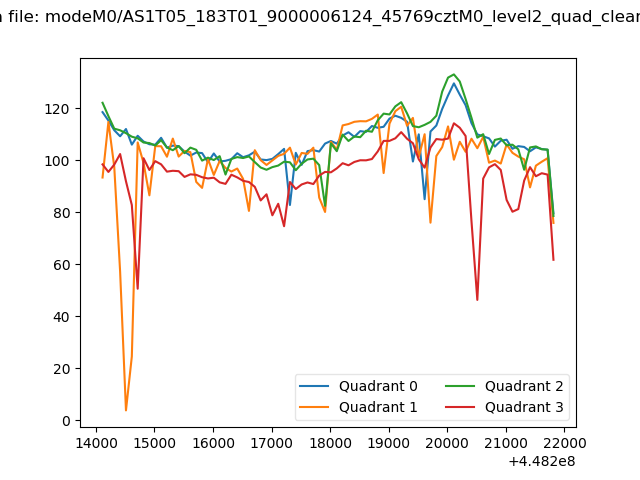 |
|
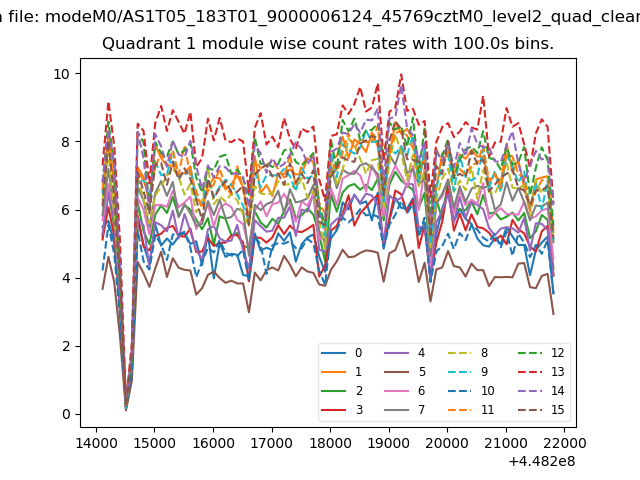
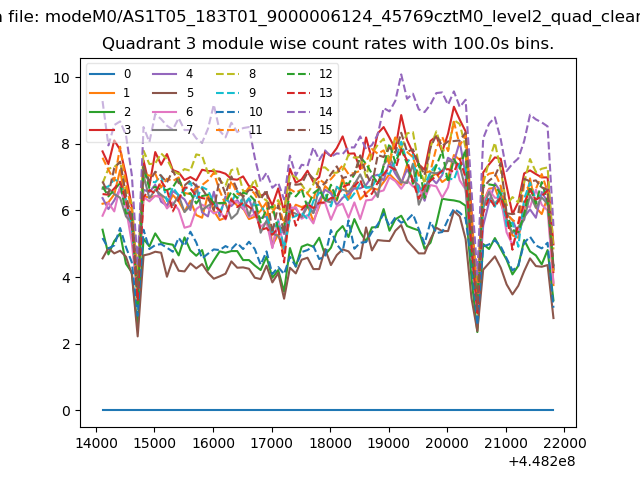
| Module-wise count rates for Quadrant A Data is divided into 100 sec bins |
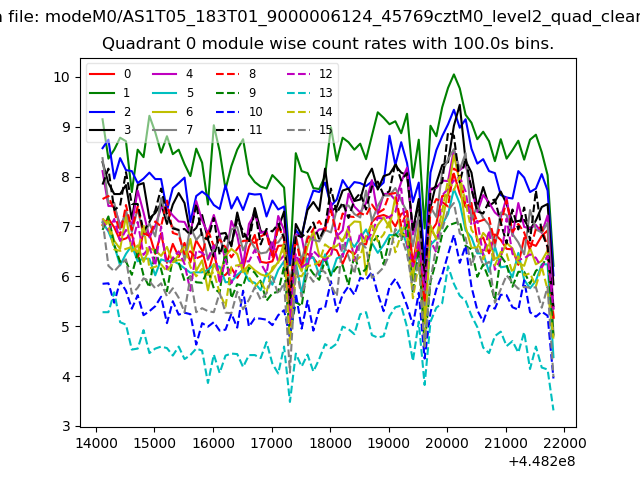 |
 |
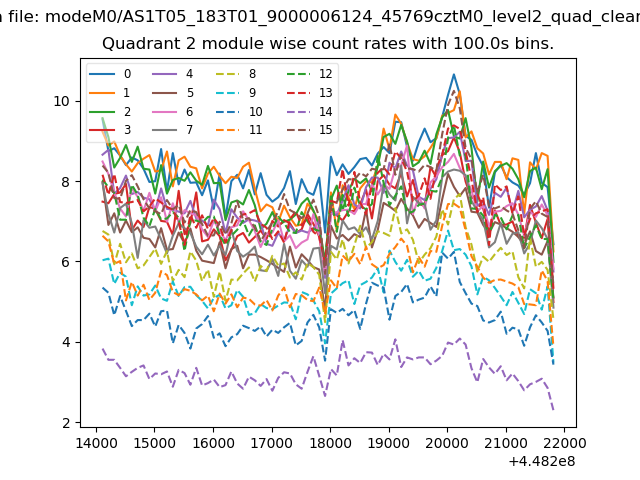
| Module-wise count rates for Quadrant B Data is divided into 100 sec bins |
 |
 |
| Module-wise count rates for Quadrant C Data is divided into 100 sec bins |
 |
 |
| Module-wise count rates for Quadrant D Data is divided into 100 sec bins |
 |
 |
| Parameter | Plot |
|---|---|
| CZT HV Monitor | 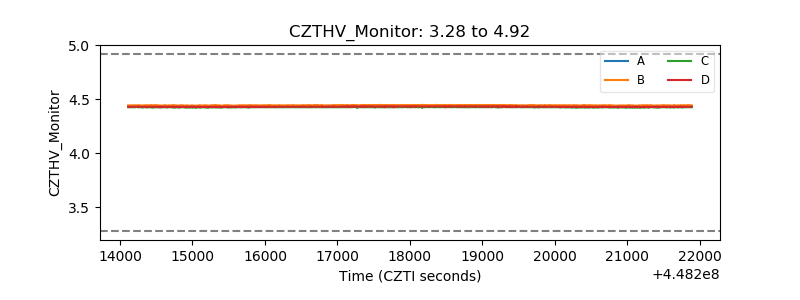 |
| D_VDD | 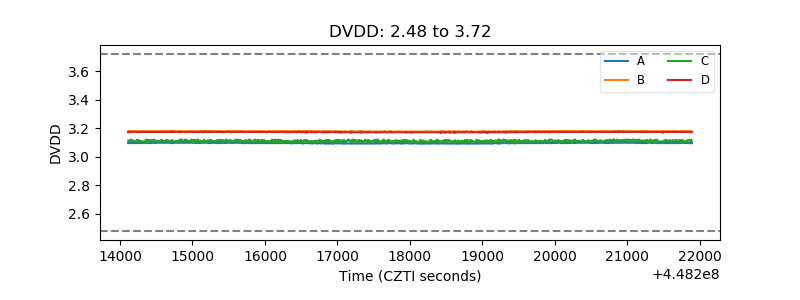 |
| Temperature 1 | 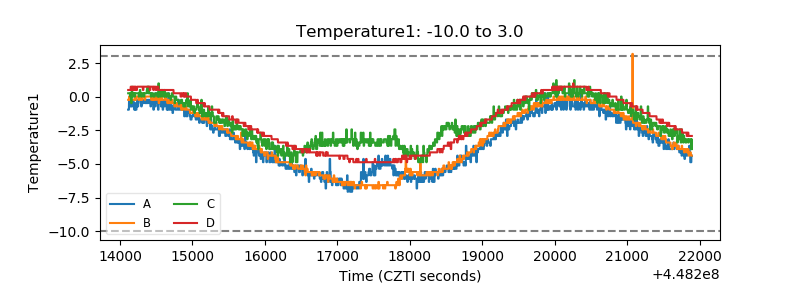 |
| Veto HV Monitor | 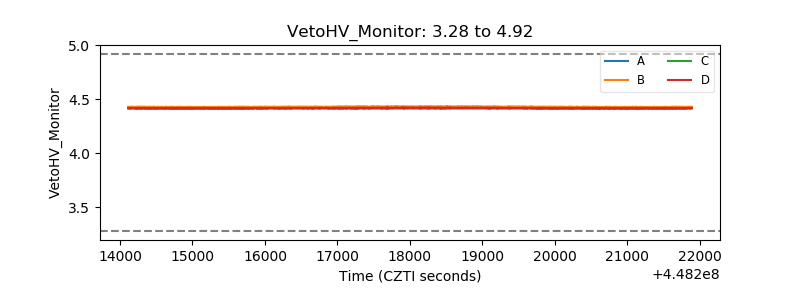 |
| Veto LLD | 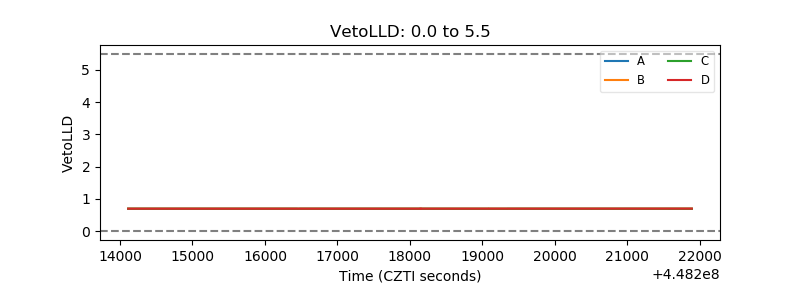 |
| Alpha Counter | 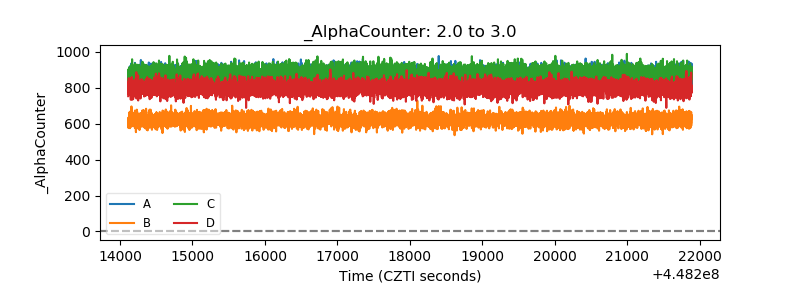 |
| _CPM_Rate | 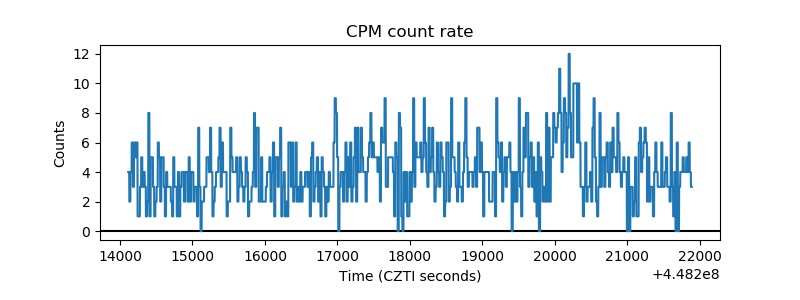 |
| CZT Counter | 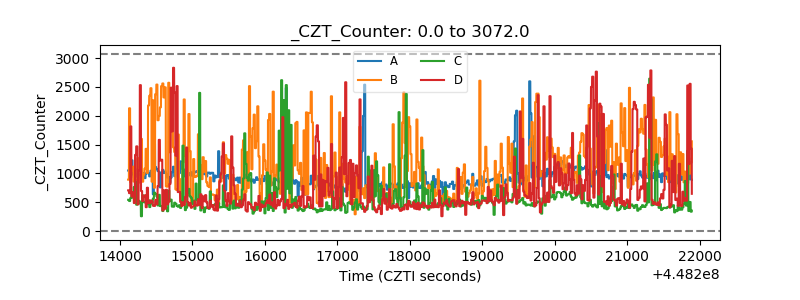 |
| +2.5 Volts monitor | 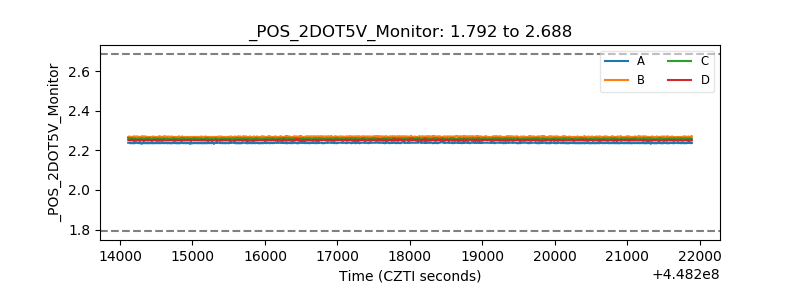 |
| +5 Volts monitor | 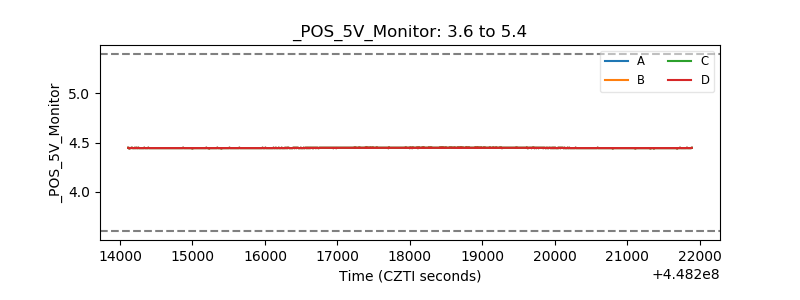 |
| _ROLL_ROT | 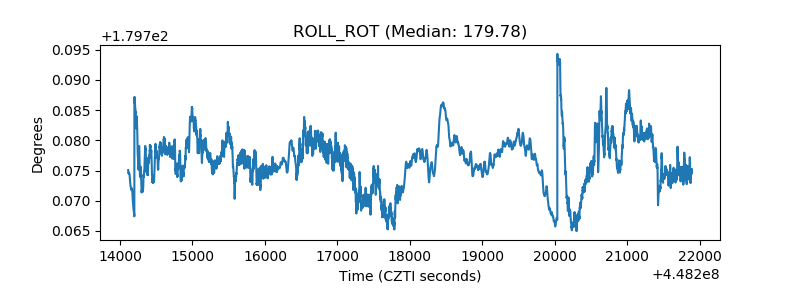 |
| _Roll_DEC | 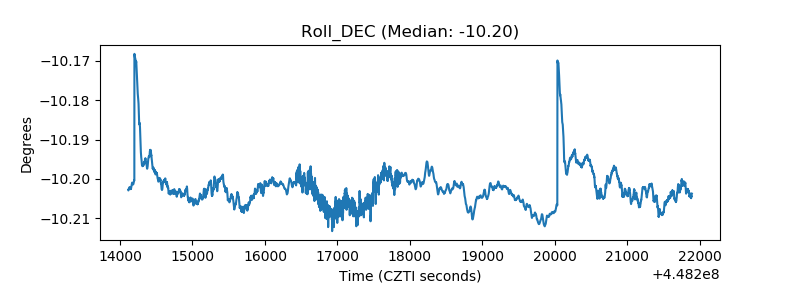 |
| _Roll_RA | 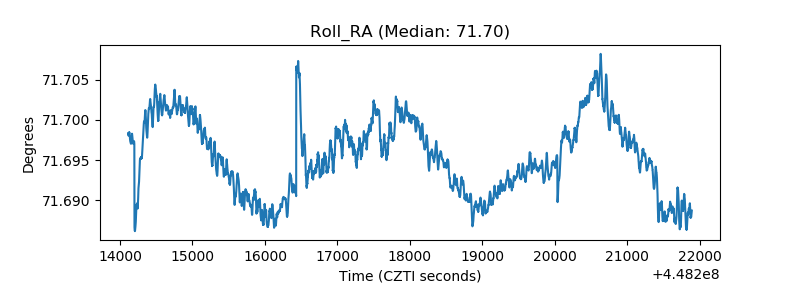 |
| Veto Counter | 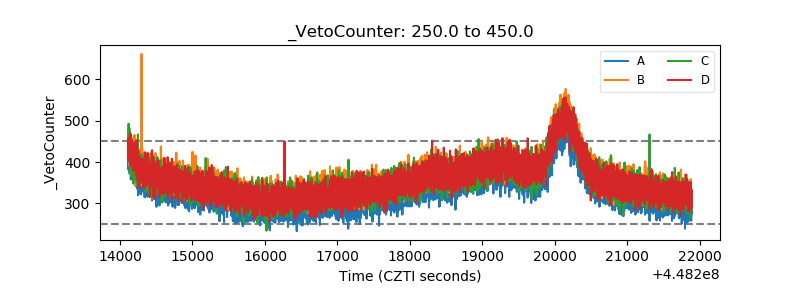 |