| Param | Original file | Final file |
|---|---|---|
| Filename | modeM0/AS1T05_183T01_9000006124_45772cztM0_level2.fits | modeM0/AS1T05_183T01_9000006124_45772cztM0_level2_quad_clean.evt |
| Size (bytes) | 573,932,160 | 96,459,840 |
| Size | 547.3 MB | 92.0 MB |
| Events in quadrant A | 5,694,731 | 657,443 |
| Events in quadrant B | 7,927,087 | 559,681 |
| Events in quadrant C | 3,074,853 | 666,061 |
| Events in quadrant D | 4,066,384 | 602,897 |
| Mode SS | |||
|---|---|---|---|
| Quadrant | BADHDUFLAG | Total packets | Discarded packets |
| A | 0 | 124 | 0 |
| B | 0 | 124 | 0 |
| C | 0 | 124 | 0 |
| D | 0 | 124 | 0 |
| Mode M0 | |||
|---|---|---|---|
| Quadrant | BADHDUFLAG | Total packets | Discarded packets |
| A | 0 | 21101 | 0 |
| B | 0 | 27945 | 0 |
| C | 0 | 13596 | 0 |
| D | 0 | 16386 | 0 |
| Quadrant | Total seconds | Saturated seconds | Saturation percentage |
|---|---|---|---|
| A | 6221 | 198 | 3.182768% |
| B | 6222 | 1497 | 24.059788% |
| C | 6222 | 41 | 0.658952% |
| D | 6222 | 129 | 2.073288% |
Noise dominated data is calculated using 1-second bins in cleaned event files. If a bin has >2000 counts, and if more than 50% of those come from <1% of pixels, then it is considered to be noise-dominated and hence unusable.
| Quadrant | # 1 sec bins | Bins with >0 counts | Bins with >2000 counts | High rate bins dominated by noise | Noise dominated (total time) | Noise dominated (detector-on time) | Marked lightcurve |
|---|---|---|---|---|---|---|---|
| A | 6221 | 6221 | 21 | 21 | 0.34% | 0.34% | 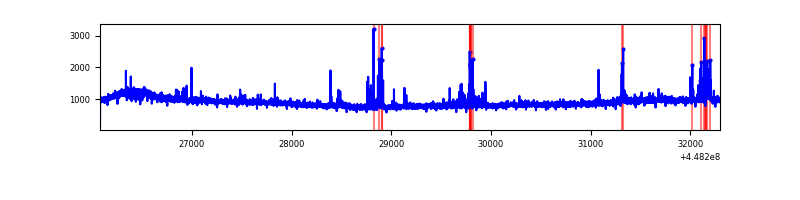 |
| B | 6222 | 6222 | 770 | 770 | 12.38% | 12.38% | 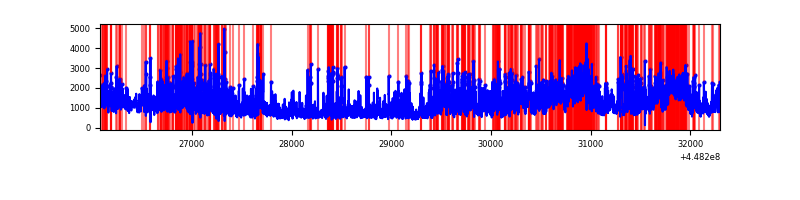 |
| C | 6222 | 6222 | 33 | 33 | 0.53% | 0.53% | 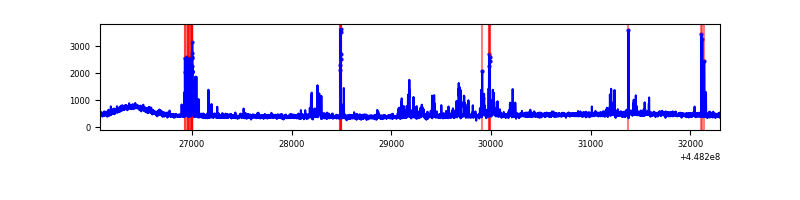 |
| D | 6222 | 6222 | 112 | 112 | 1.80% | 1.80% | 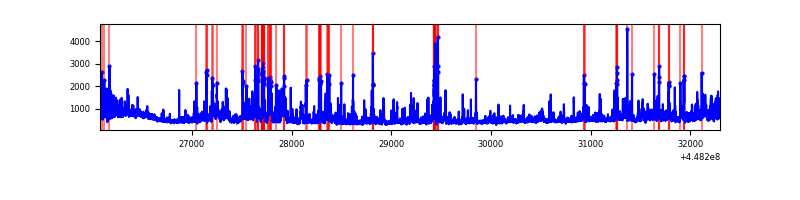 |
Top three noisy pixels from each quadrant. If the there are fewer than three noisy pixels in the level2.evt file, extra rows are filled as -1
| Pixel properties | Quadrant properties | ||||||
|---|---|---|---|---|---|---|---|
| Quadrant | DetID | PixID | Counts | Sigma | Mean | Median | Sigma |
| A | 10 | 83 | 2705704 | 17978.76 | 714 | 699 | 150.5 |
| A | 13 | 248 | 171267 | 1133.68 | 714 | 699 | 150.5 |
| A | 0 | 243 | 18784 | 120.2 | 714 | 699 | 150.5 |
| B | 3 | 112 | 3824808 | 29133.18 | 664 | 644 | 131.3 |
| B | 4 | 171 | 335101 | 2547.95 | 664 | 644 | 131.3 |
| B | 5 | 172 | 212686 | 1615.37 | 664 | 644 | 131.3 |
| C | 14 | 254 | 165471 | 984.37 | 703 | 708 | 167.4 |
| C | 14 | 96 | 99231 | 588.62 | 703 | 708 | 167.4 |
| C | 1 | 3 | 53134 | 313.22 | 703 | 708 | 167.4 |
| D | 13 | 249 | 291485 | 1659.9 | 699 | 677 | 175.2 |
| D | 1 | 52 | 285853 | 1627.75 | 699 | 677 | 175.2 |
| D | 8 | 48 | 205731 | 1170.42 | 699 | 677 | 175.2 |
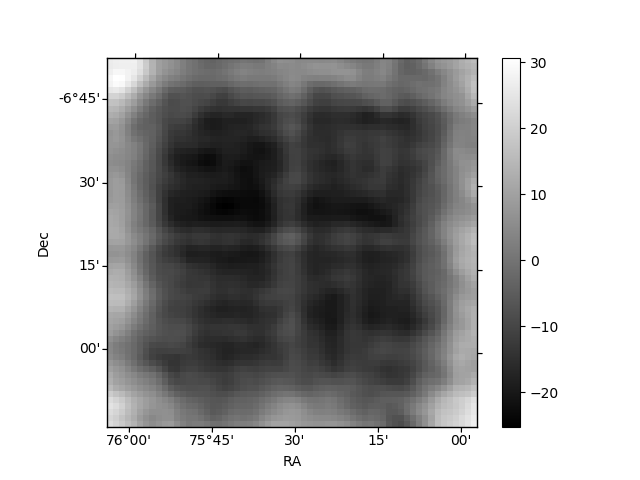
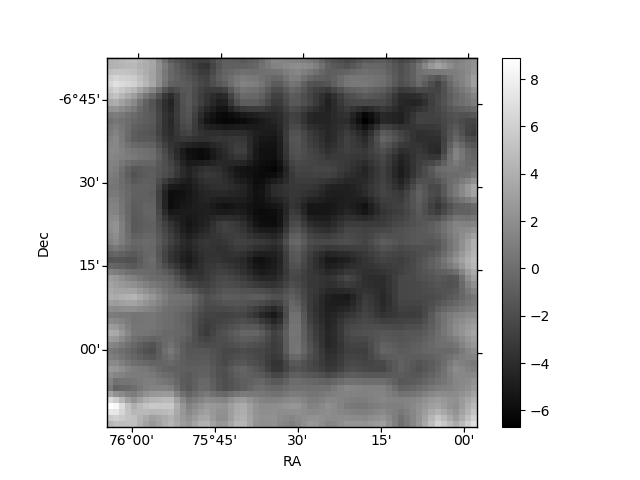
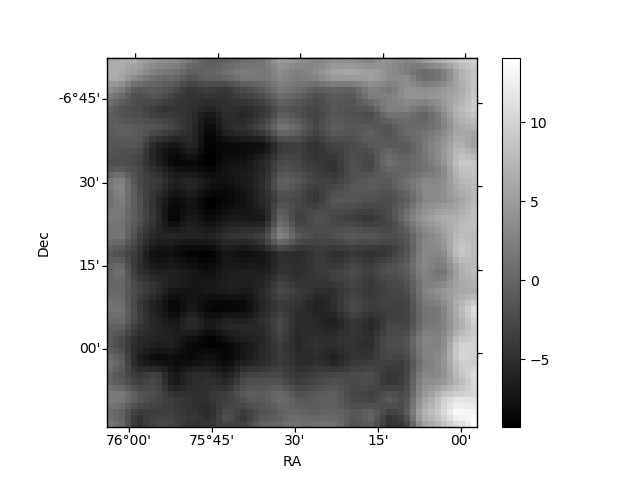
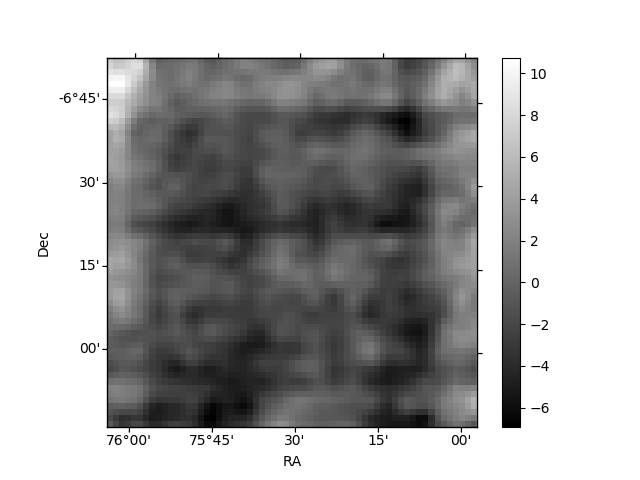
Histogram calculated using DETX and DETY for each event in the final _common_clean file
| Quadrant A | 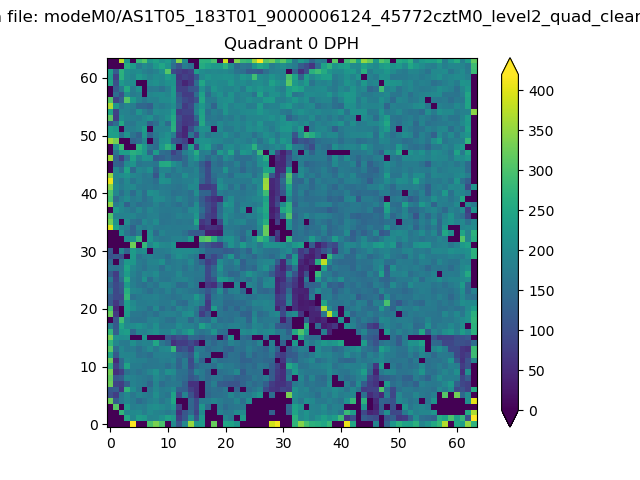 |
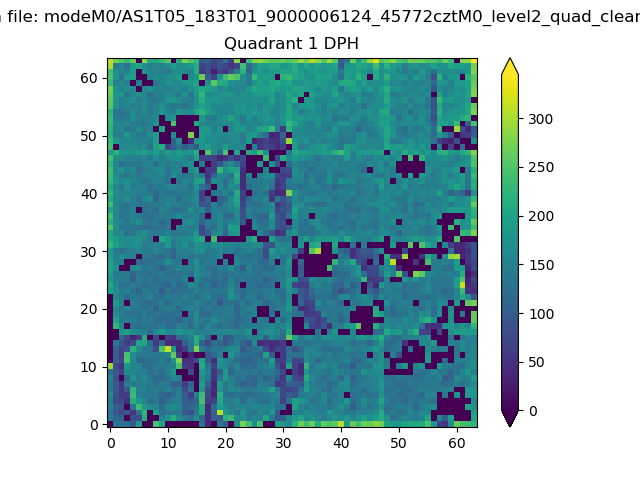 |
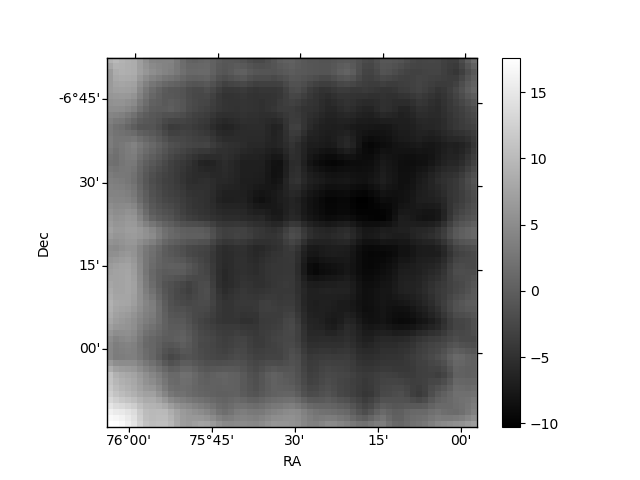
Quadrant B |
|---|---|---|---|
| Quadrant D | 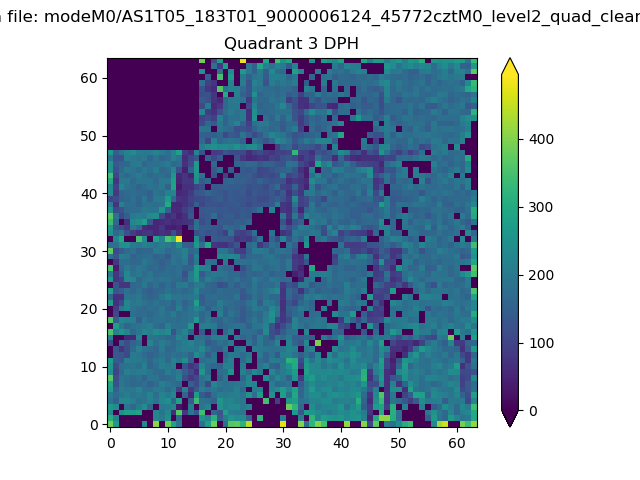 |
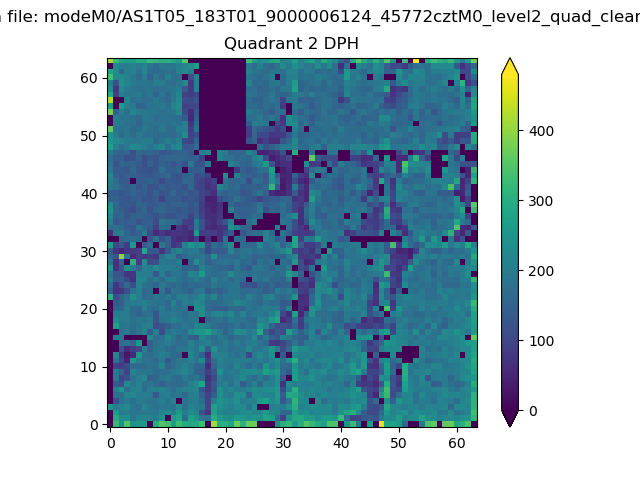 |
Quadrant C |
| Plot type | Count rate plots | Images |
|---|---|---|
| Comparison with Poisson distribution Blue bars denote a histogram of data divided into 1 sec bins. Red curve is a Poisson curve with rate = median count rate of data. |
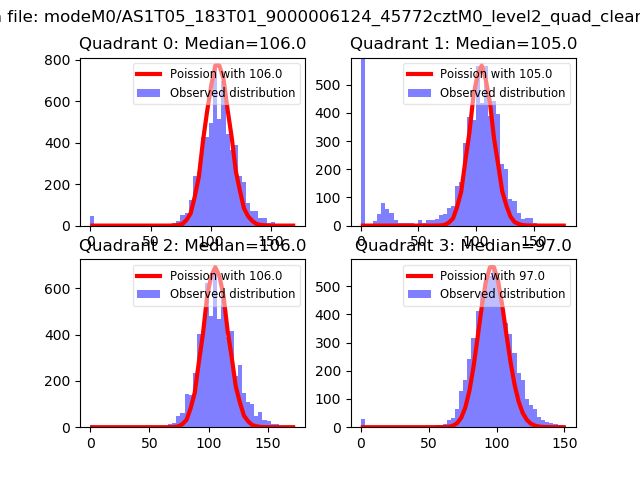 |
 |
| Quadrant-wise count rates Data is divided into 100 sec bins |
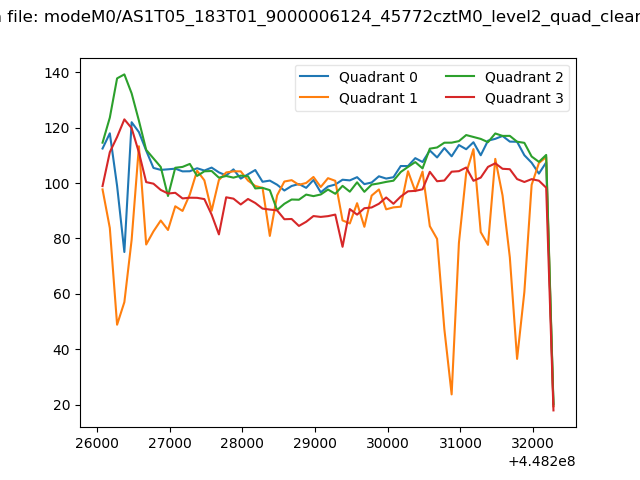 |
|
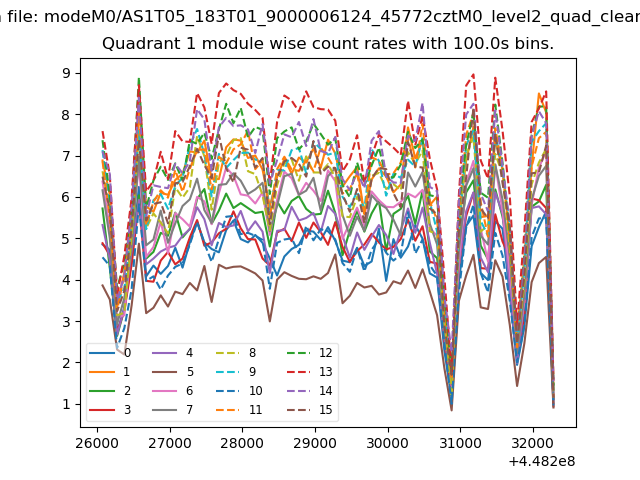
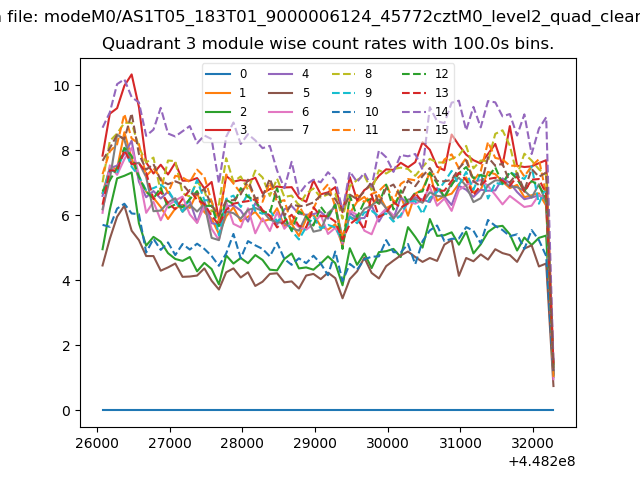
| Module-wise count rates for Quadrant A Data is divided into 100 sec bins |
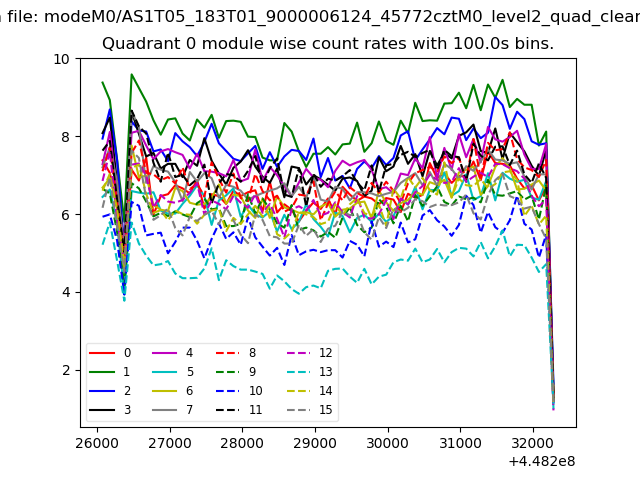 |
 |
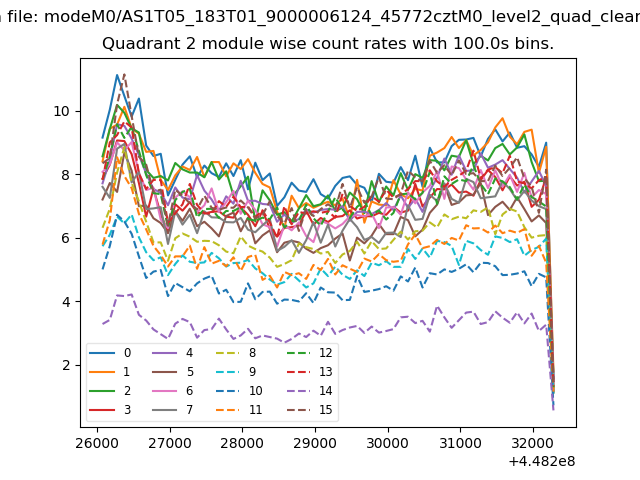
| Module-wise count rates for Quadrant B Data is divided into 100 sec bins |
 |
 |
| Module-wise count rates for Quadrant C Data is divided into 100 sec bins |
 |
 |
| Module-wise count rates for Quadrant D Data is divided into 100 sec bins |
 |
 |
| Parameter | Plot |
|---|---|
| CZT HV Monitor | 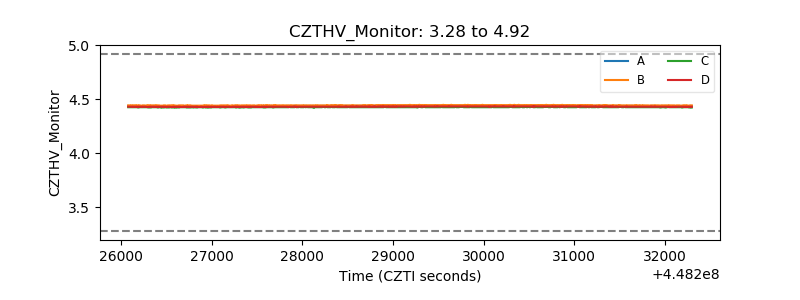 |
| D_VDD | 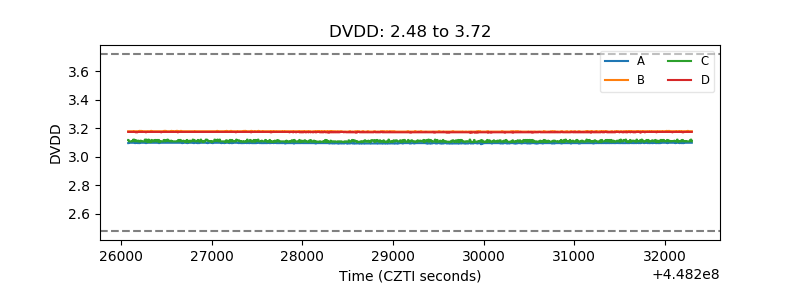 |
| Temperature 1 | 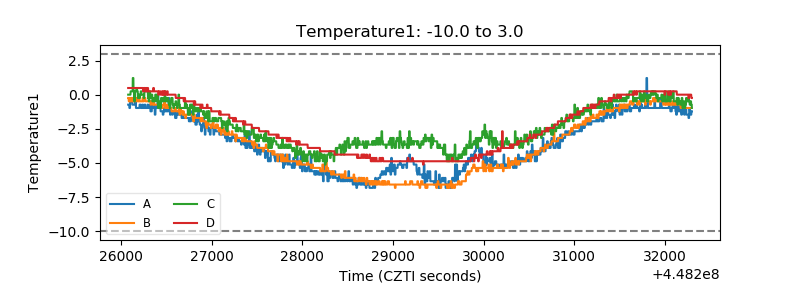 |
| Veto HV Monitor | 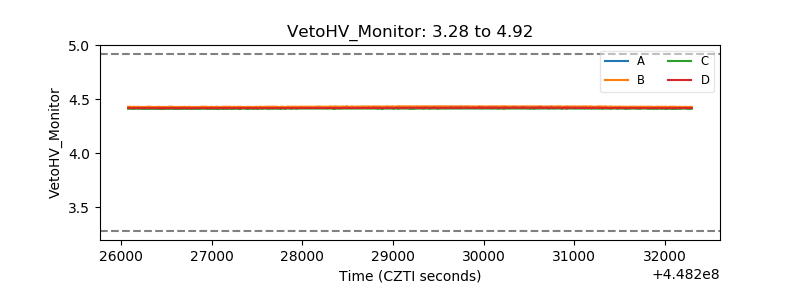 |
| Veto LLD | 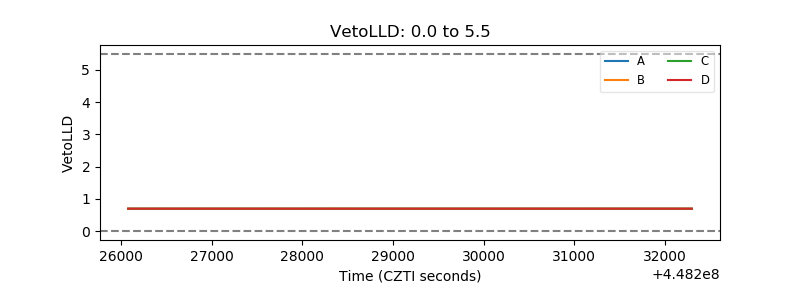 |
| Alpha Counter | 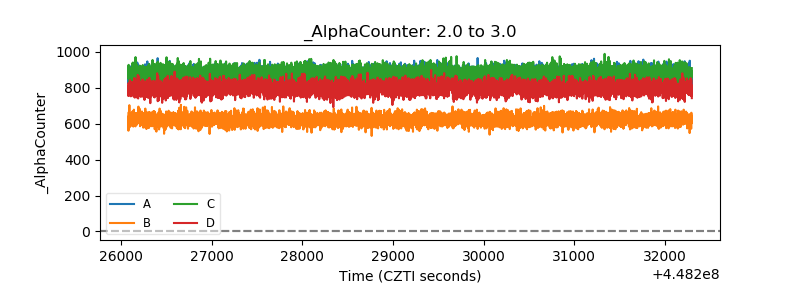 |
| _CPM_Rate | 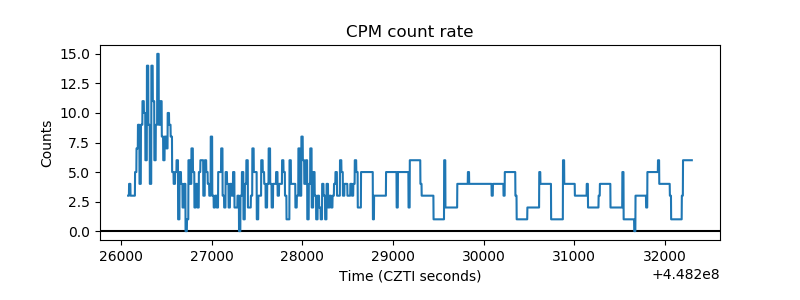 |
| CZT Counter | 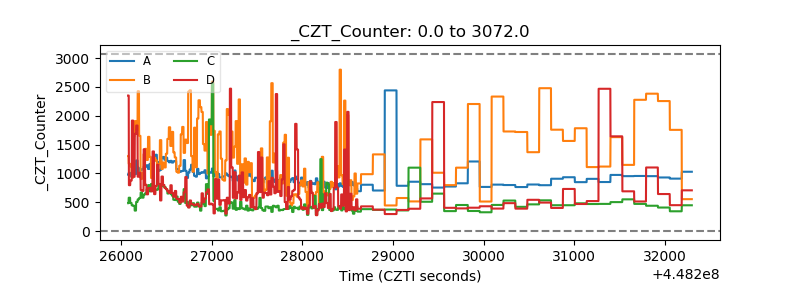 |
| +2.5 Volts monitor | 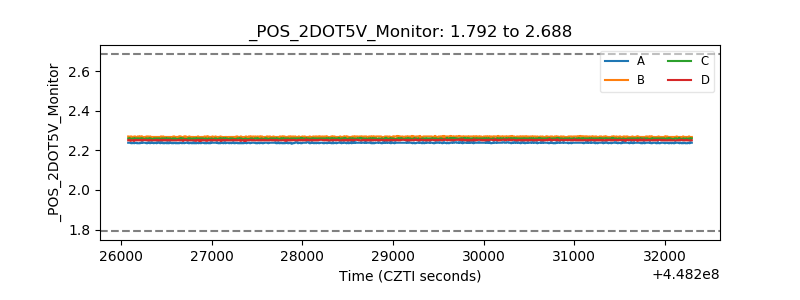 |
| +5 Volts monitor | 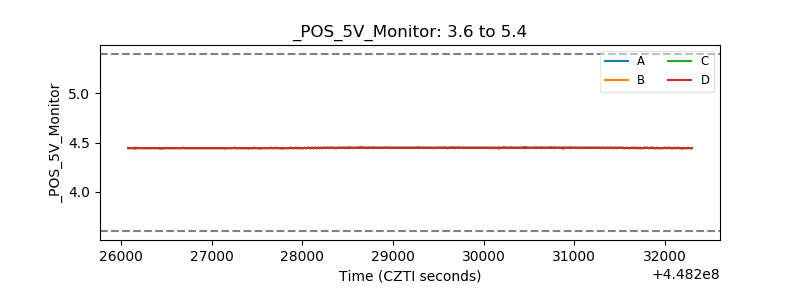 |
| _ROLL_ROT | 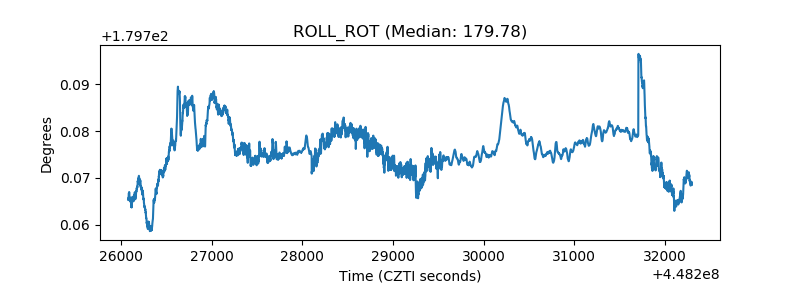 |
| _Roll_DEC | 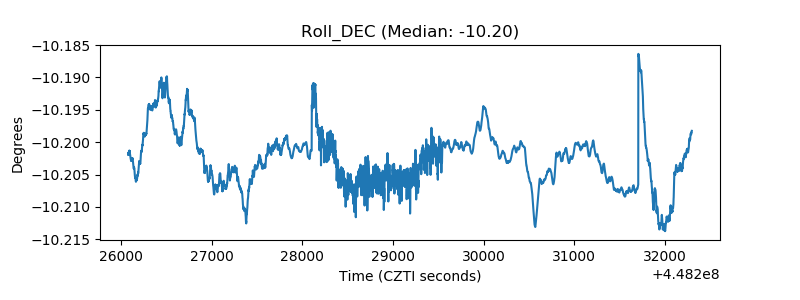 |
| _Roll_RA | 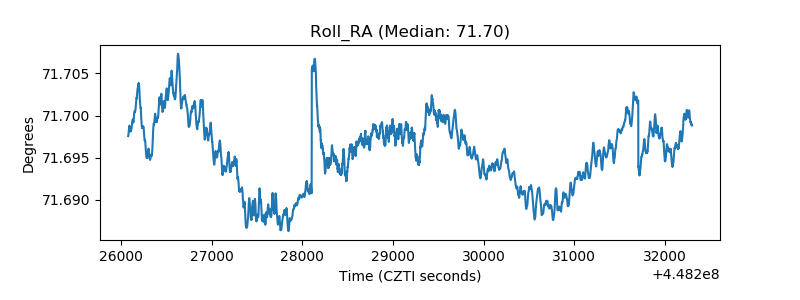 |
| Veto Counter | 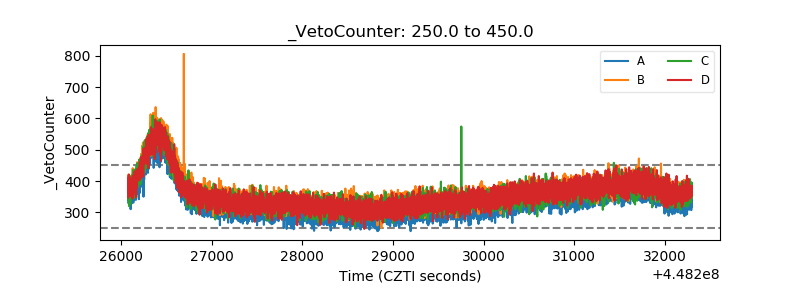 |