| Param | Original file | Final file |
|---|---|---|
| Filename | modeM0/AS1T05_183T01_9000006124_45773cztM0_level2.fits | modeM0/AS1T05_183T01_9000006124_45773cztM0_level2_quad_clean.evt |
| Size (bytes) | 1,147,567,680 | 202,524,480 |
| Size | 1.1 GB | 193.1 MB |
| Events in quadrant A | 11,793,942 | 1,356,216 |
| Events in quadrant B | 14,335,265 | 1,269,420 |
| Events in quadrant C | 6,052,913 | 1,386,838 |
| Events in quadrant D | 9,279,486 | 1,207,809 |
| Mode SS | |||
|---|---|---|---|
| Quadrant | BADHDUFLAG | Total packets | Discarded packets |
| A | 0 | 270 | 0 |
| B | 0 | 270 | 0 |
| C | 0 | 270 | 0 |
| D | 0 | 270 | 0 |
| Mode M0 | |||
|---|---|---|---|
| Quadrant | BADHDUFLAG | Total packets | Discarded packets |
| A | 0 | 44054 | 3 |
| B | 0 | 51993 | 3 |
| C | 0 | 27510 | 3 |
| D | 0 | 36742 | 4 |
| Mode M9 | |||
|---|---|---|---|
| Quadrant | BADHDUFLAG | Total packets | Discarded packets |
| A | 0 | 17 | 0 |
| B | 0 | 17 | 0 |
| C | 0 | 17 | 0 |
| D | 0 | 17 | 0 |
| Quadrant | Total seconds | Saturated seconds | Saturation percentage |
|---|---|---|---|
| A | 13184 | 436 | 3.307039% |
| B | 13185 | 1713 | 12.992036% |
| C | 13185 | 81 | 0.614334% |
| D | 13184 | 776 | 5.885922% |
Noise dominated data is calculated using 1-second bins in cleaned event files. If a bin has >2000 counts, and if more than 50% of those come from <1% of pixels, then it is considered to be noise-dominated and hence unusable.
| Quadrant | # 1 sec bins | Bins with >0 counts | Bins with >2000 counts | High rate bins dominated by noise | Noise dominated (total time) | Noise dominated (detector-on time) | Marked lightcurve |
|---|---|---|---|---|---|---|---|
| A | 14889 | 13187 | 87 | 87 | 0.58% | 0.66% | 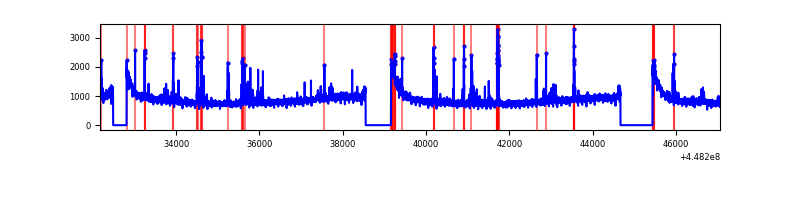 |
| B | 14890 | 13188 | 959 | 959 | 6.44% | 7.27% | 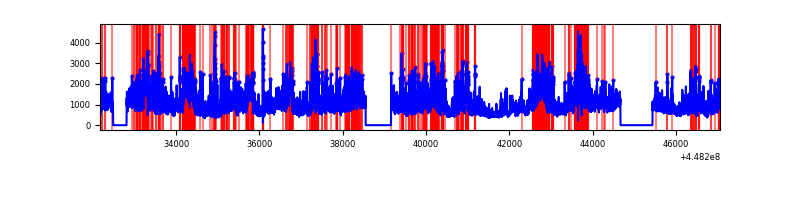 |
| C | 14890 | 13188 | 5 | 5 | 0.03% | 0.04% | 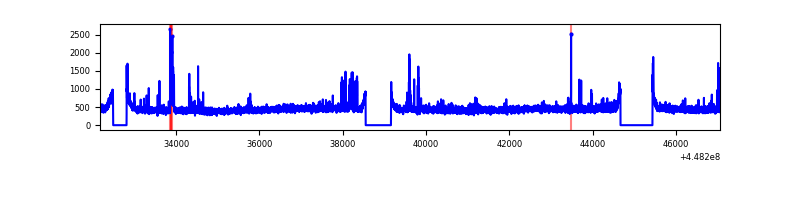 |
| D | 14889 | 13187 | 549 | 549 | 3.69% | 4.16% | 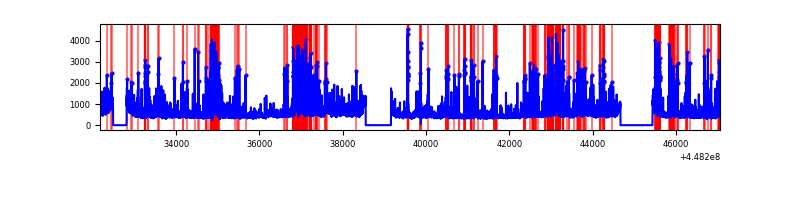 |
Top three noisy pixels from each quadrant. If the there are fewer than three noisy pixels in the level2.evt file, extra rows are filled as -1
| Pixel properties | Quadrant properties | ||||||
|---|---|---|---|---|---|---|---|
| Quadrant | DetID | PixID | Counts | Sigma | Mean | Median | Sigma |
| A | 10 | 83 | 5625852 | 18269.66 | 1476 | 1443 | 307.9 |
| A | 13 | 248 | 362586 | 1173.09 | 1476 | 1443 | 307.9 |
| A | 2 | 79 | 23999 | 73.27 | 1476 | 1443 | 307.9 |
| B | 3 | 112 | 6366109 | 22520.01 | 1438 | 1394 | 282.6 |
| B | 15 | 201 | 446590 | 1575.22 | 1438 | 1394 | 282.6 |
| B | 0 | 171 | 387857 | 1367.4 | 1438 | 1394 | 282.6 |
| C | 2 | 14 | 105604 | 300.79 | 1472 | 1486 | 346.2 |
| C | 1 | 3 | 95717 | 272.22 | 1472 | 1486 | 346.2 |
| C | 9 | 54 | 53043 | 148.94 | 1472 | 1486 | 346.2 |
| D | 2 | 249 | 1685702 | 4691.85 | 1434 | 1394 | 359.0 |
| D | 13 | 249 | 728486 | 2025.4 | 1434 | 1394 | 359.0 |
| D | 1 | 52 | 706169 | 1963.24 | 1434 | 1394 | 359.0 |
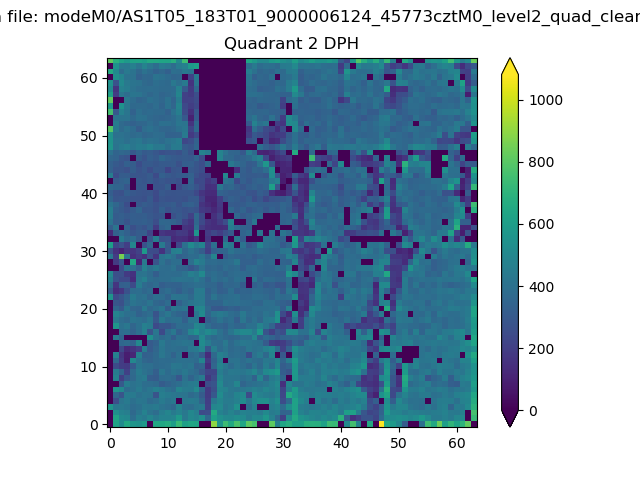
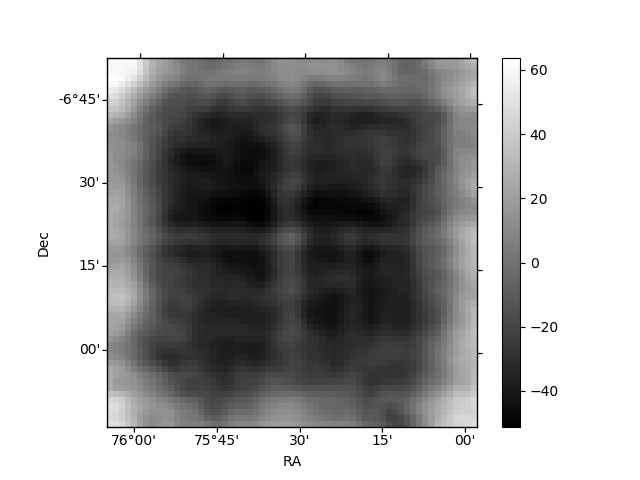
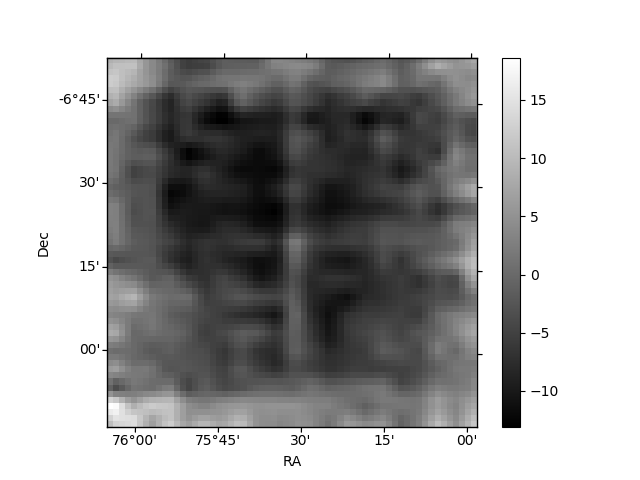
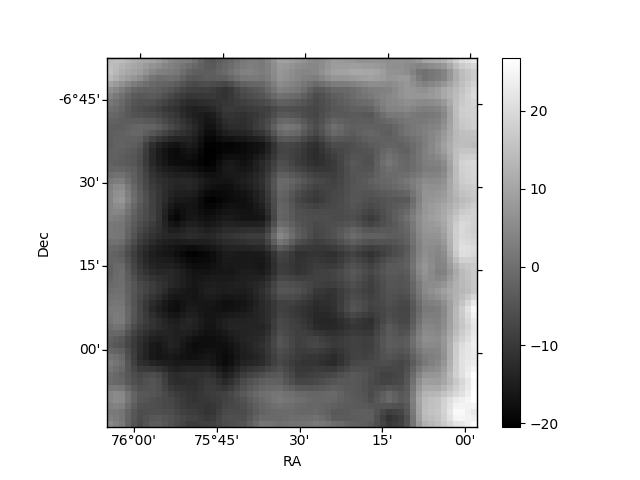
Histogram calculated using DETX and DETY for each event in the final _common_clean file
| Quadrant A | 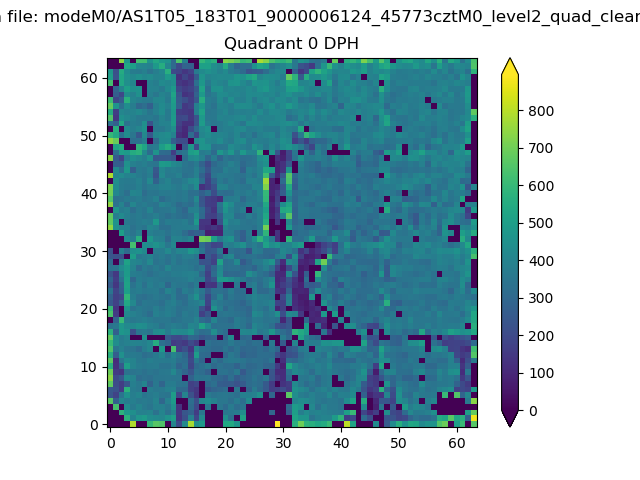 |
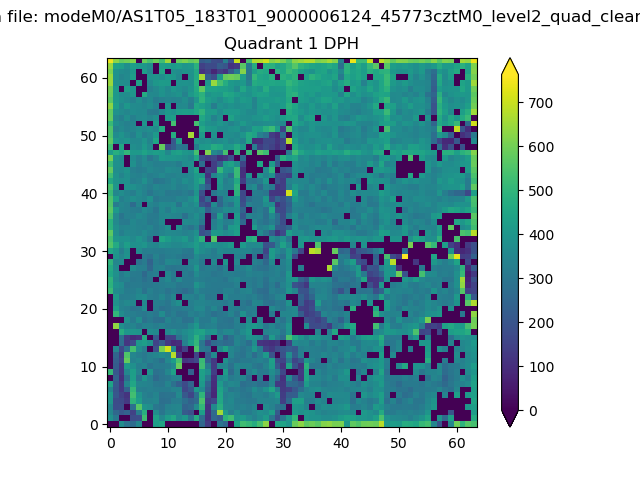 |
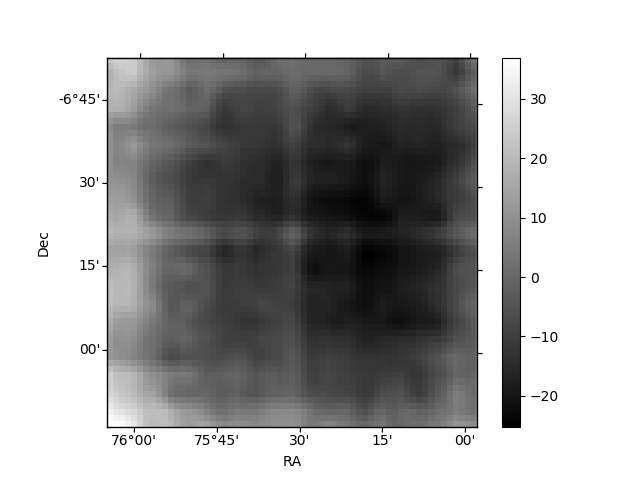
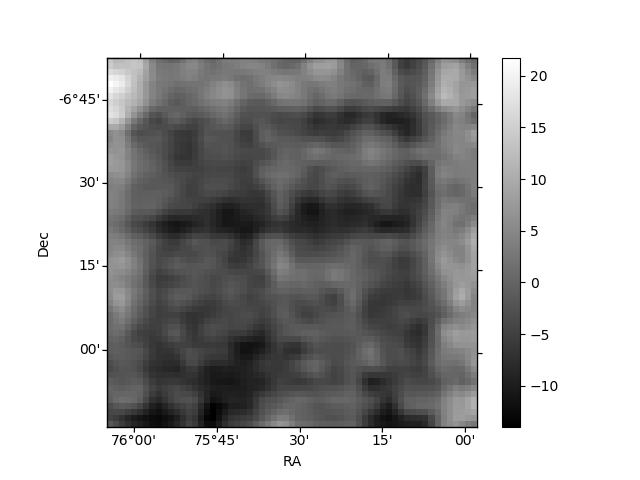
Quadrant B |
|---|---|---|---|
| Quadrant D | 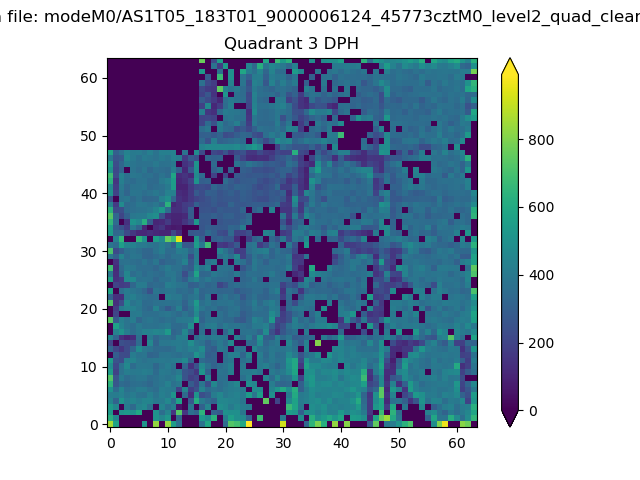 |
 |
Quadrant C |
| Plot type | Count rate plots | Images |
|---|---|---|
| Comparison with Poisson distribution Blue bars denote a histogram of data divided into 1 sec bins. Red curve is a Poisson curve with rate = median count rate of data. |
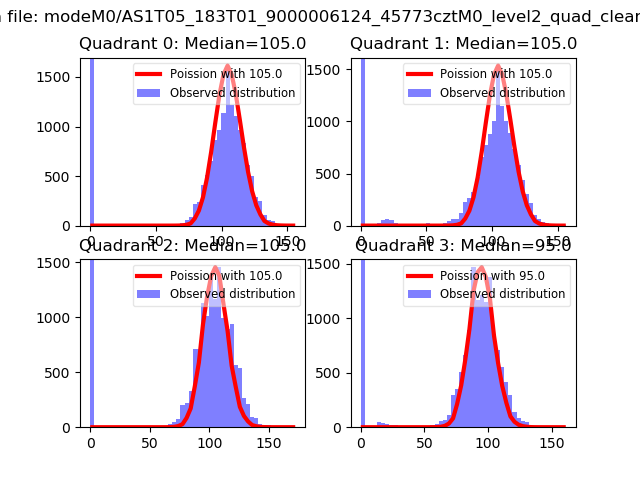 |
 |
| Quadrant-wise count rates Data is divided into 100 sec bins |
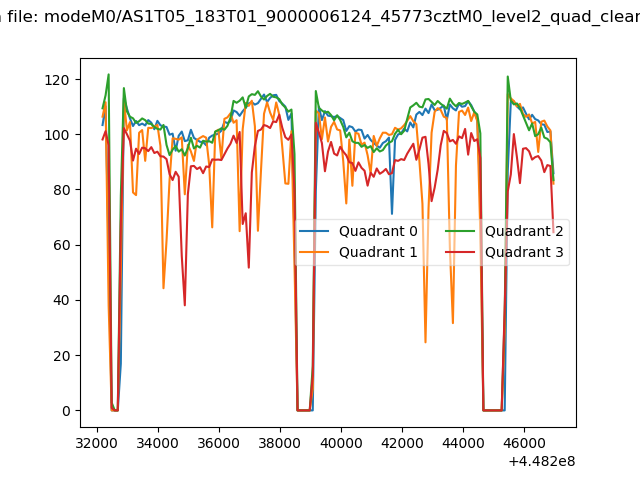 |
|
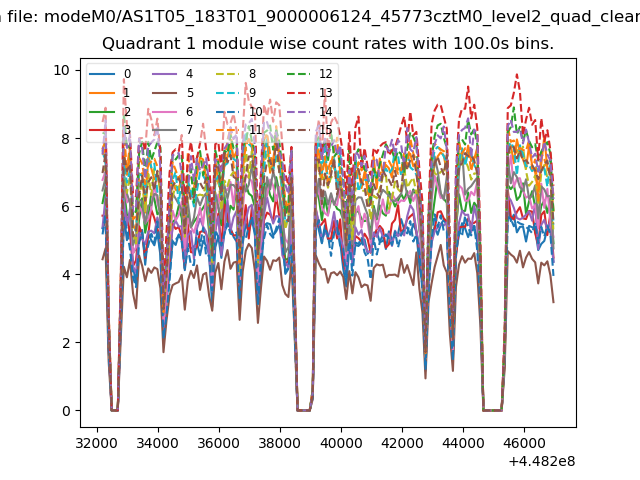
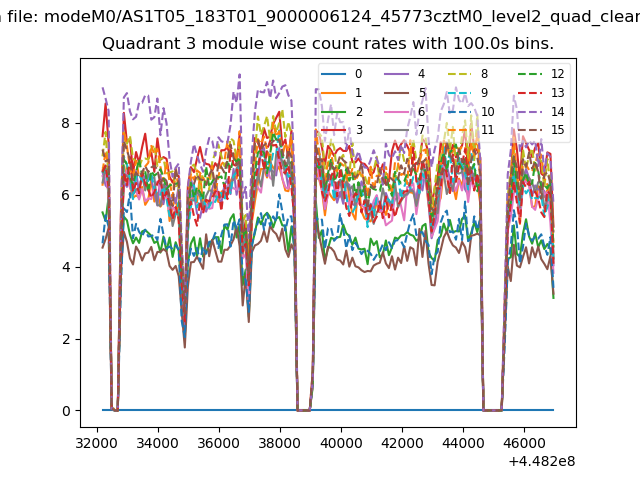
| Module-wise count rates for Quadrant A Data is divided into 100 sec bins |
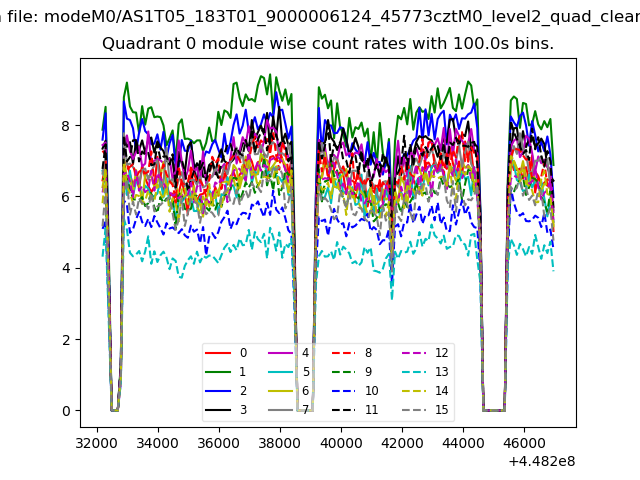 |
 |
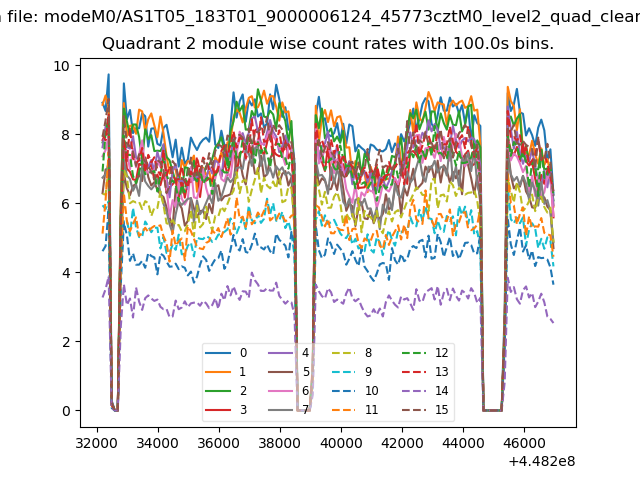
| Module-wise count rates for Quadrant B Data is divided into 100 sec bins |
 |
 |
| Module-wise count rates for Quadrant C Data is divided into 100 sec bins |
 |
 |
| Module-wise count rates for Quadrant D Data is divided into 100 sec bins |
 |
 |
| Parameter | Plot |
|---|---|
| CZT HV Monitor | 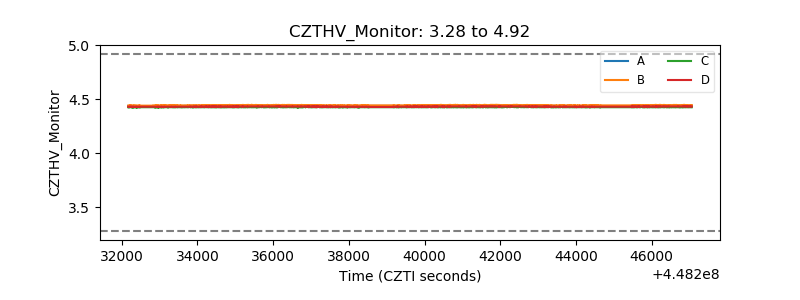 |
| D_VDD | 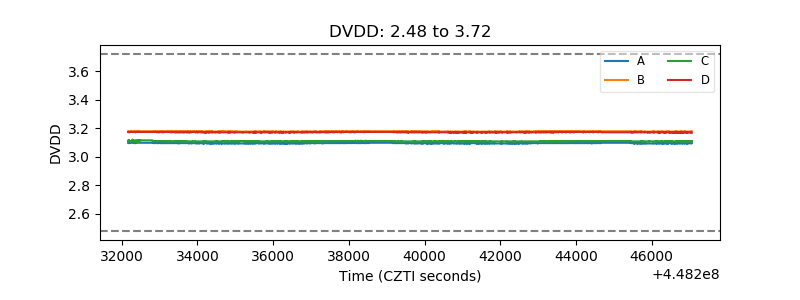 |
| Temperature 1 | 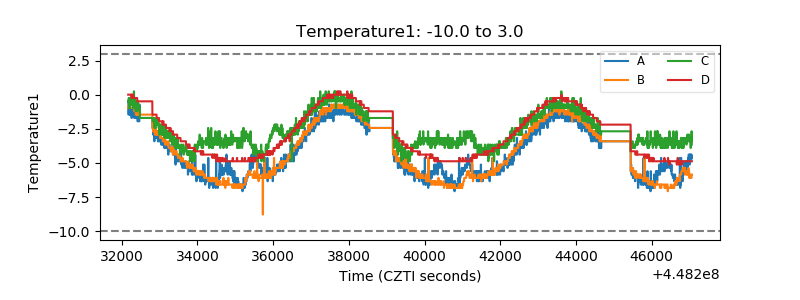 |
| Veto HV Monitor | 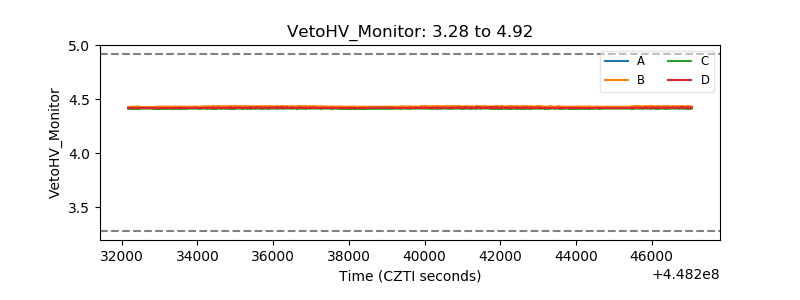 |
| Veto LLD | 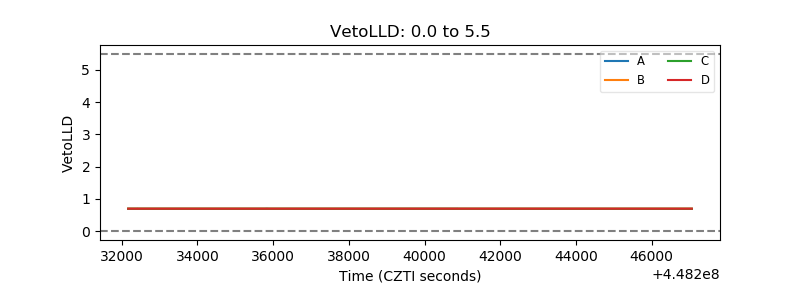 |
| Alpha Counter | 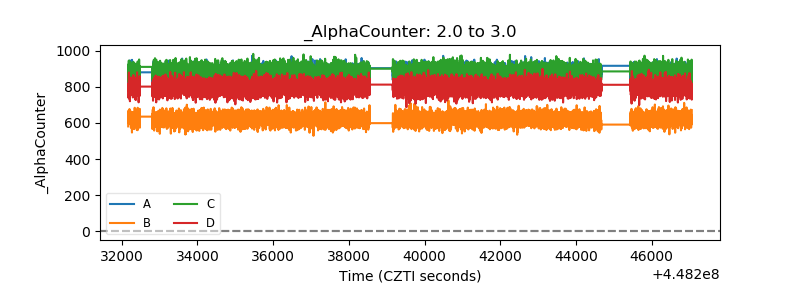 |
| _CPM_Rate | 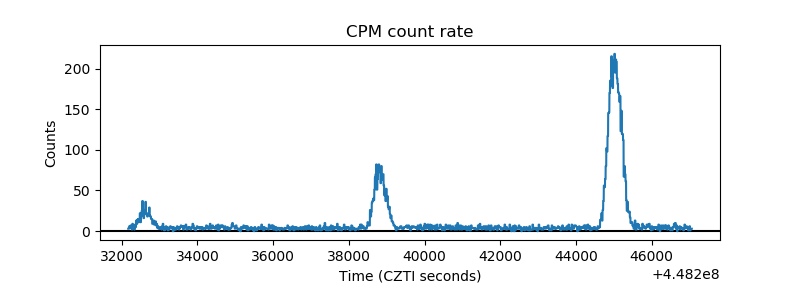 |
| CZT Counter | 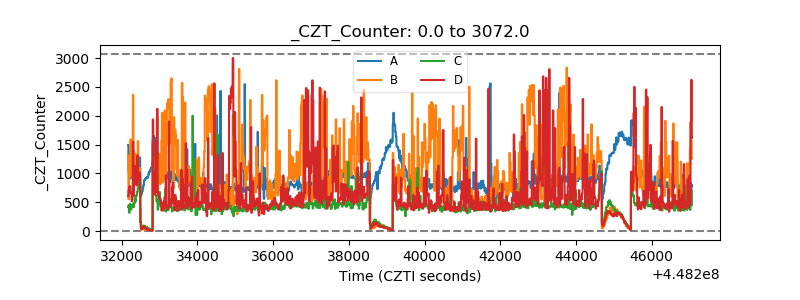 |
| +2.5 Volts monitor | 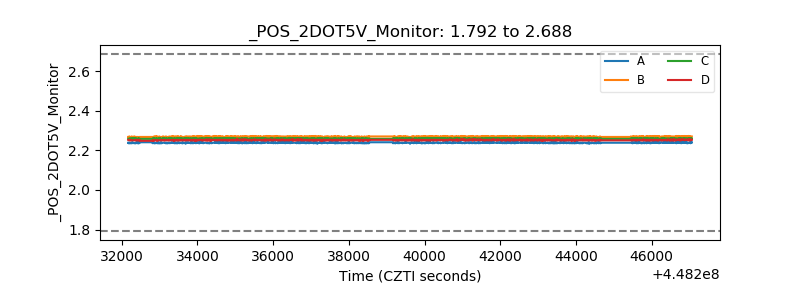 |
| +5 Volts monitor | 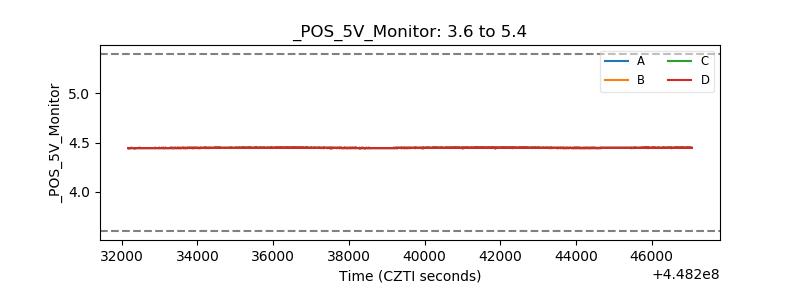 |
| _ROLL_ROT | 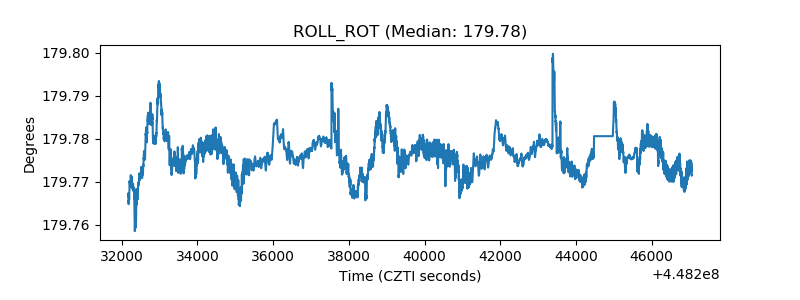 |
| _Roll_DEC | 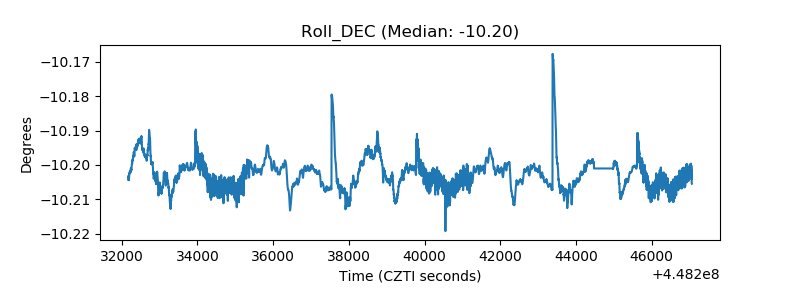 |
| _Roll_RA | 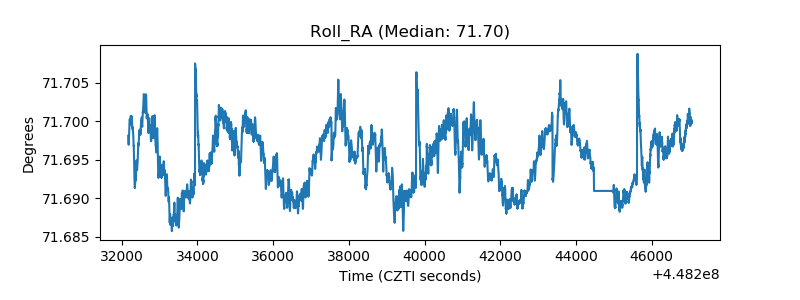 |
| Veto Counter | 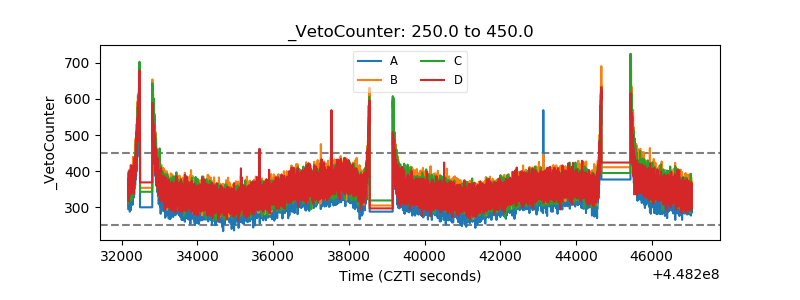 |