| Param | Original file | Final file |
|---|---|---|
| Filename | modeM0/AS1T05_183T01_9000006124_45774cztM0_level2.fits | modeM0/AS1T05_183T01_9000006124_45774cztM0_level2_quad_clean.evt |
| Size (bytes) | 647,740,800 | 105,912,000 |
| Size | 617.7 MB | 101.0 MB |
| Events in quadrant A | 6,404,673 | 713,257 |
| Events in quadrant B | 8,121,580 | 662,232 |
| Events in quadrant C | 3,772,850 | 721,218 |
| Events in quadrant D | 5,148,910 | 633,060 |
| Mode SS | |||
|---|---|---|---|
| Quadrant | BADHDUFLAG | Total packets | Discarded packets |
| A | 0 | 140 | 0 |
| B | 0 | 140 | 0 |
| C | 0 | 140 | 0 |
| D | 0 | 140 | 0 |
| Mode M0 | |||
|---|---|---|---|
| Quadrant | BADHDUFLAG | Total packets | Discarded packets |
| A | 0 | 23517 | 3 |
| B | 0 | 28971 | 2 |
| C | 0 | 16049 | 2 |
| D | 0 | 19984 | 2 |
| Mode M9 | |||
|---|---|---|---|
| Quadrant | BADHDUFLAG | Total packets | Discarded packets |
| A | 0 | 10 | 0 |
| B | 0 | 11 | 0 |
| C | 0 | 11 | 0 |
| D | 0 | 11 | 0 |
| Quadrant | Total seconds | Saturated seconds | Saturation percentage |
|---|---|---|---|
| A | 6838 | 298 | 4.357999% |
| B | 6838 | 1240 | 18.133957% |
| C | 6838 | 218 | 3.188067% |
| D | 6838 | 499 | 7.297455% |
Noise dominated data is calculated using 1-second bins in cleaned event files. If a bin has >2000 counts, and if more than 50% of those come from <1% of pixels, then it is considered to be noise-dominated and hence unusable.
| Quadrant | # 1 sec bins | Bins with >0 counts | Bins with >2000 counts | High rate bins dominated by noise | Noise dominated (total time) | Noise dominated (detector-on time) | Marked lightcurve |
|---|---|---|---|---|---|---|---|
| A | 7748 | 6839 | 72 | 72 | 0.93% | 1.05% | 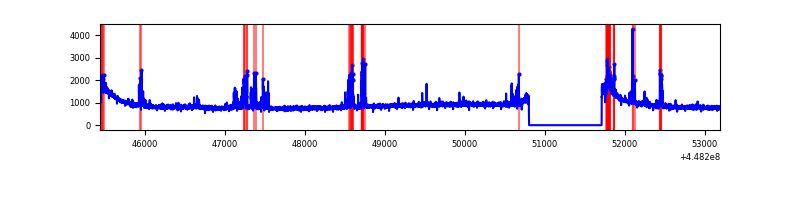 |
| B | 7748 | 6839 | 769 | 769 | 9.93% | 11.24% | 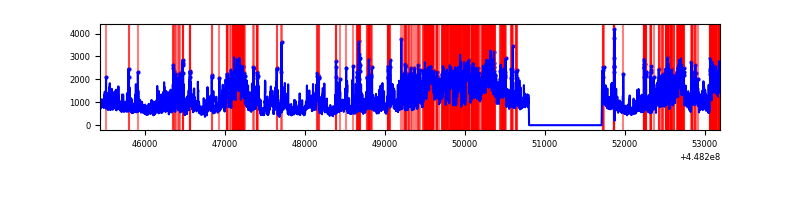 |
| C | 7748 | 6839 | 166 | 166 | 2.14% | 2.43% | 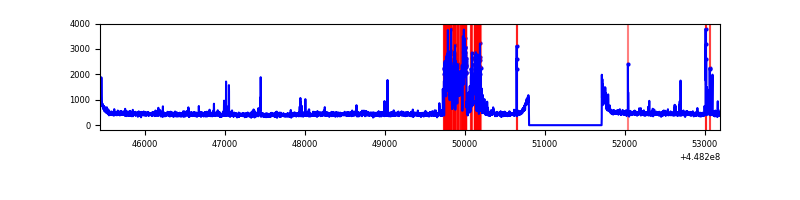 |
| D | 7748 | 6839 | 362 | 362 | 4.67% | 5.29% | 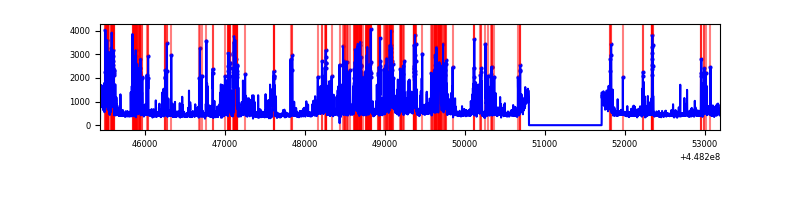 |
Top three noisy pixels from each quadrant. If the there are fewer than three noisy pixels in the level2.evt file, extra rows are filled as -1
| Pixel properties | Quadrant properties | ||||||
|---|---|---|---|---|---|---|---|
| Quadrant | DetID | PixID | Counts | Sigma | Mean | Median | Sigma |
| A | 10 | 83 | 3002459 | 18456.22 | 773 | 756 | 162.6 |
| A | 13 | 248 | 391268 | 2401.1 | 773 | 756 | 162.6 |
| A | 13 | 254 | 12311 | 71.05 | 773 | 756 | 162.6 |
| B | 3 | 112 | 3520776 | 23677.45 | 753 | 729 | 148.7 |
| B | 4 | 171 | 874495 | 5877.35 | 753 | 729 | 148.7 |
| B | 0 | 171 | 242784 | 1628.17 | 753 | 729 | 148.7 |
| C | 14 | 96 | 631192 | 3455.44 | 770 | 776 | 182.4 |
| C | 14 | 254 | 74486 | 404.02 | 770 | 776 | 182.4 |
| C | 2 | 14 | 26318 | 140.0 | 770 | 776 | 182.4 |
| D | 13 | 249 | 771267 | 4098.44 | 749 | 728 | 188.0 |
| D | 2 | 249 | 656394 | 3487.44 | 749 | 728 | 188.0 |
| D | 1 | 52 | 230779 | 1223.62 | 749 | 728 | 188.0 |
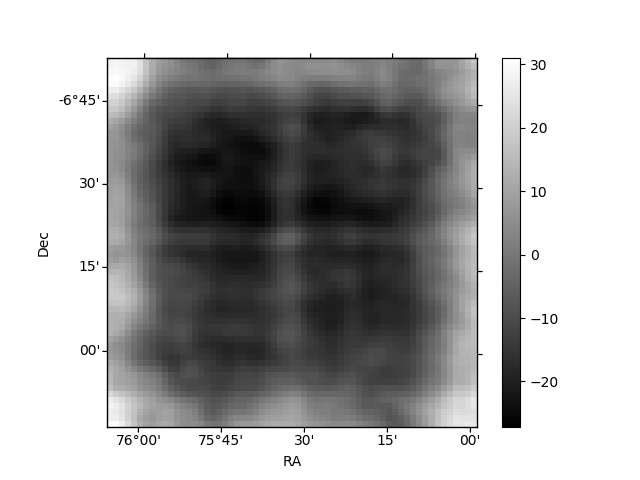
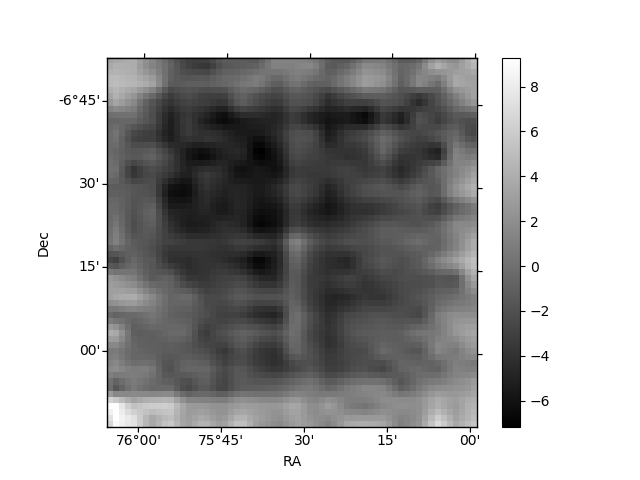
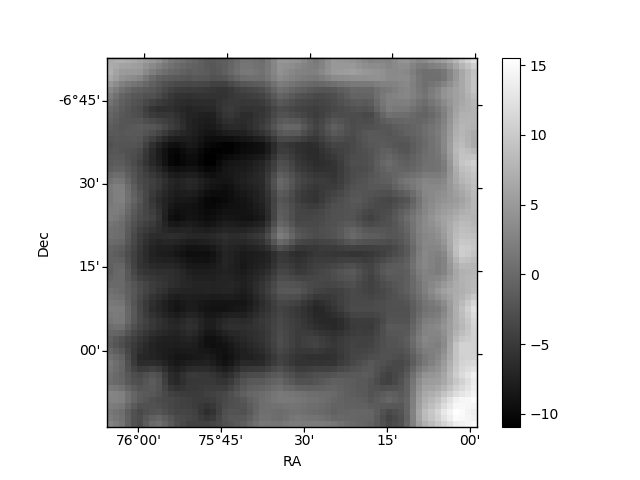
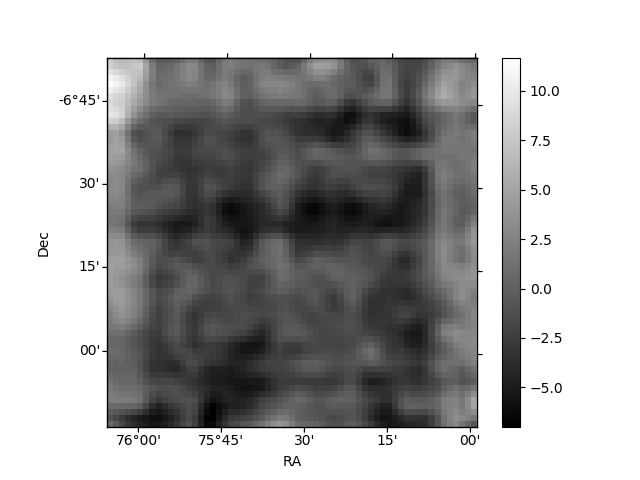
Histogram calculated using DETX and DETY for each event in the final _common_clean file
| Quadrant A | 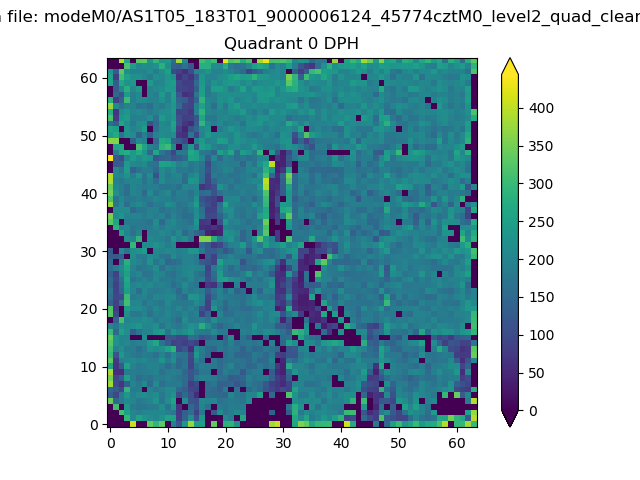 |
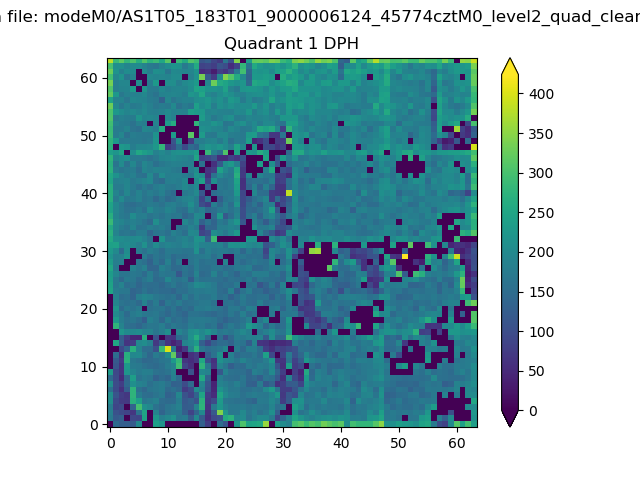 |
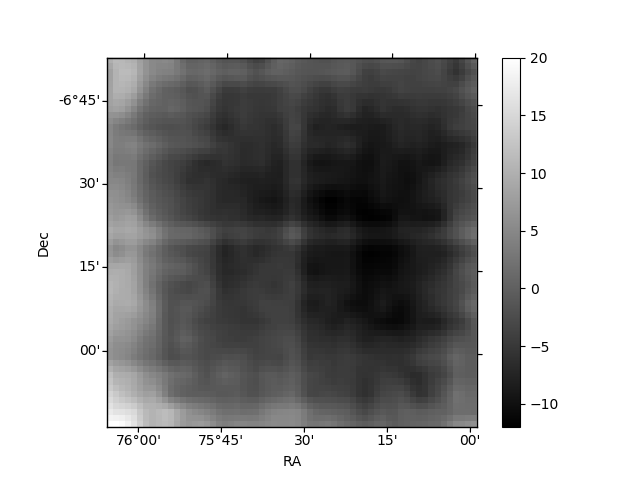
Quadrant B |
|---|---|---|---|
| Quadrant D | 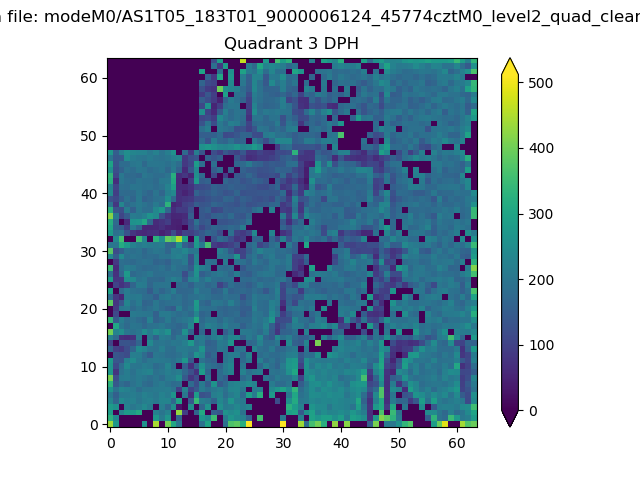 |
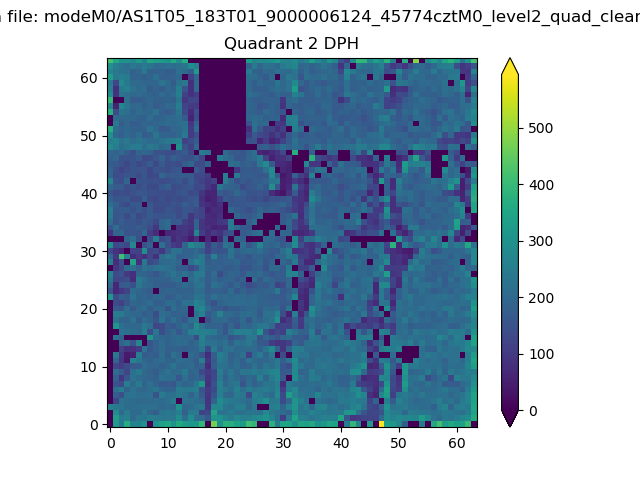 |
Quadrant C |
| Plot type | Count rate plots | Images |
|---|---|---|
| Comparison with Poisson distribution Blue bars denote a histogram of data divided into 1 sec bins. Red curve is a Poisson curve with rate = median count rate of data. |
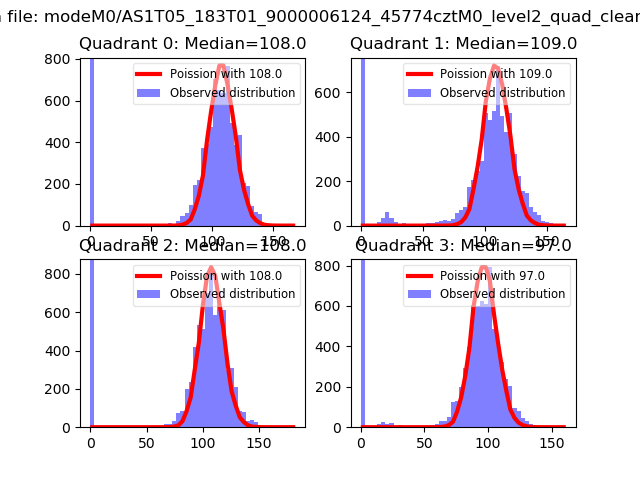 |
 |
| Quadrant-wise count rates Data is divided into 100 sec bins |
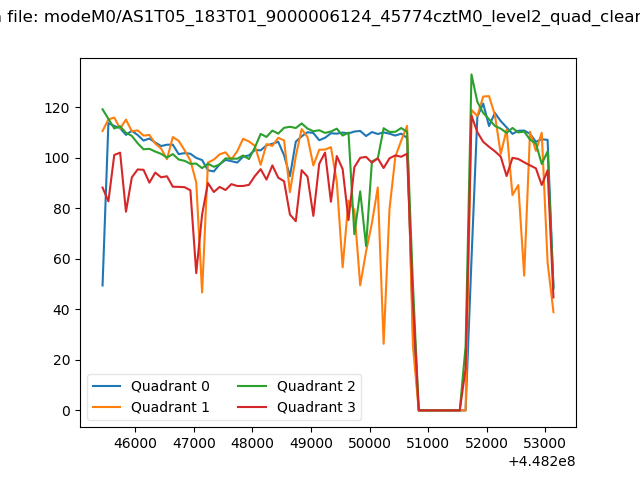 |
|
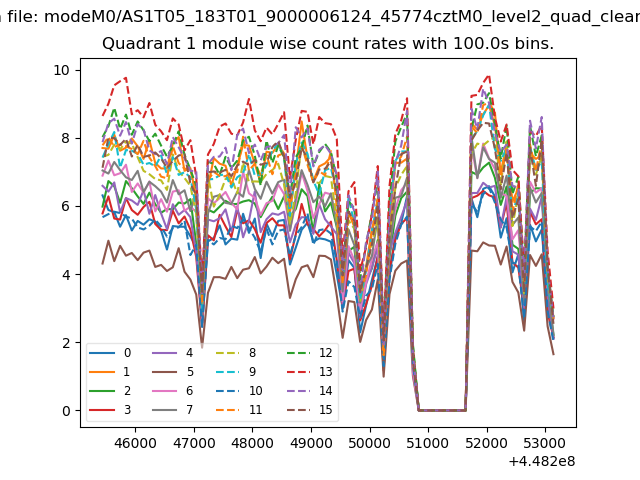
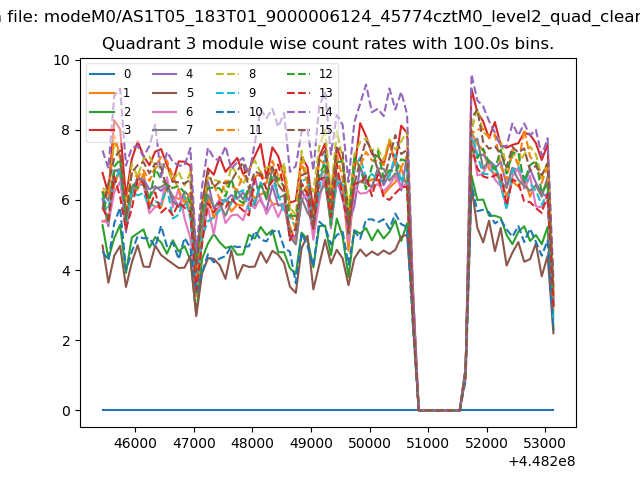
| Module-wise count rates for Quadrant A Data is divided into 100 sec bins |
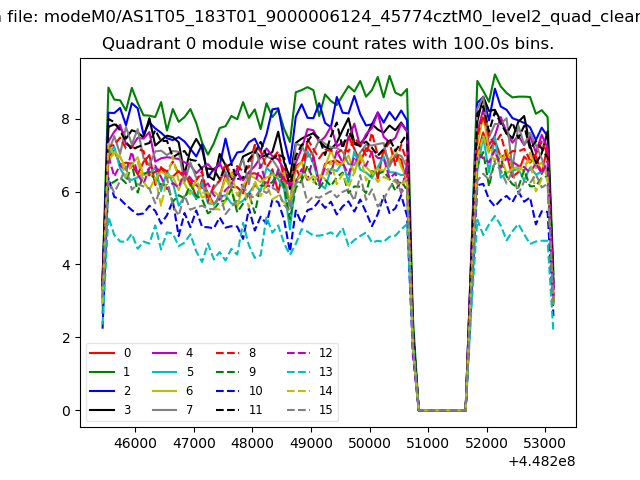 |
 |
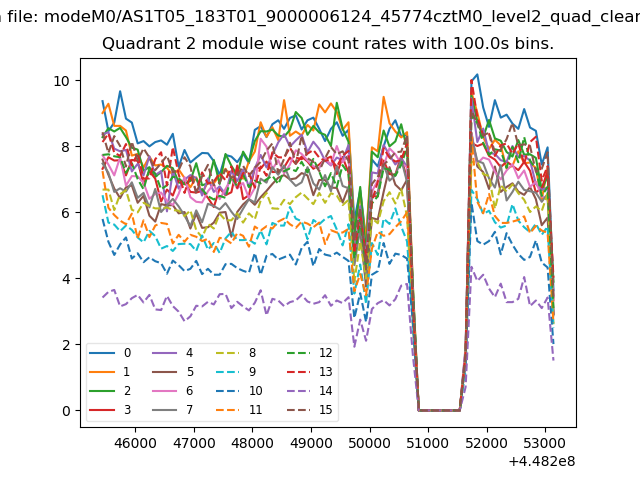
| Module-wise count rates for Quadrant B Data is divided into 100 sec bins |
 |
 |
| Module-wise count rates for Quadrant C Data is divided into 100 sec bins |
 |
 |
| Module-wise count rates for Quadrant D Data is divided into 100 sec bins |
 |
 |
| Parameter | Plot |
|---|---|
| CZT HV Monitor | 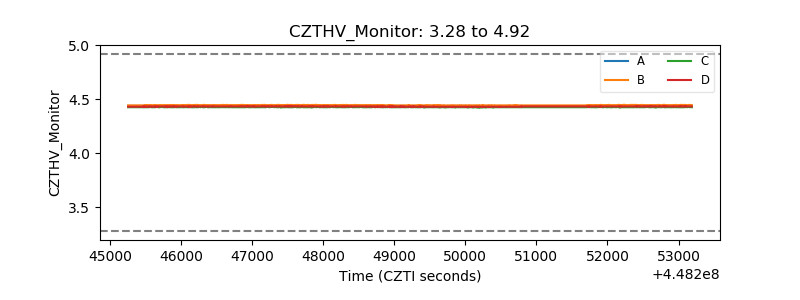 |
| D_VDD | 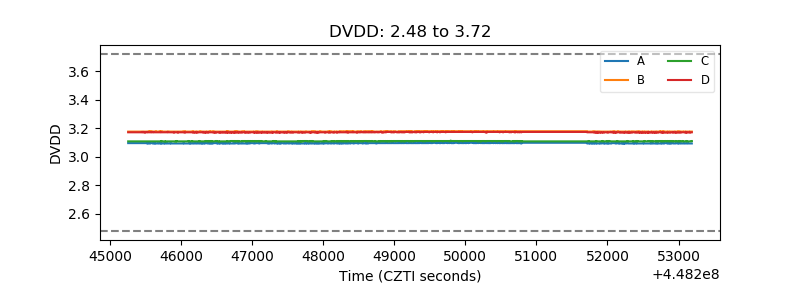 |
| Temperature 1 | 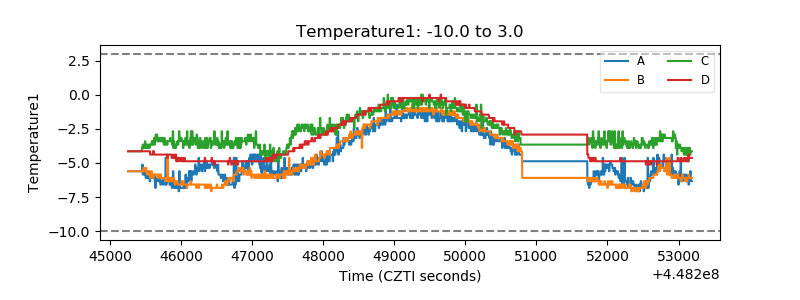 |
| Veto HV Monitor | 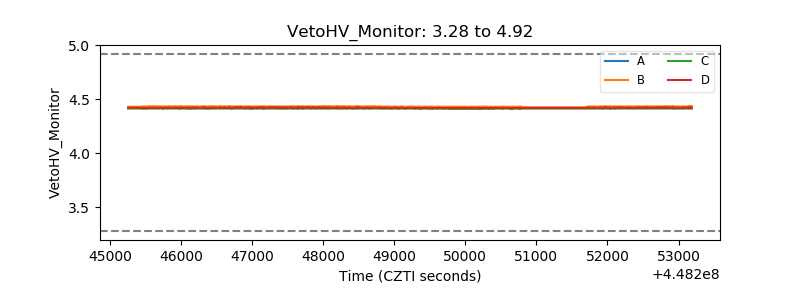 |
| Veto LLD | 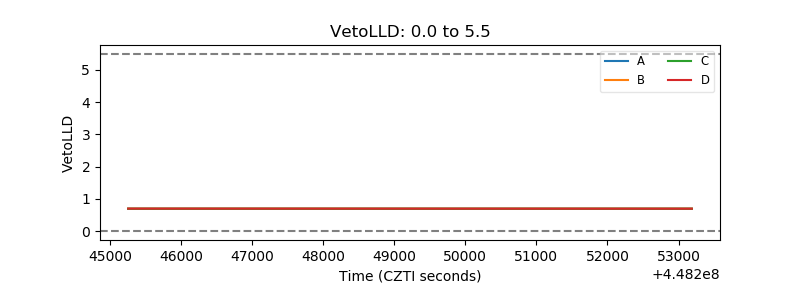 |
| Alpha Counter | 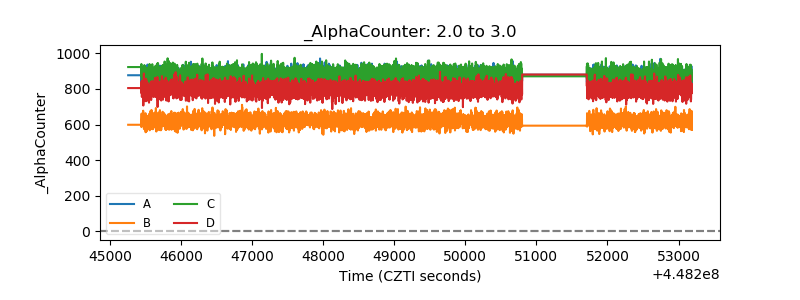 |
| _CPM_Rate | 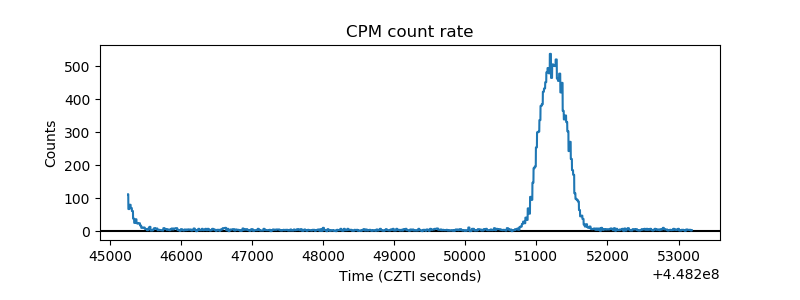 |
| CZT Counter | 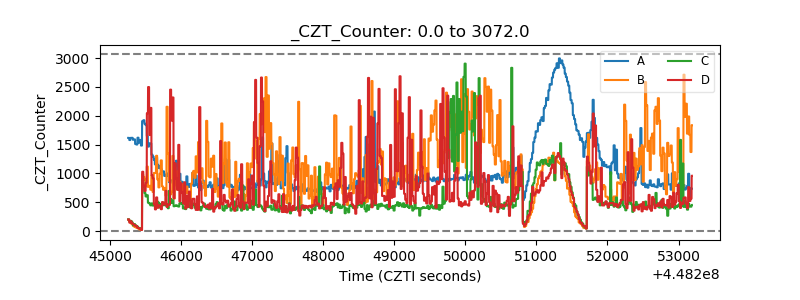 |
| +2.5 Volts monitor |  |
| +5 Volts monitor | 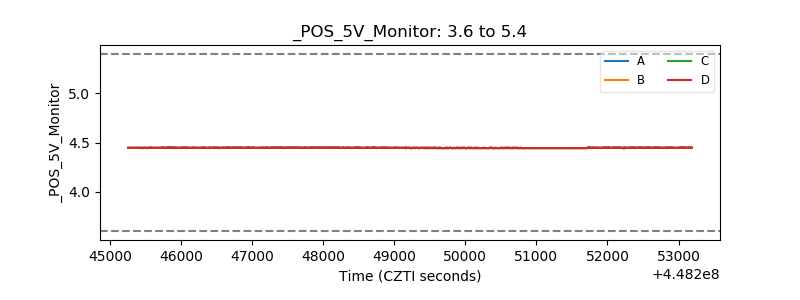 |
| _ROLL_ROT | 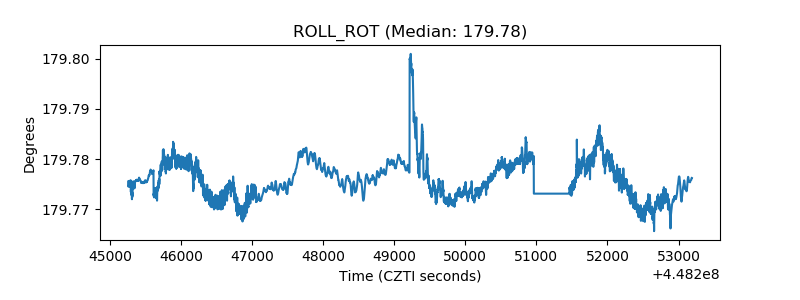 |
| _Roll_DEC | 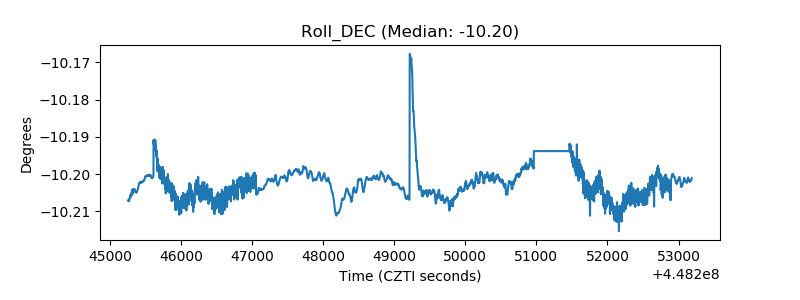 |
| _Roll_RA | 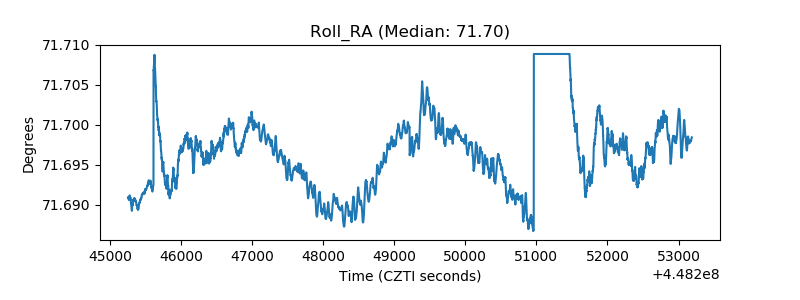 |
| Veto Counter | 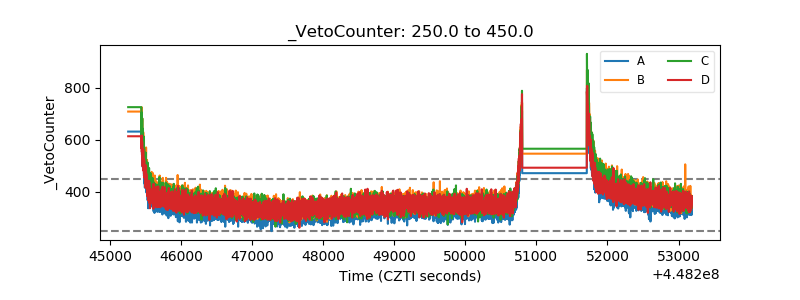 |