| Param | Original file | Final file |
|---|---|---|
| Filename | modeM0/AS1T05_183T01_9000006124_45776cztM0_level2.fits | modeM0/AS1T05_183T01_9000006124_45776cztM0_level2_quad_clean.evt |
| Size (bytes) | 639,267,840 | 106,773,120 |
| Size | 609.7 MB | 101.8 MB |
| Events in quadrant A | 6,287,280 | 716,343 |
| Events in quadrant B | 8,205,089 | 667,673 |
| Events in quadrant C | 3,707,141 | 724,825 |
| Events in quadrant D | 4,948,953 | 659,487 |
| Mode SS | |||
|---|---|---|---|
| Quadrant | BADHDUFLAG | Total packets | Discarded packets |
| A | 0 | 136 | 0 |
| B | 0 | 136 | 0 |
| C | 0 | 136 | 0 |
| D | 0 | 136 | 0 |
| Mode M0 | |||
|---|---|---|---|
| Quadrant | BADHDUFLAG | Total packets | Discarded packets |
| A | 0 | 23022 | 2 |
| B | 0 | 29136 | 2 |
| C | 0 | 15555 | 2 |
| D | 0 | 19198 | 2 |
| Mode M9 | |||
|---|---|---|---|
| Quadrant | BADHDUFLAG | Total packets | Discarded packets |
| A | 0 | 11 | 0 |
| B | 0 | 12 | 0 |
| C | 0 | 12 | 0 |
| D | 0 | 12 | 0 |
| Quadrant | Total seconds | Saturated seconds | Saturation percentage |
|---|---|---|---|
| A | 6657 | 349 | 5.242602% |
| B | 6657 | 1281 | 19.242902% |
| C | 6657 | 272 | 4.085925% |
| D | 6657 | 299 | 4.491513% |
Noise dominated data is calculated using 1-second bins in cleaned event files. If a bin has >2000 counts, and if more than 50% of those come from <1% of pixels, then it is considered to be noise-dominated and hence unusable.
| Quadrant | # 1 sec bins | Bins with >0 counts | Bins with >2000 counts | High rate bins dominated by noise | Noise dominated (total time) | Noise dominated (detector-on time) | Marked lightcurve |
|---|---|---|---|---|---|---|---|
| A | 7702 | 6658 | 86 | 86 | 1.12% | 1.29% | 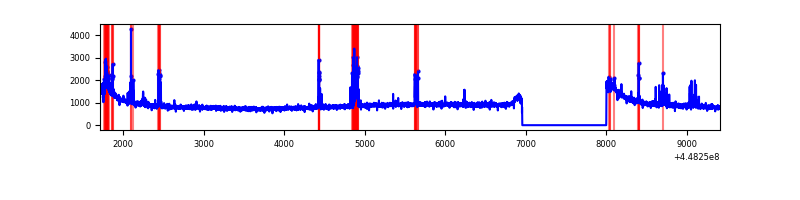 |
| B | 7702 | 6658 | 750 | 750 | 9.74% | 11.26% | 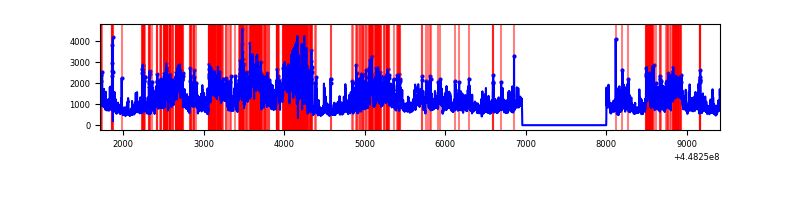 |
| C | 7702 | 6658 | 157 | 157 | 2.04% | 2.36% | 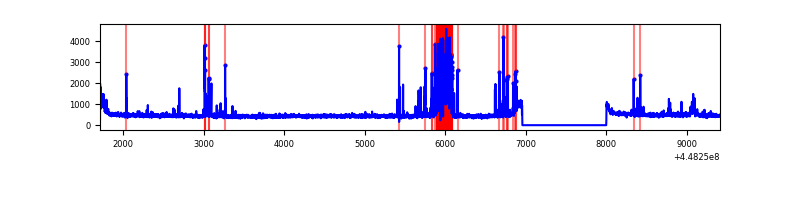 |
| D | 7702 | 6658 | 164 | 164 | 2.13% | 2.46% | 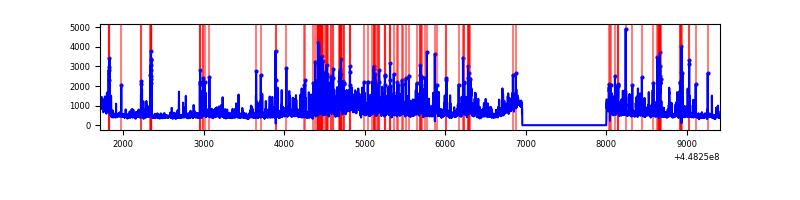 |
Top three noisy pixels from each quadrant. If the there are fewer than three noisy pixels in the level2.evt file, extra rows are filled as -1
| Pixel properties | Quadrant properties | ||||||
|---|---|---|---|---|---|---|---|
| Quadrant | DetID | PixID | Counts | Sigma | Mean | Median | Sigma |
| A | 10 | 83 | 2953712 | 18225.03 | 777 | 761 | 162.0 |
| A | 13 | 248 | 292279 | 1799.19 | 777 | 761 | 162.0 |
| A | 7 | 191 | 28273 | 169.8 | 777 | 761 | 162.0 |
| B | 3 | 112 | 4017100 | 27165.57 | 745 | 721 | 147.8 |
| B | 15 | 201 | 680223 | 4595.95 | 745 | 721 | 147.8 |
| B | 0 | 171 | 181878 | 1225.29 | 745 | 721 | 147.8 |
| C | 14 | 254 | 665168 | 3656.51 | 769 | 774 | 181.7 |
| C | 1 | 3 | 23916 | 127.36 | 769 | 774 | 181.7 |
| C | 3 | 233 | 10788 | 55.11 | 769 | 774 | 181.7 |
| D | 1 | 52 | 1059357 | 5529.28 | 763 | 741 | 191.5 |
| D | 13 | 249 | 306610 | 1597.59 | 763 | 741 | 191.5 |
| D | 2 | 249 | 189273 | 984.72 | 763 | 741 | 191.5 |
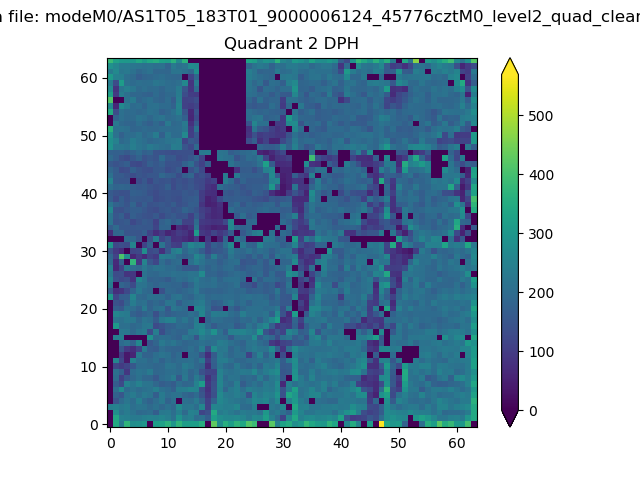
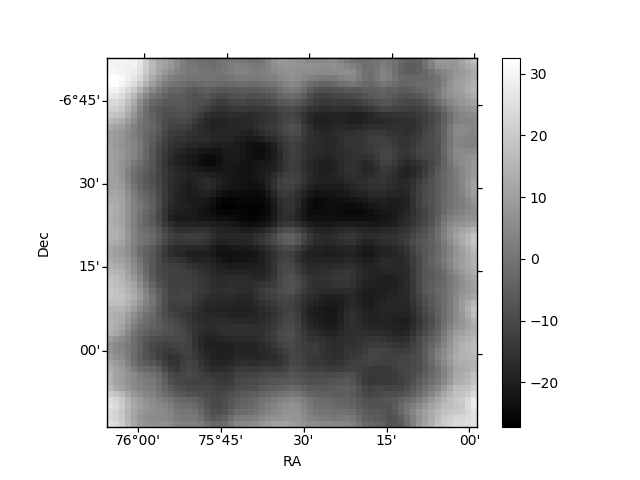
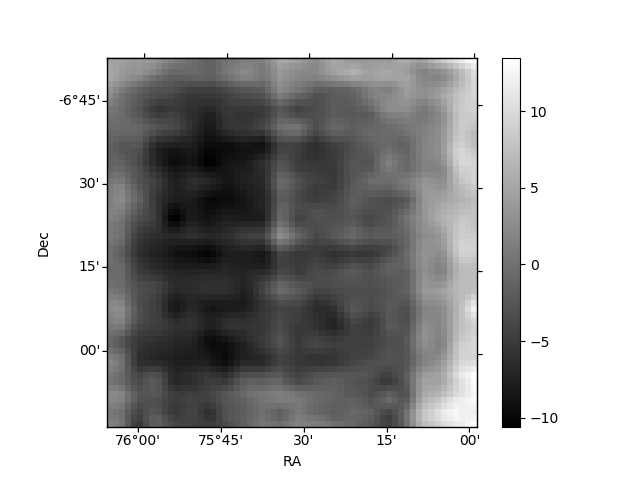
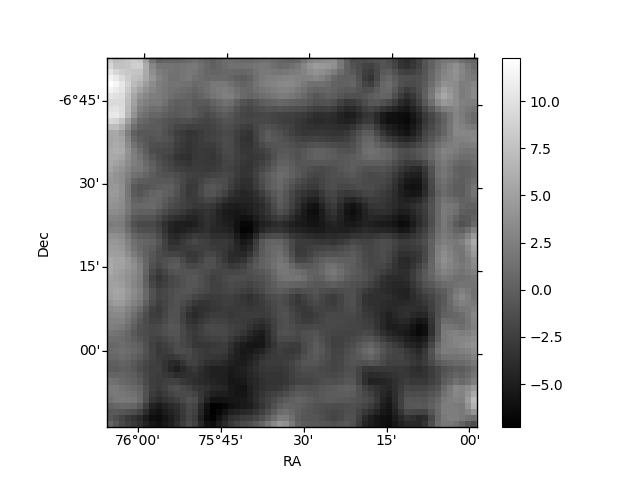
Histogram calculated using DETX and DETY for each event in the final _common_clean file
| Quadrant A | 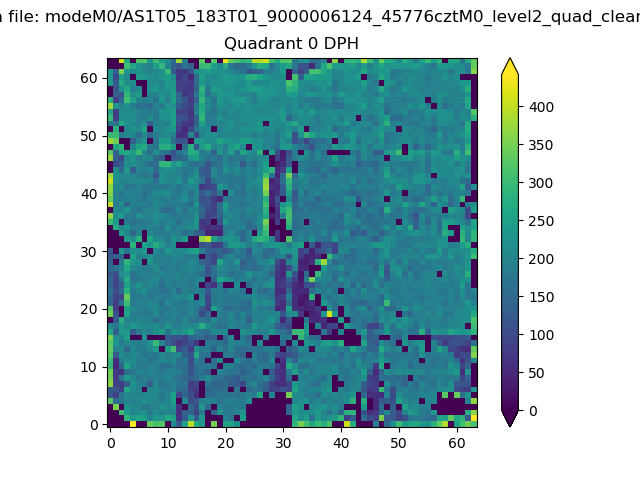 |
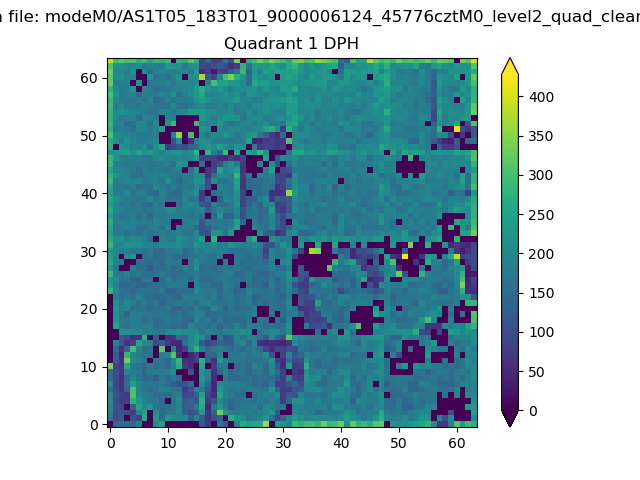 |
Quadrant B |
|---|---|---|---|
| Quadrant D | 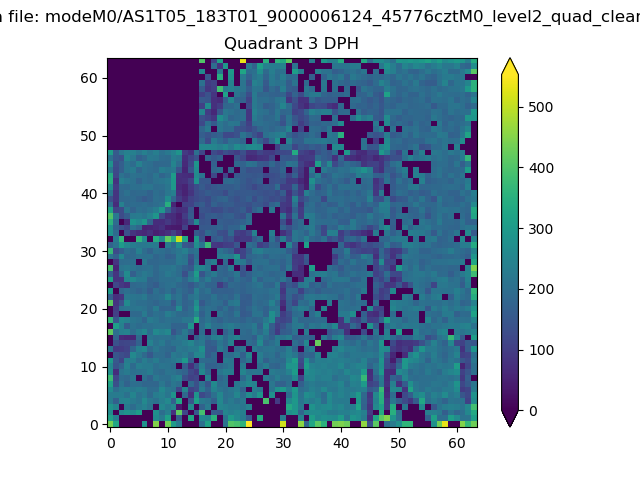 |
 |
Quadrant C |
| Plot type | Count rate plots | Images |
|---|---|---|
| Comparison with Poisson distribution Blue bars denote a histogram of data divided into 1 sec bins. Red curve is a Poisson curve with rate = median count rate of data. |
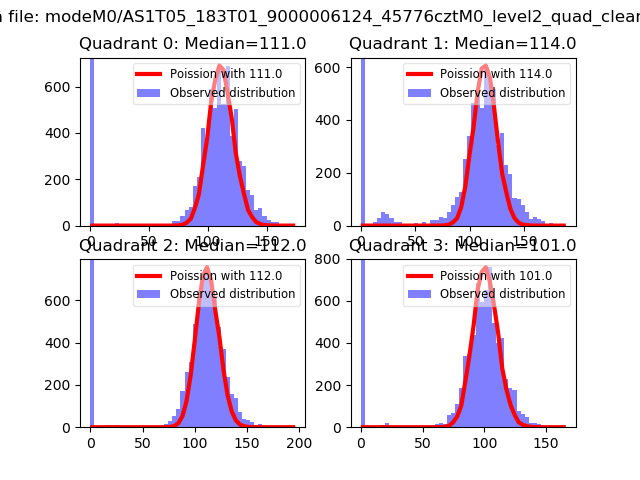 |
 |
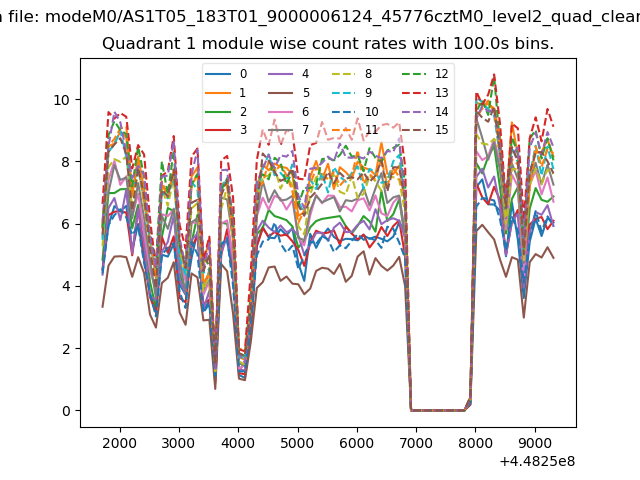
| Quadrant-wise count rates Data is divided into 100 sec bins |
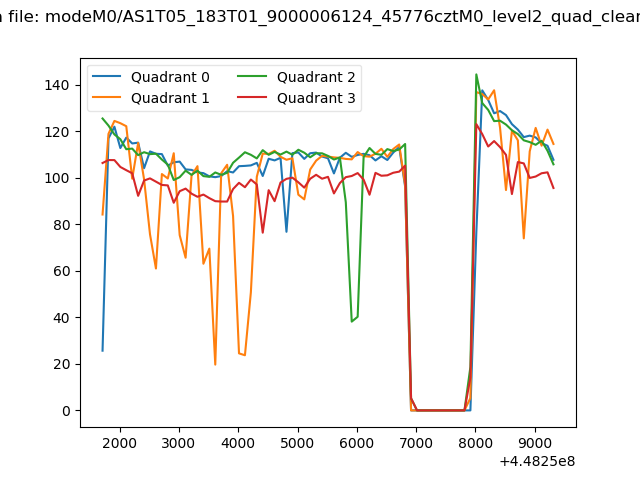 |
|
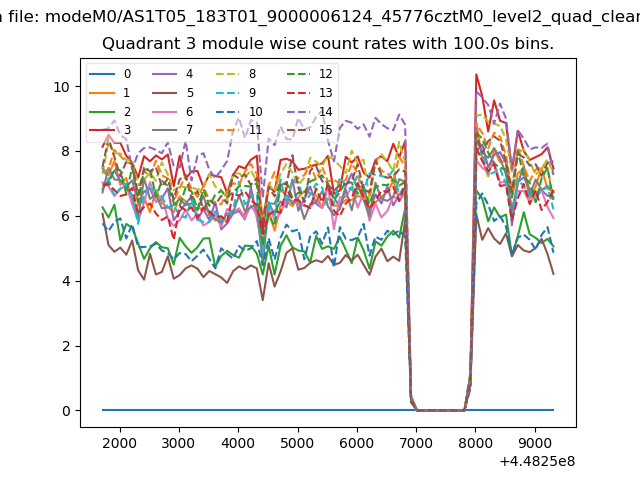
| Module-wise count rates for Quadrant A Data is divided into 100 sec bins |
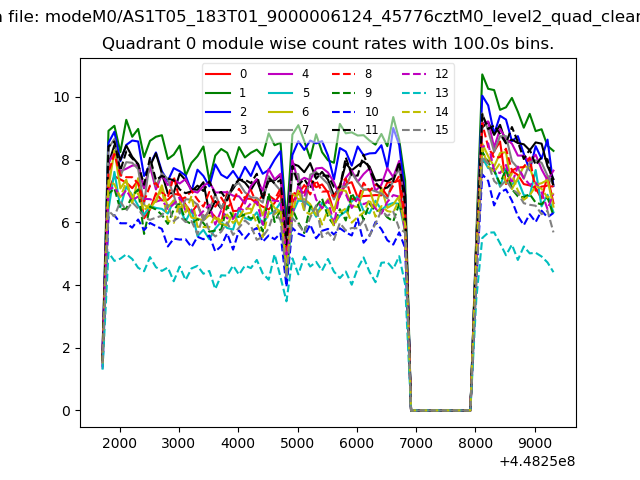 |
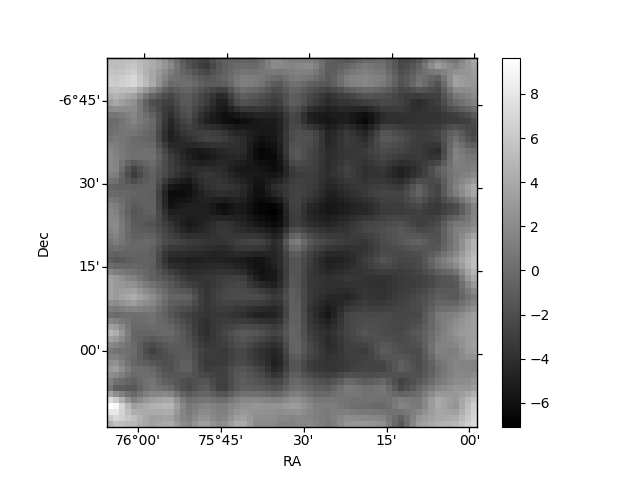 |
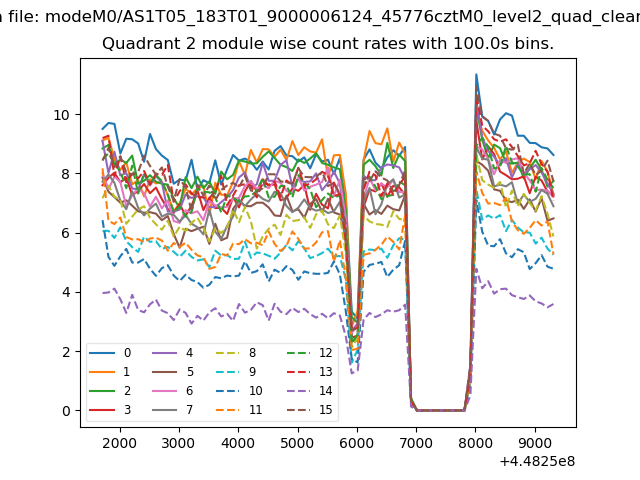
| Module-wise count rates for Quadrant B Data is divided into 100 sec bins |
 |
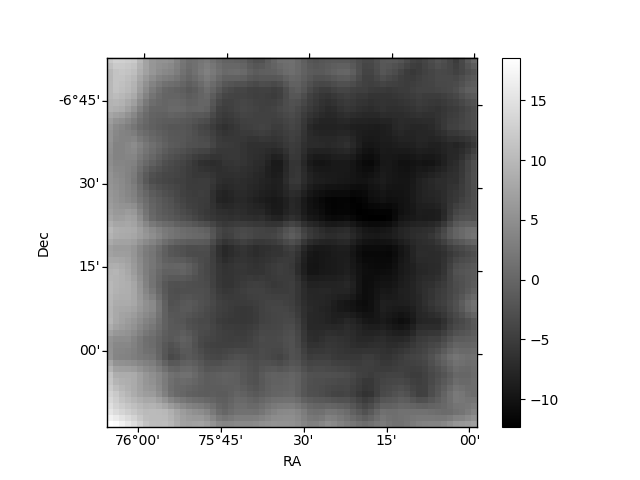 |
| Module-wise count rates for Quadrant C Data is divided into 100 sec bins |
 |
 |
| Module-wise count rates for Quadrant D Data is divided into 100 sec bins |
 |
 |
| Parameter | Plot |
|---|---|
| CZT HV Monitor | 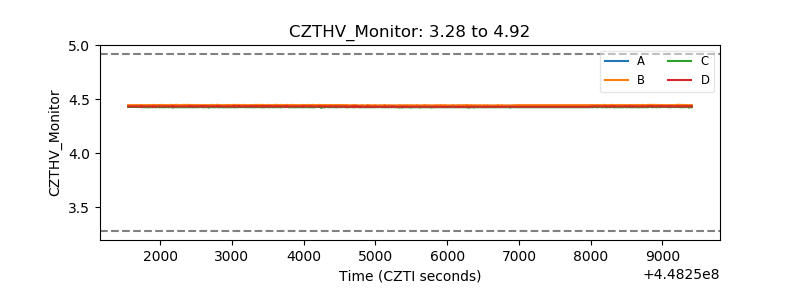 |
| D_VDD | 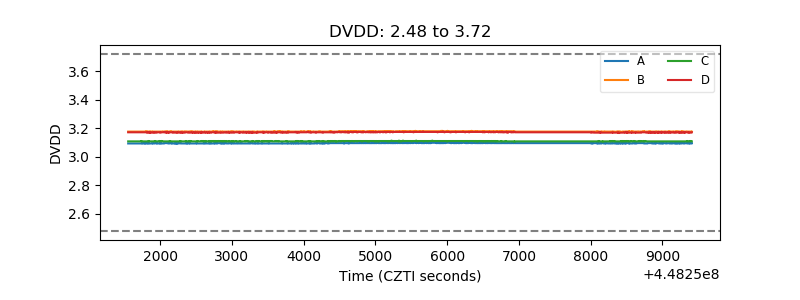 |
| Temperature 1 | 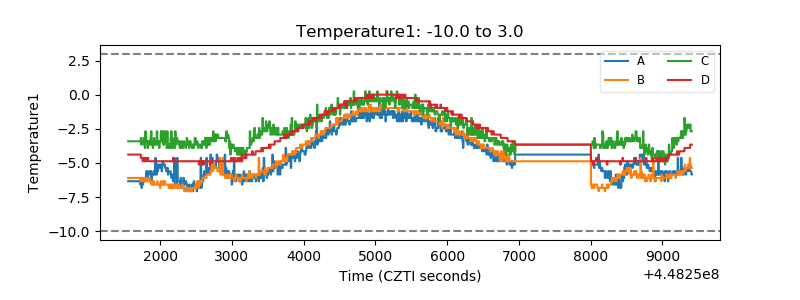 |
| Veto HV Monitor |  |
| Veto LLD | 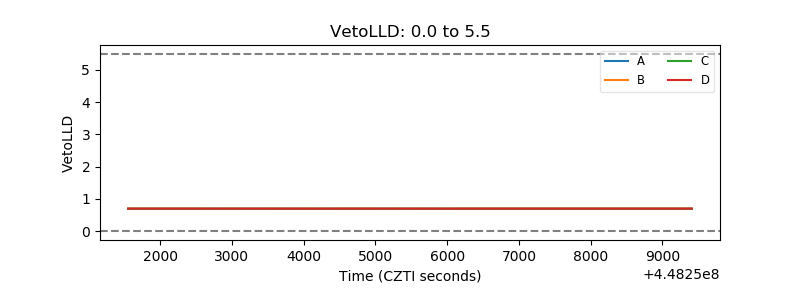 |
| Alpha Counter | 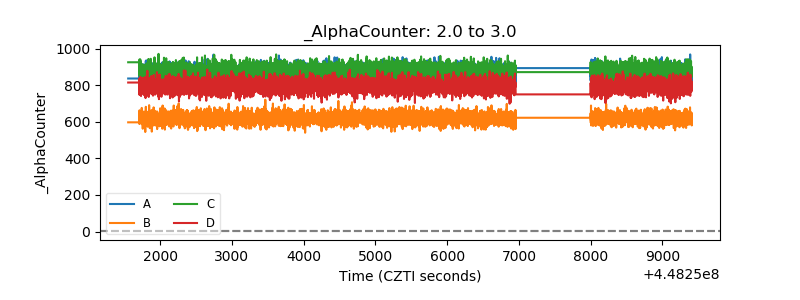 |
| _CPM_Rate | 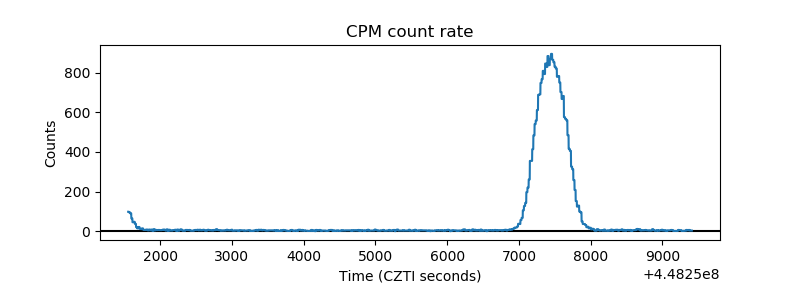 |
| CZT Counter | 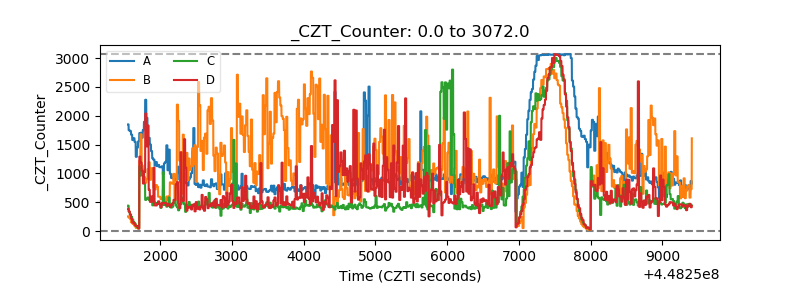 |
| +2.5 Volts monitor |  |
| +5 Volts monitor | 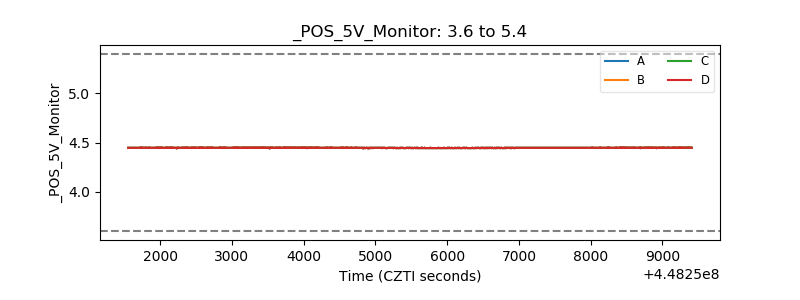 |
| _ROLL_ROT | 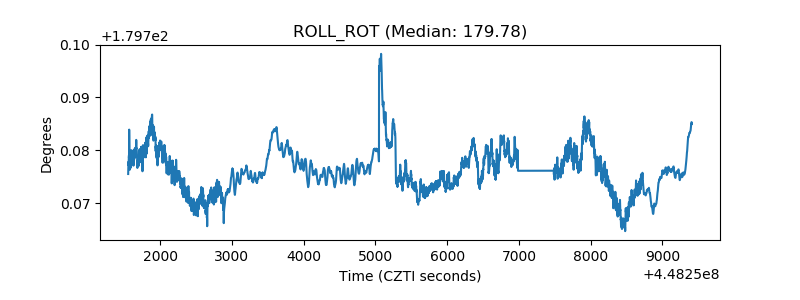 |
| _Roll_DEC | 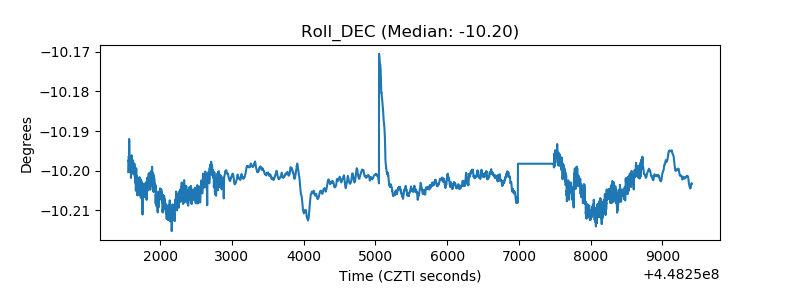 |
| _Roll_RA | 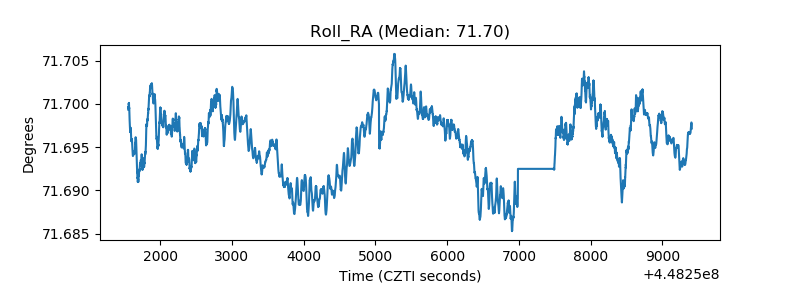 |
| Veto Counter | 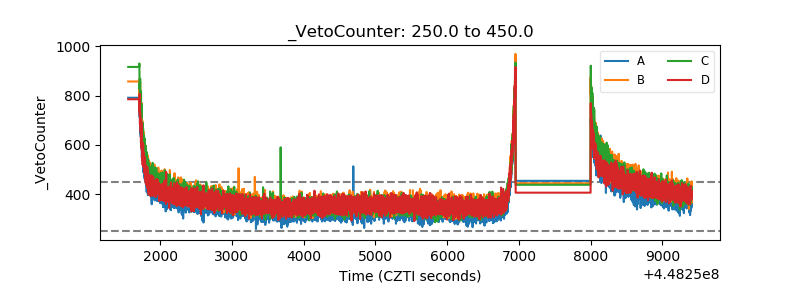 |