| Param | Original file | Final file |
|---|---|---|
| Filename | modeM0/AS1T05_183T01_9000006124_45777cztM0_level2.fits | modeM0/AS1T05_183T01_9000006124_45777cztM0_level2_quad_clean.evt |
| Size (bytes) | 639,967,680 | 109,909,440 |
| Size | 610.3 MB | 104.8 MB |
| Events in quadrant A | 6,303,431 | 749,666 |
| Events in quadrant B | 8,128,533 | 681,819 |
| Events in quadrant C | 3,367,586 | 766,822 |
| Events in quadrant D | 5,386,625 | 675,653 |
| Mode SS | |||
|---|---|---|---|
| Quadrant | BADHDUFLAG | Total packets | Discarded packets |
| A | 0 | 132 | 0 |
| B | 0 | 132 | 0 |
| C | 0 | 132 | 0 |
| D | 0 | 132 | 0 |
| Mode M0 | |||
|---|---|---|---|
| Quadrant | BADHDUFLAG | Total packets | Discarded packets |
| A | 0 | 22914 | 2 |
| B | 0 | 28843 | 2 |
| C | 0 | 14269 | 2 |
| D | 0 | 20397 | 2 |
| Mode M9 | |||
|---|---|---|---|
| Quadrant | BADHDUFLAG | Total packets | Discarded packets |
| A | 0 | 15 | 0 |
| B | 0 | 16 | 0 |
| C | 0 | 16 | 0 |
| D | 0 | 16 | 0 |
| Quadrant | Total seconds | Saturated seconds | Saturation percentage |
|---|---|---|---|
| A | 6509 | 313 | 4.808726% |
| B | 6509 | 1308 | 20.095253% |
| C | 6509 | 103 | 1.582424% |
| D | 6509 | 437 | 6.713781% |
Noise dominated data is calculated using 1-second bins in cleaned event files. If a bin has >2000 counts, and if more than 50% of those come from <1% of pixels, then it is considered to be noise-dominated and hence unusable.
| Quadrant | # 1 sec bins | Bins with >0 counts | Bins with >2000 counts | High rate bins dominated by noise | Noise dominated (total time) | Noise dominated (detector-on time) | Marked lightcurve |
|---|---|---|---|---|---|---|---|
| A | 7644 | 6510 | 46 | 46 | 0.60% | 0.71% | 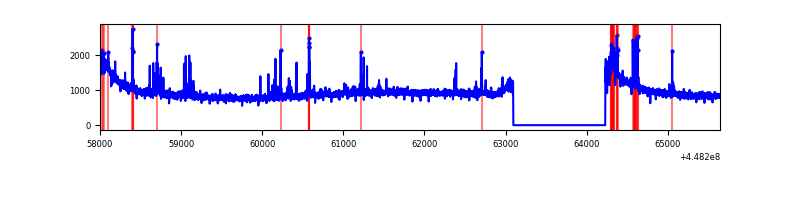 |
| B | 7644 | 6510 | 804 | 804 | 10.52% | 12.35% | 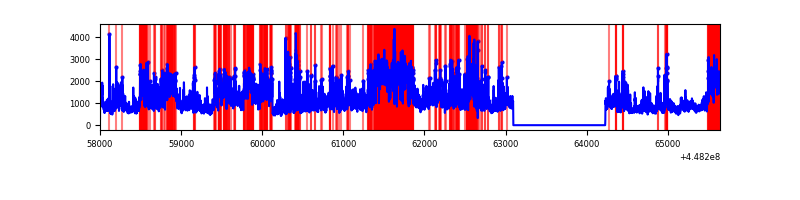 |
| C | 7644 | 6510 | 35 | 35 | 0.46% | 0.54% | 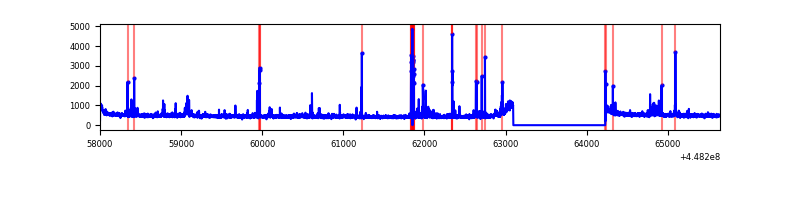 |
| D | 7644 | 6510 | 286 | 286 | 3.74% | 4.39% | 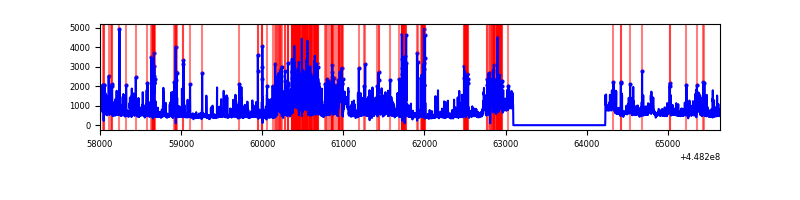 |
Top three noisy pixels from each quadrant. If the there are fewer than three noisy pixels in the level2.evt file, extra rows are filled as -1
| Pixel properties | Quadrant properties | ||||||
|---|---|---|---|---|---|---|---|
| Quadrant | DetID | PixID | Counts | Sigma | Mean | Median | Sigma |
| A | 10 | 83 | 3022046 | 18323.39 | 787 | 770 | 164.9 |
| A | 13 | 248 | 198221 | 1197.5 | 787 | 770 | 164.9 |
| A | 7 | 191 | 14462 | 83.04 | 787 | 770 | 164.9 |
| B | 3 | 112 | 4088124 | 27568.32 | 756 | 733 | 148.3 |
| B | 15 | 201 | 310415 | 2088.72 | 756 | 733 | 148.3 |
| B | 5 | 255 | 218137 | 1466.33 | 756 | 733 | 148.3 |
| C | 14 | 254 | 174336 | 949.31 | 784 | 792 | 182.8 |
| C | 1 | 3 | 73459 | 397.5 | 784 | 792 | 182.8 |
| C | 12 | 2 | 28304 | 150.49 | 784 | 792 | 182.8 |
| D | 1 | 52 | 1121809 | 5806.66 | 768 | 746 | 193.1 |
| D | 2 | 249 | 391428 | 2023.58 | 768 | 746 | 193.1 |
| D | 11 | 241 | 326066 | 1685.03 | 768 | 746 | 193.1 |
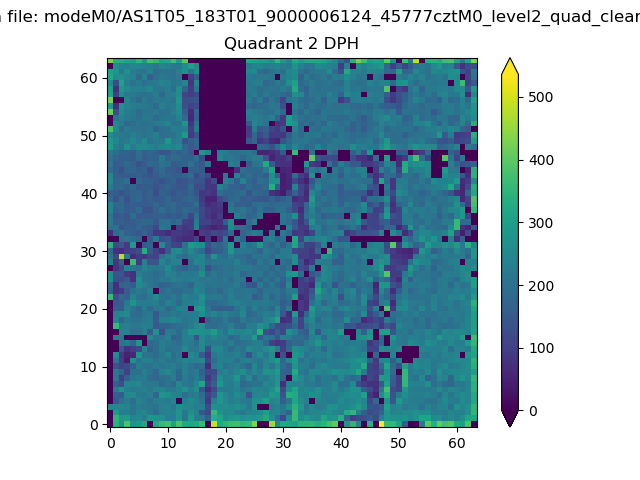
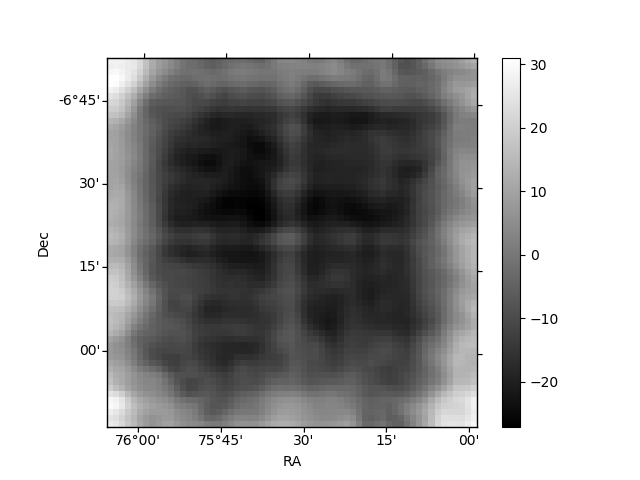
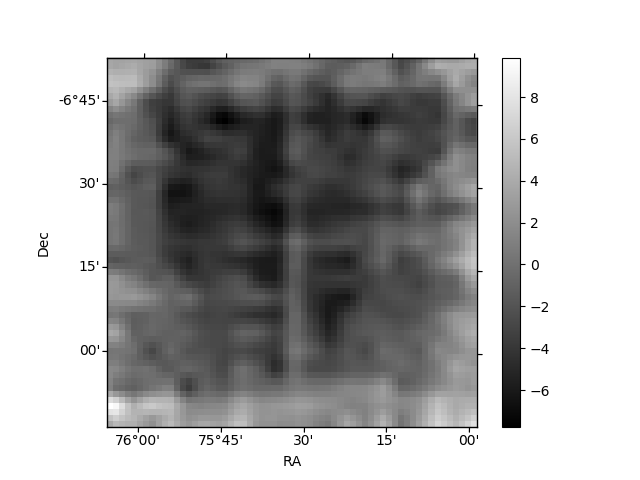
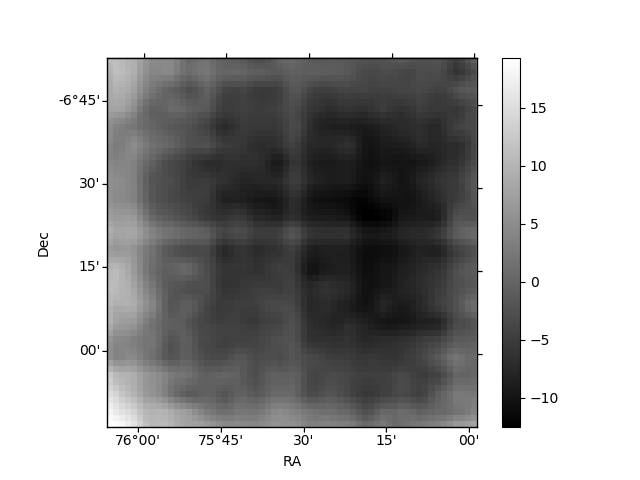
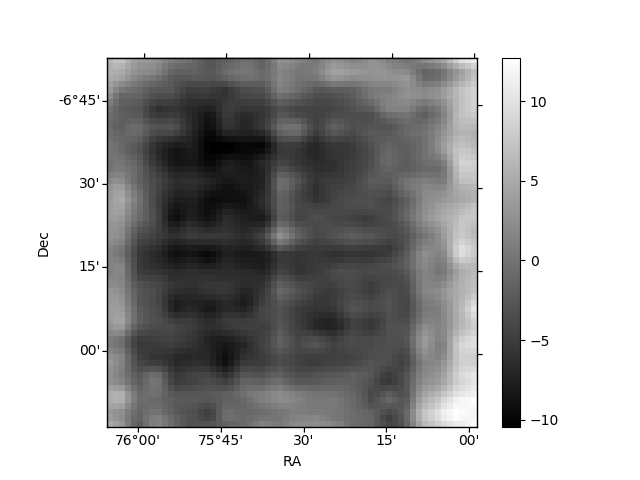
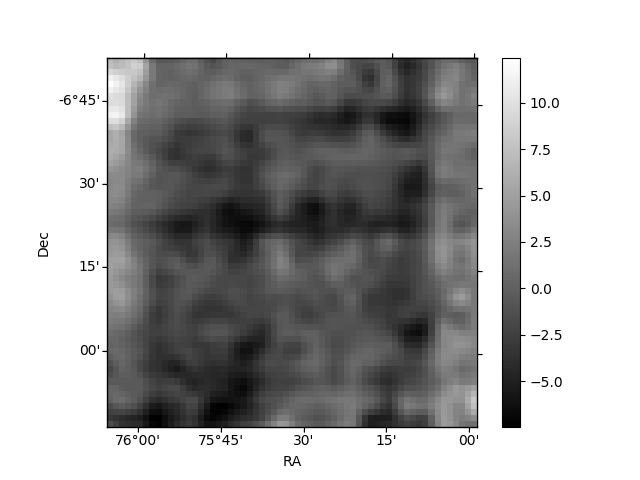
Histogram calculated using DETX and DETY for each event in the final _common_clean file
| Quadrant A | 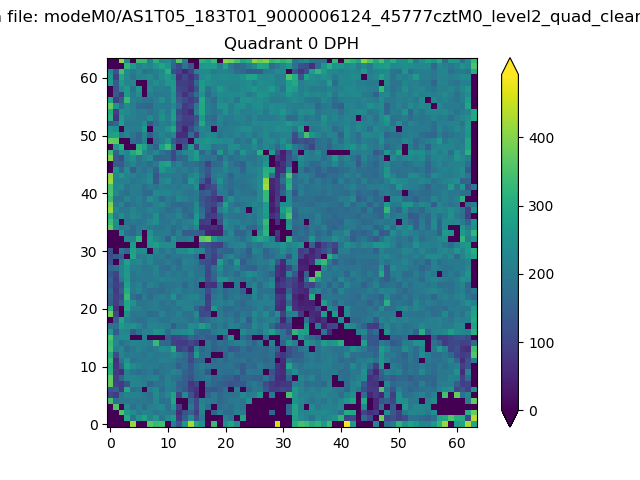 |
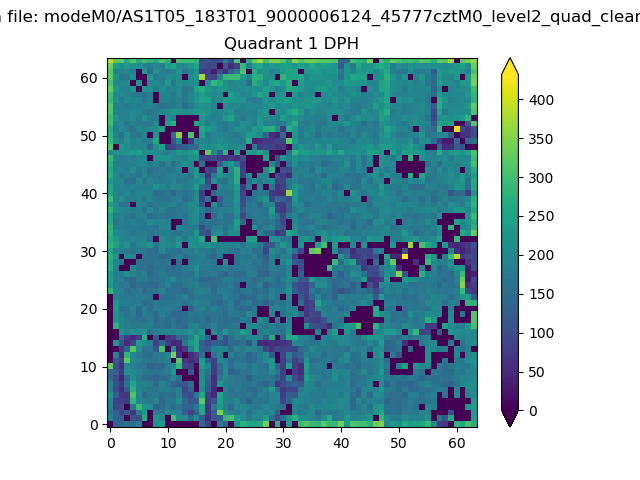 |
Quadrant B |
|---|---|---|---|
| Quadrant D | 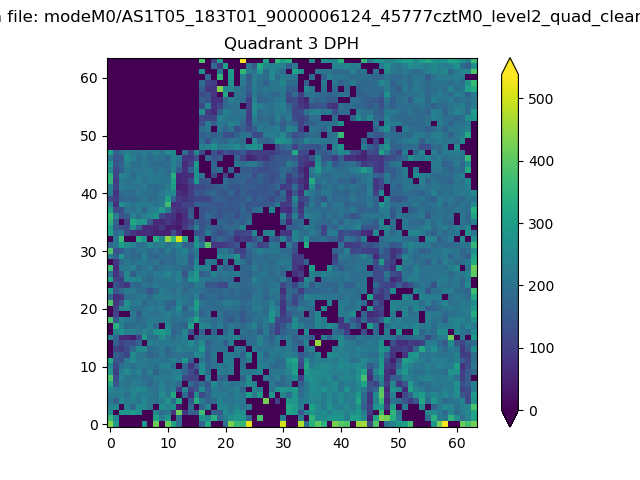 |
 |
Quadrant C |
| Plot type | Count rate plots | Images |
|---|---|---|
| Comparison with Poisson distribution Blue bars denote a histogram of data divided into 1 sec bins. Red curve is a Poisson curve with rate = median count rate of data. |
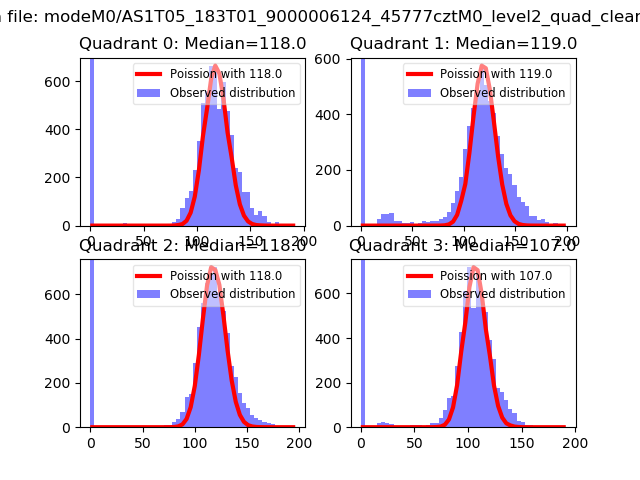 |
 |
| Quadrant-wise count rates Data is divided into 100 sec bins |
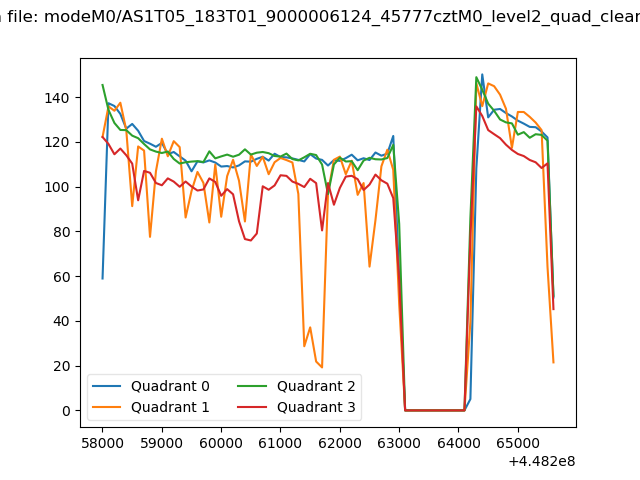 |
|
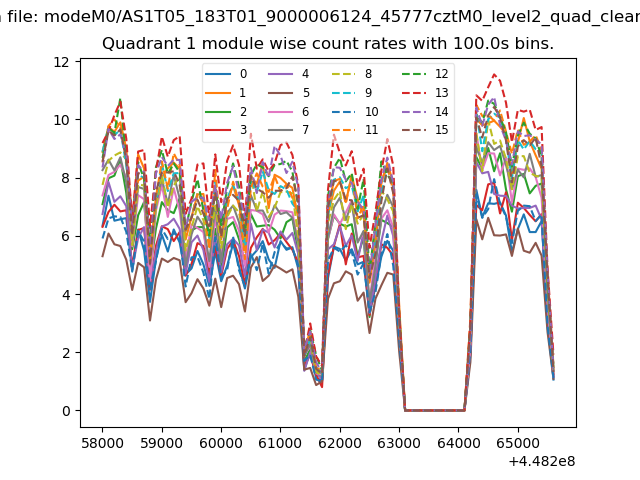
| Module-wise count rates for Quadrant A Data is divided into 100 sec bins |
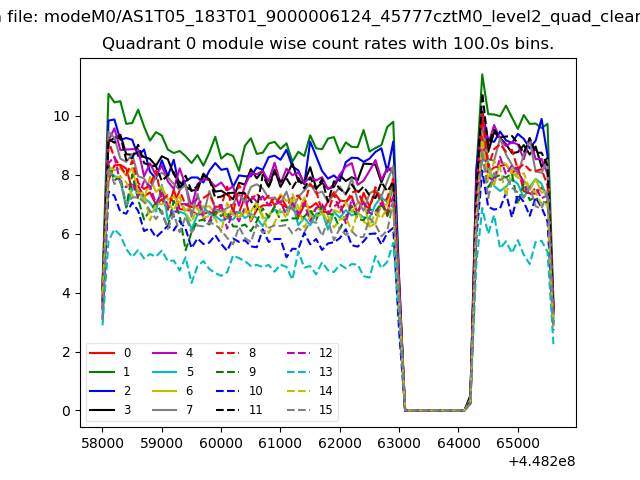 |
 |
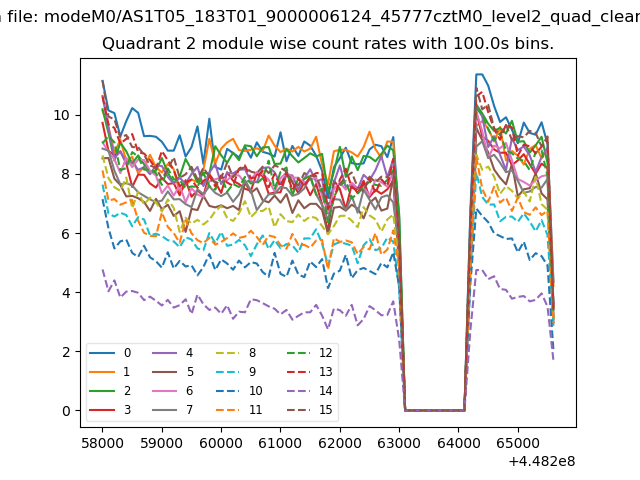
| Module-wise count rates for Quadrant B Data is divided into 100 sec bins |
 |
 |
| Module-wise count rates for Quadrant C Data is divided into 100 sec bins |
 |
 |
| Module-wise count rates for Quadrant D Data is divided into 100 sec bins |
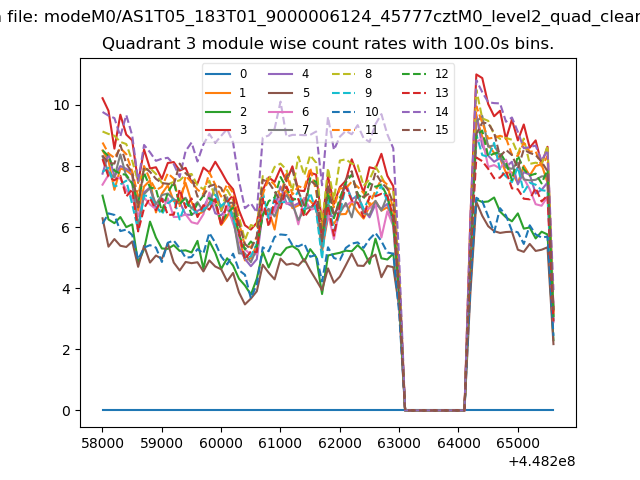 |
 |
| Parameter | Plot |
|---|---|
| CZT HV Monitor | 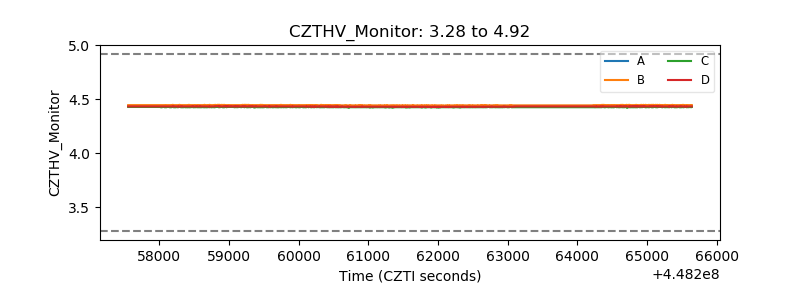 |
| D_VDD | 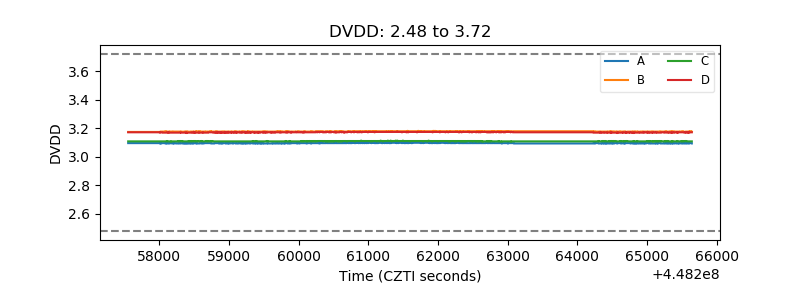 |
| Temperature 1 | 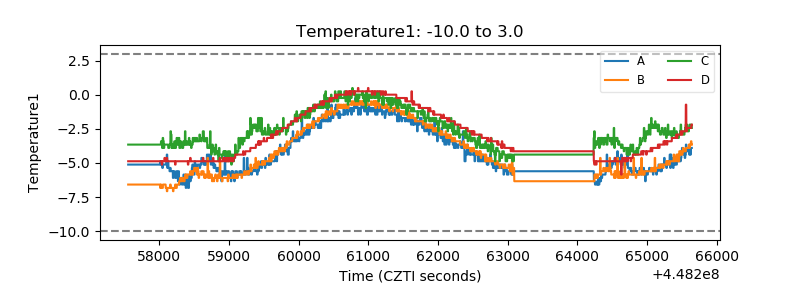 |
| Veto HV Monitor | 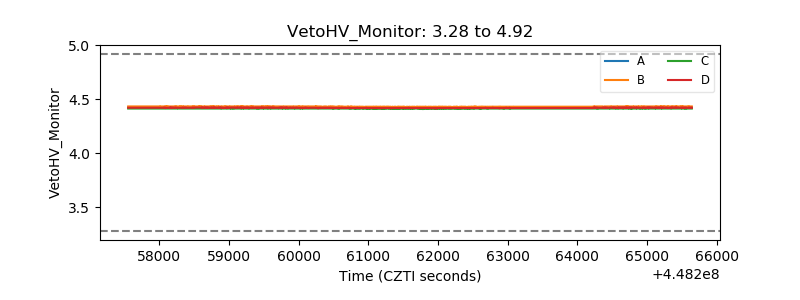 |
| Veto LLD | 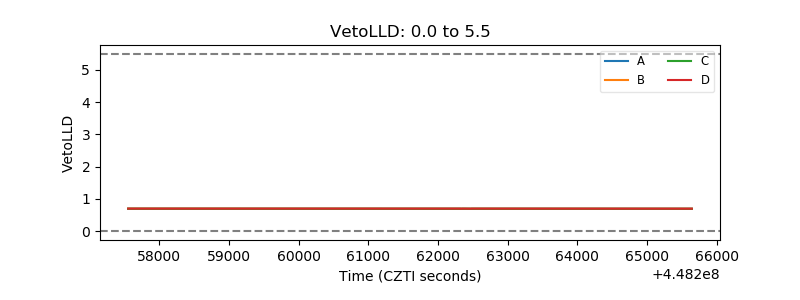 |
| Alpha Counter | 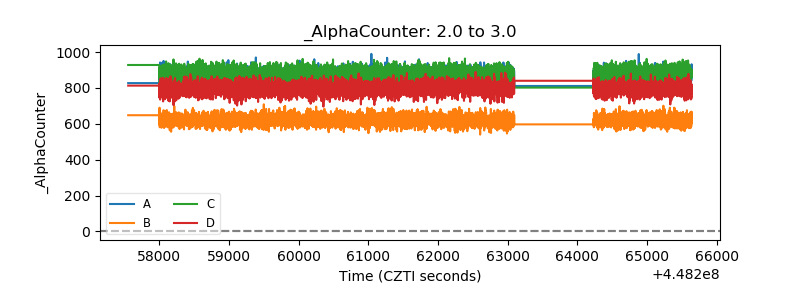 |
| _CPM_Rate | 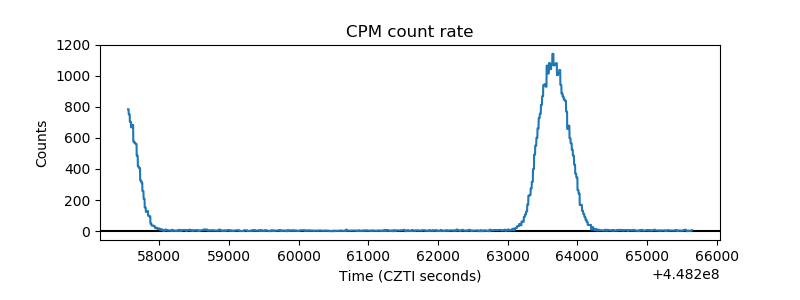 |
| CZT Counter | 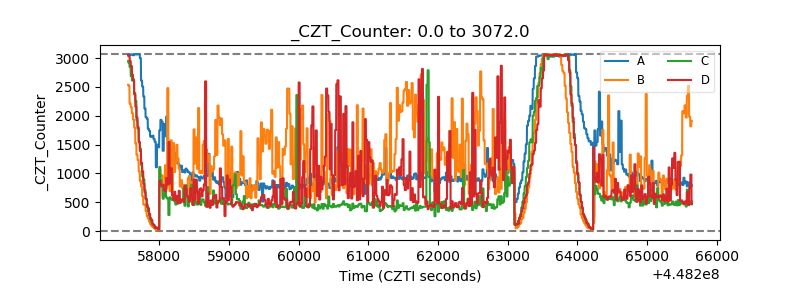 |
| +2.5 Volts monitor |  |
| +5 Volts monitor | 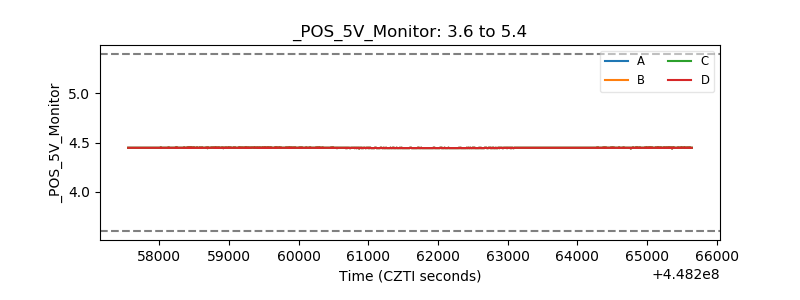 |
| _ROLL_ROT | 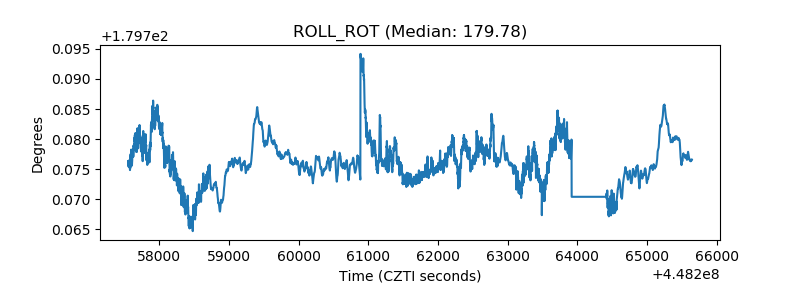 |
| _Roll_DEC | 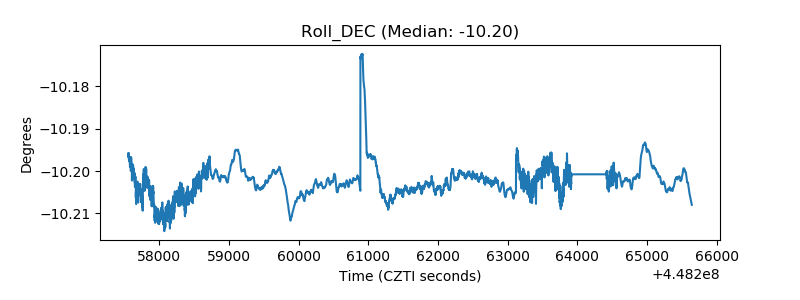 |
| _Roll_RA | 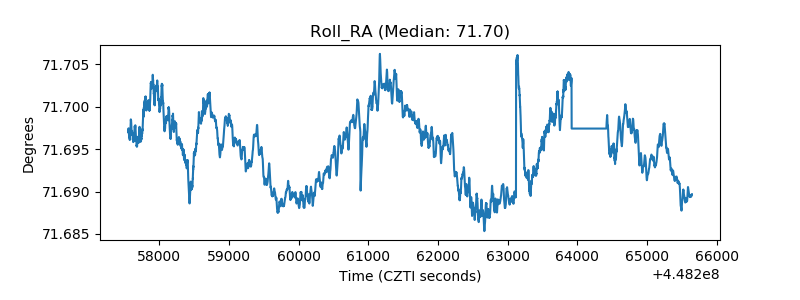 |
| Veto Counter | 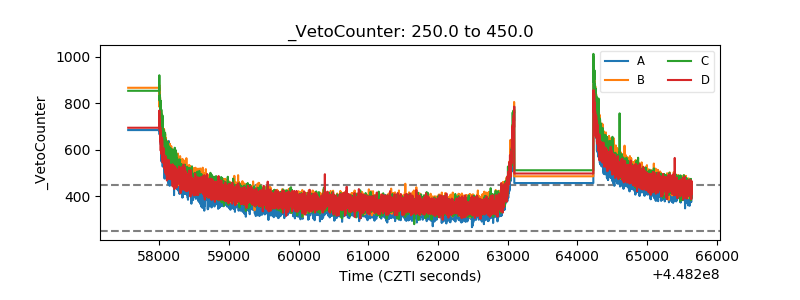 |