| Param | Original file | Final file |
|---|---|---|
| Filename | modeM0/AS1T05_183T01_9000006124_45778cztM0_level2.fits | modeM0/AS1T05_183T01_9000006124_45778cztM0_level2_quad_clean.evt |
| Size (bytes) | 618,842,880 | 108,861,120 |
| Size | 590.2 MB | 103.8 MB |
| Events in quadrant A | 6,058,466 | 750,574 |
| Events in quadrant B | 6,832,145 | 703,373 |
| Events in quadrant C | 3,549,961 | 747,800 |
| Events in quadrant D | 5,984,486 | 659,012 |
| Mode SS | |||
|---|---|---|---|
| Quadrant | BADHDUFLAG | Total packets | Discarded packets |
| A | 0 | 126 | 0 |
| B | 0 | 126 | 0 |
| C | 0 | 126 | 0 |
| D | 0 | 126 | 0 |
| Mode M0 | |||
|---|---|---|---|
| Quadrant | BADHDUFLAG | Total packets | Discarded packets |
| A | 0 | 22065 | 1 |
| B | 0 | 24834 | 1 |
| C | 0 | 14508 | 1 |
| D | 0 | 22183 | 1 |
| Mode M9 | |||
|---|---|---|---|
| Quadrant | BADHDUFLAG | Total packets | Discarded packets |
| A | 0 | 12 | 0 |
| B | 0 | 12 | 0 |
| C | 0 | 12 | 0 |
| D | 0 | 12 | 0 |
| Quadrant | Total seconds | Saturated seconds | Saturation percentage |
|---|---|---|---|
| A | 6241 | 257 | 4.117930% |
| B | 6241 | 921 | 14.757250% |
| C | 6241 | 185 | 2.964269% |
| D | 6241 | 549 | 8.796667% |
Noise dominated data is calculated using 1-second bins in cleaned event files. If a bin has >2000 counts, and if more than 50% of those come from <1% of pixels, then it is considered to be noise-dominated and hence unusable.
| Quadrant | # 1 sec bins | Bins with >0 counts | Bins with >2000 counts | High rate bins dominated by noise | Noise dominated (total time) | Noise dominated (detector-on time) | Marked lightcurve |
|---|---|---|---|---|---|---|---|
| A | 7431 | 6242 | 20 | 20 | 0.27% | 0.32% | 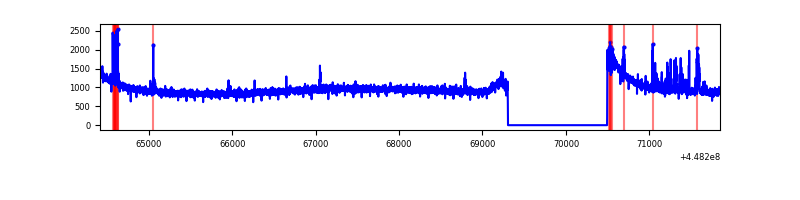 |
| B | 7431 | 6242 | 483 | 483 | 6.50% | 7.74% | 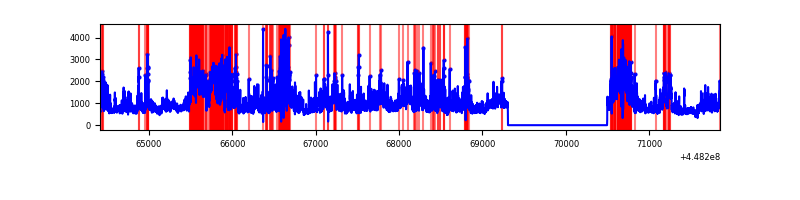 |
| C | 7431 | 6242 | 78 | 78 | 1.05% | 1.25% | 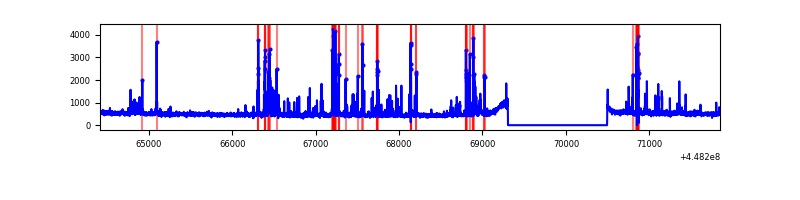 |
| D | 7431 | 6242 | 366 | 366 | 4.93% | 5.86% | 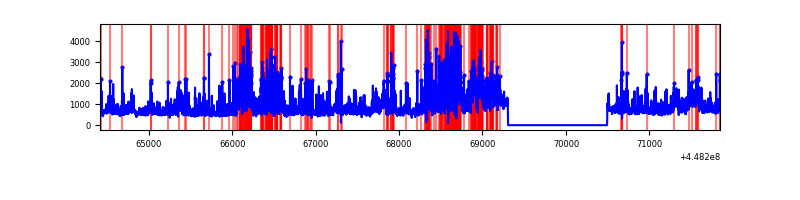 |
Top three noisy pixels from each quadrant. If the there are fewer than three noisy pixels in the level2.evt file, extra rows are filled as -1
| Pixel properties | Quadrant properties | ||||||
|---|---|---|---|---|---|---|---|
| Quadrant | DetID | PixID | Counts | Sigma | Mean | Median | Sigma |
| A | 10 | 83 | 2893247 | 17906.29 | 776 | 760 | 161.5 |
| A | 13 | 248 | 145596 | 896.62 | 776 | 760 | 161.5 |
| A | 13 | 254 | 11934 | 69.17 | 776 | 760 | 161.5 |
| B | 3 | 112 | 3209603 | 22057.94 | 744 | 722 | 145.5 |
| B | 4 | 158 | 113655 | 776.3 | 744 | 722 | 145.5 |
| B | 0 | 171 | 76536 | 521.15 | 744 | 722 | 145.5 |
| C | 14 | 254 | 471964 | 2656.11 | 758 | 764 | 177.4 |
| C | 1 | 3 | 59191 | 329.34 | 758 | 764 | 177.4 |
| C | 12 | 250 | 21496 | 116.86 | 758 | 764 | 177.4 |
| D | 11 | 241 | 887885 | 4764.81 | 747 | 724 | 186.2 |
| D | 1 | 52 | 802804 | 4307.85 | 747 | 724 | 186.2 |
| D | 2 | 249 | 510277 | 2736.73 | 747 | 724 | 186.2 |
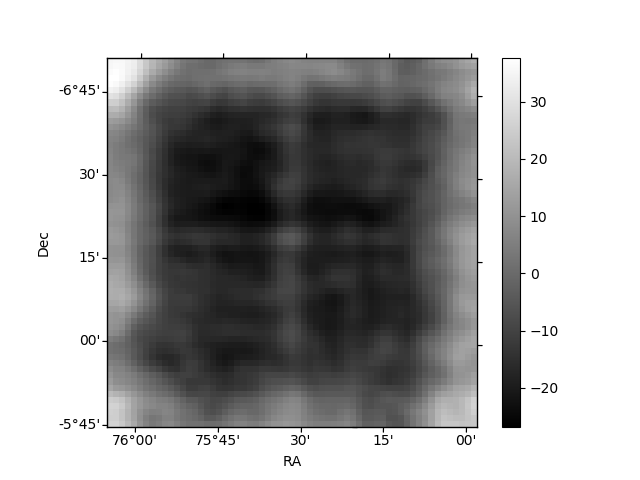
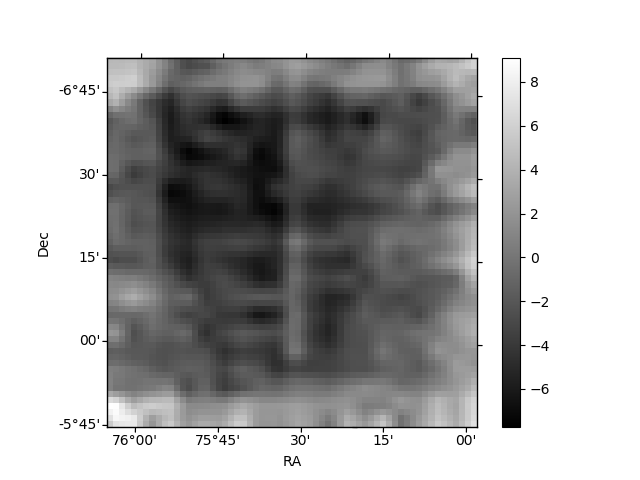
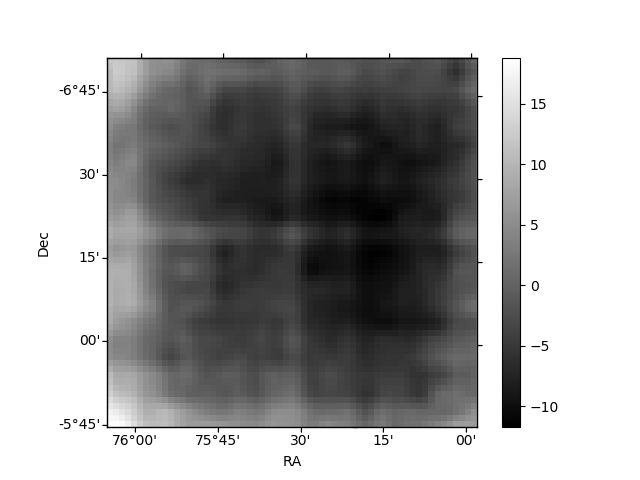
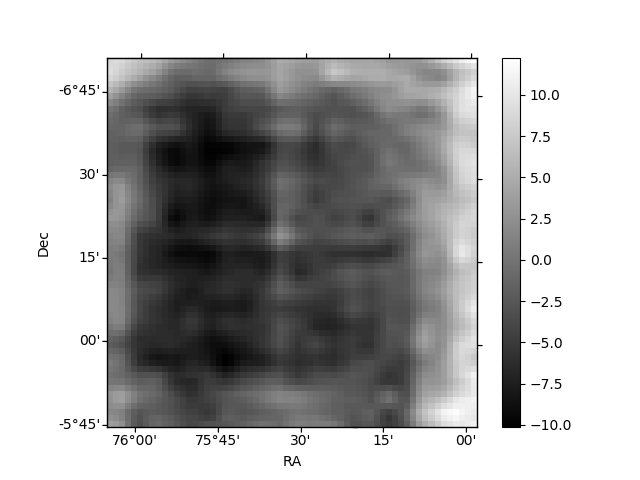
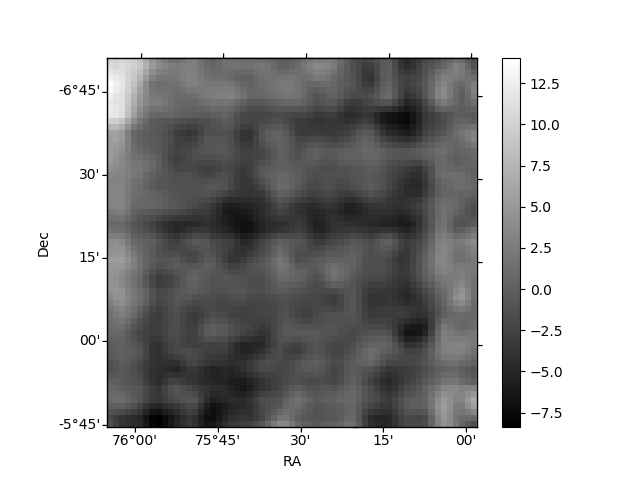
Histogram calculated using DETX and DETY for each event in the final _common_clean file
| Quadrant A | 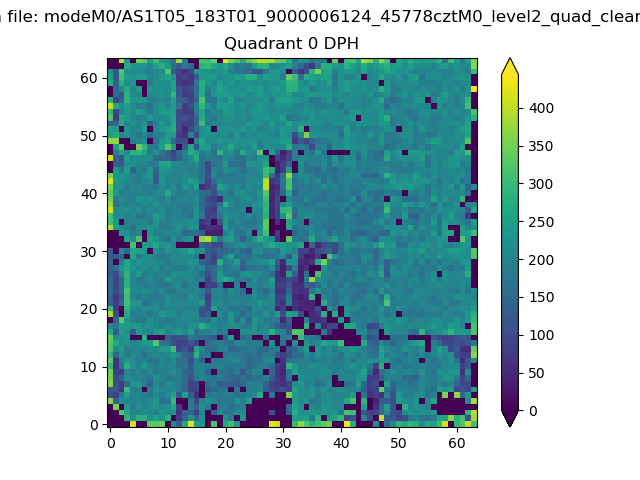 |
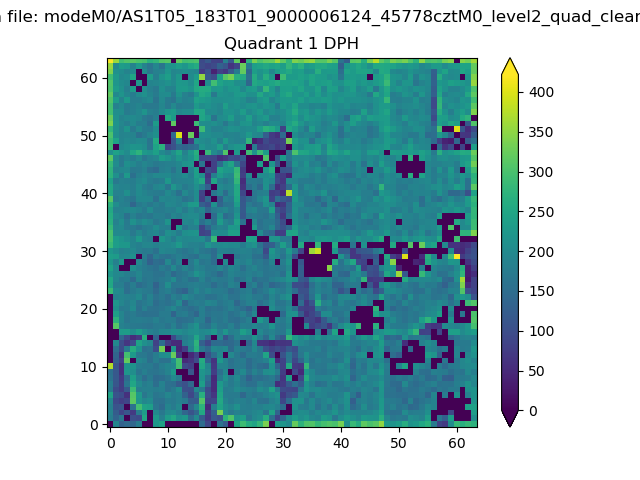 |
Quadrant B |
|---|---|---|---|
| Quadrant D | 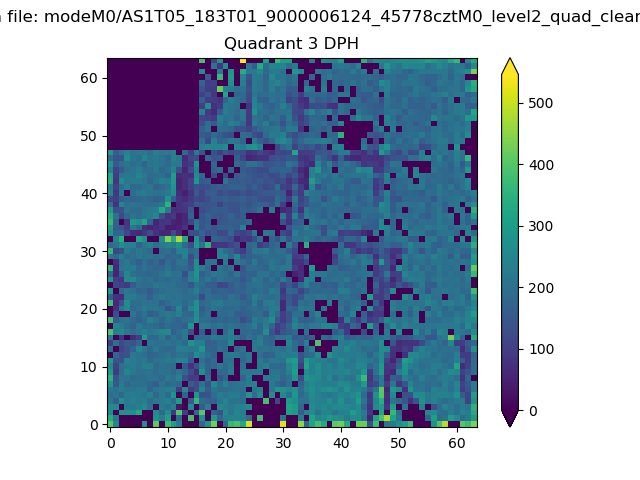 |
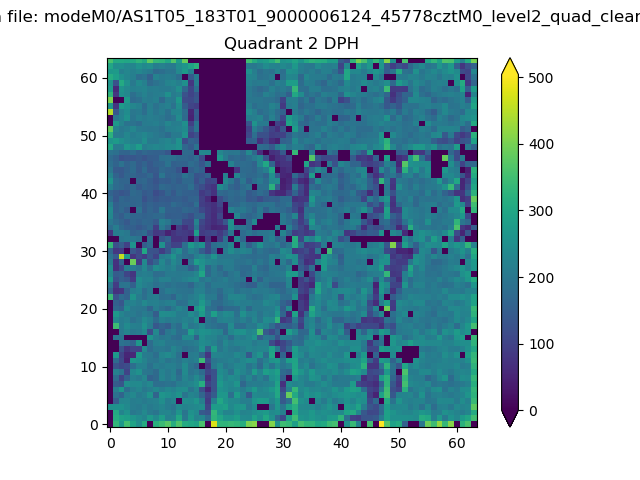 |
Quadrant C |
| Plot type | Count rate plots | Images |
|---|---|---|
| Comparison with Poisson distribution Blue bars denote a histogram of data divided into 1 sec bins. Red curve is a Poisson curve with rate = median count rate of data. |
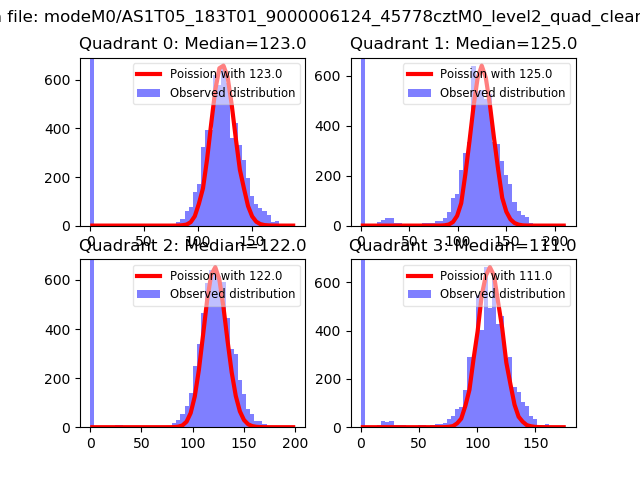 |
 |
| Quadrant-wise count rates Data is divided into 100 sec bins |
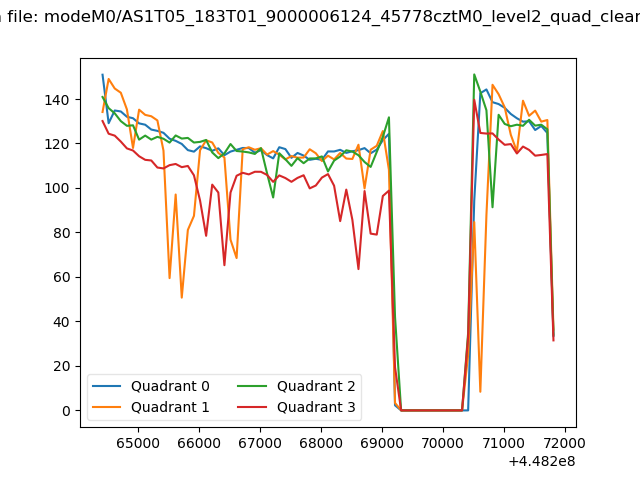 |
|
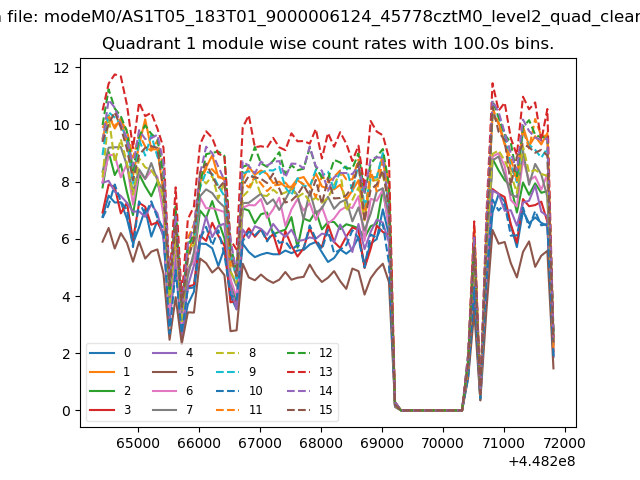
| Module-wise count rates for Quadrant A Data is divided into 100 sec bins |
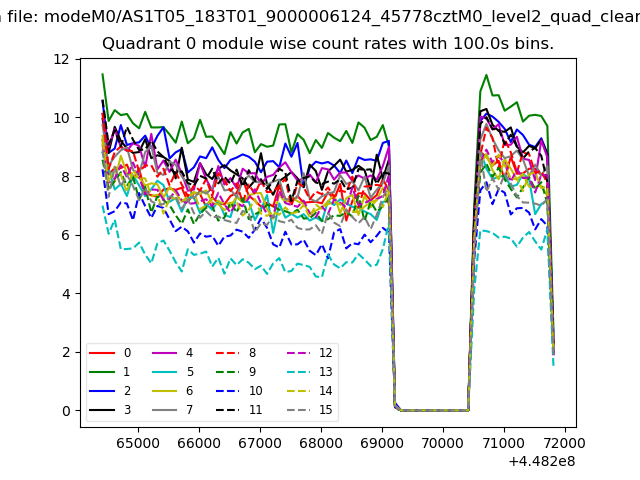 |
 |
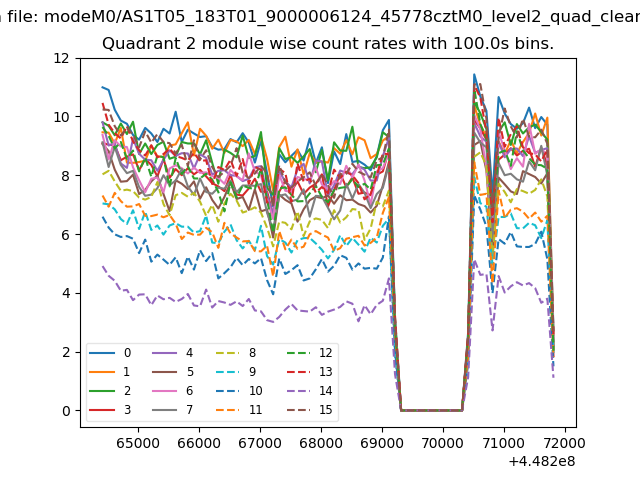
| Module-wise count rates for Quadrant B Data is divided into 100 sec bins |
 |
 |
| Module-wise count rates for Quadrant C Data is divided into 100 sec bins |
 |
 |
| Module-wise count rates for Quadrant D Data is divided into 100 sec bins |
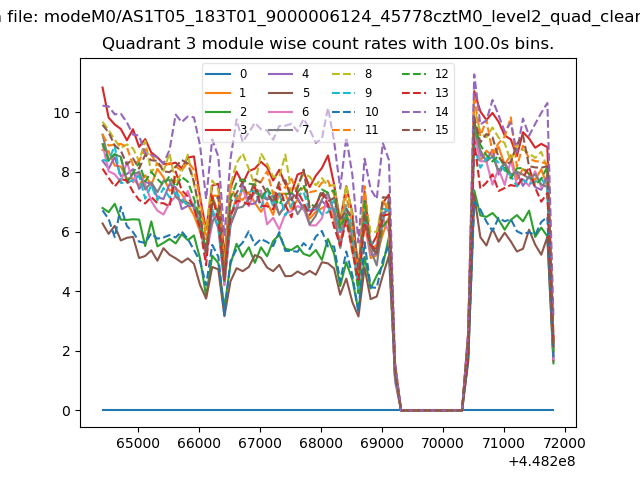 |
 |
| Parameter | Plot |
|---|---|
| CZT HV Monitor | 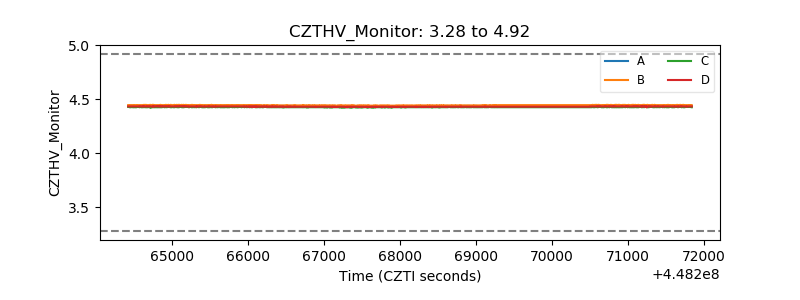 |
| D_VDD | 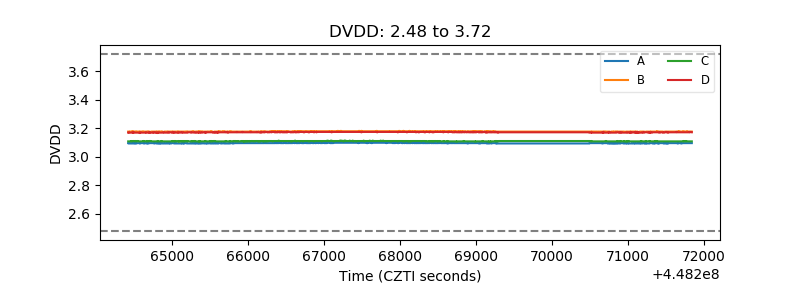 |
| Temperature 1 | 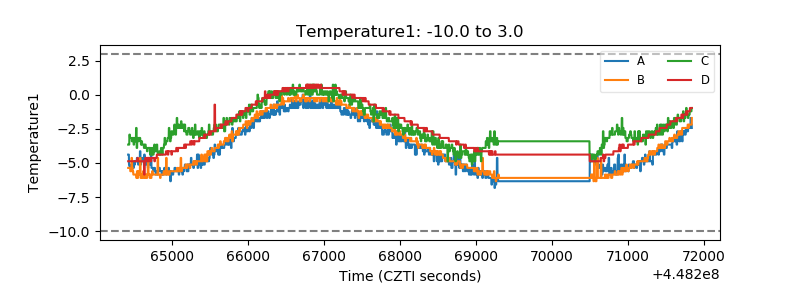 |
| Veto HV Monitor | 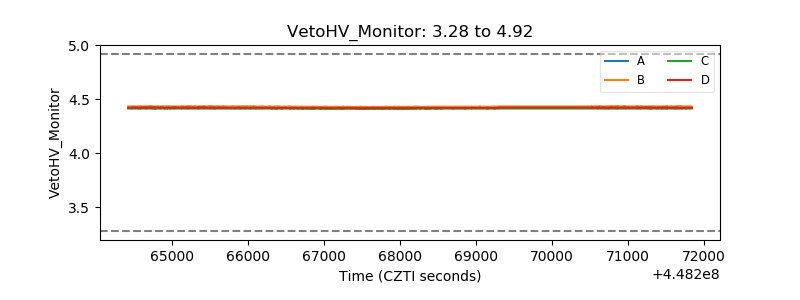 |
| Veto LLD | 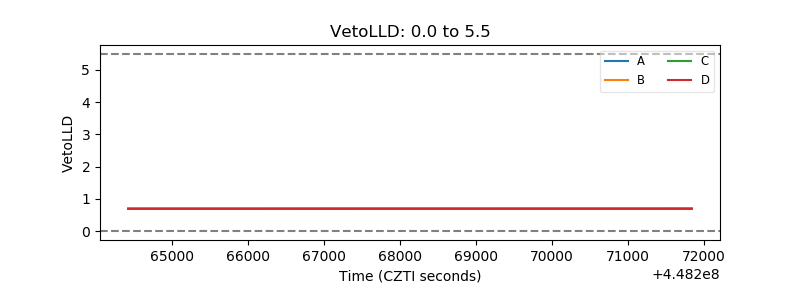 |
| Alpha Counter | 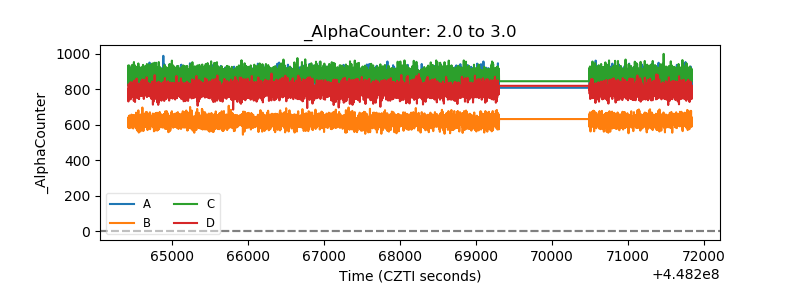 |
| _CPM_Rate | 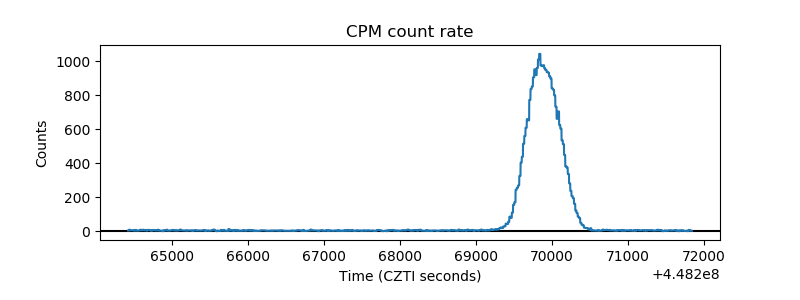 |
| CZT Counter | 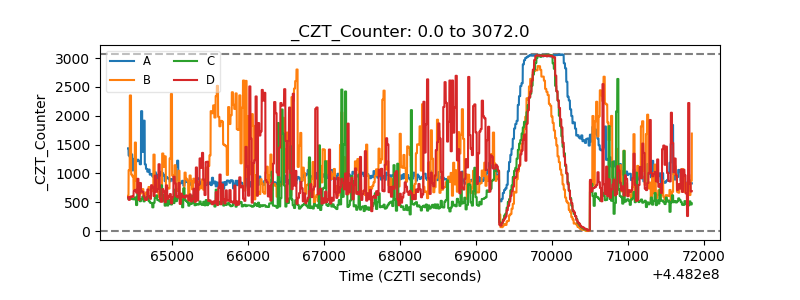 |
| +2.5 Volts monitor |  |
| +5 Volts monitor | 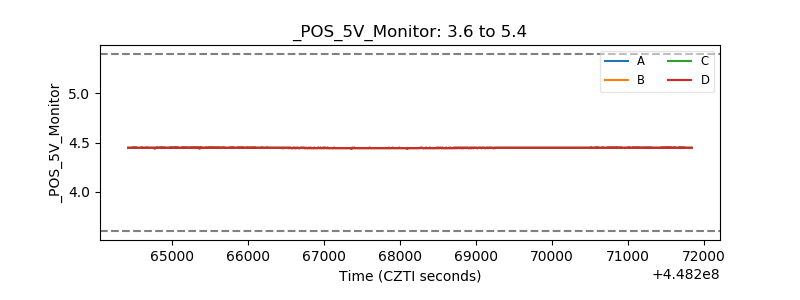 |
| _ROLL_ROT | 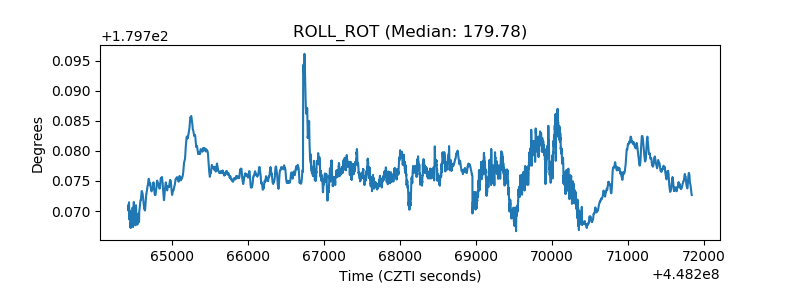 |
| _Roll_DEC | 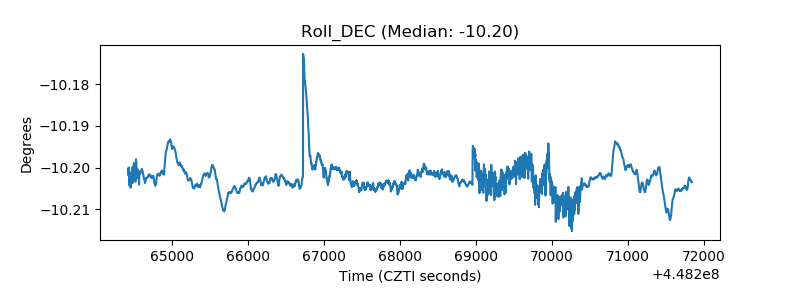 |
| _Roll_RA | 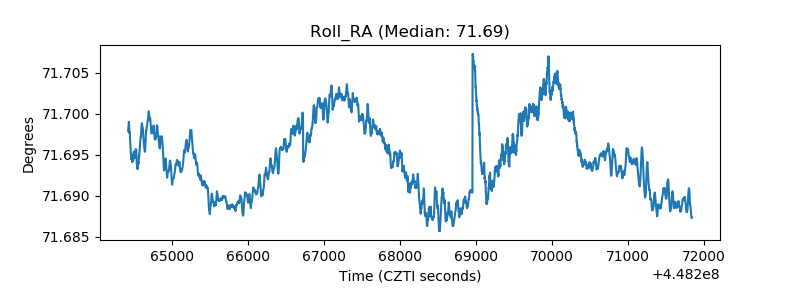 |
| Veto Counter | 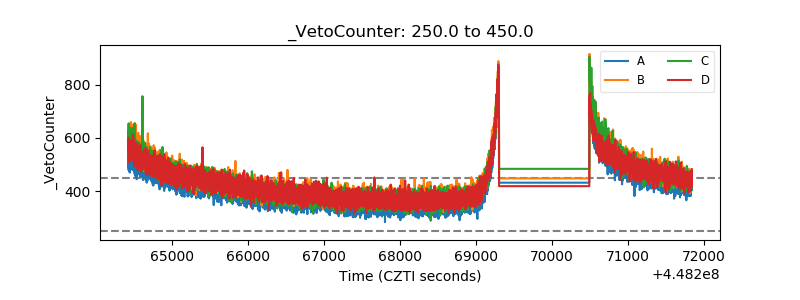 |