| Param | Original file | Final file |
|---|---|---|
| Filename | modeM0/AS1T05_183T01_9000006124_45781cztM0_level2.fits | modeM0/AS1T05_183T01_9000006124_45781cztM0_level2_quad_clean.evt |
| Size (bytes) | 751,806,720 | 100,272,960 |
| Size | 717.0 MB | 95.6 MB |
| Events in quadrant A | 6,019,112 | 696,876 |
| Events in quadrant B | 6,658,693 | 674,112 |
| Events in quadrant C | 3,236,164 | 717,979 |
| Events in quadrant D | 11,419,982 | 498,708 |
| Mode SS | |||
|---|---|---|---|
| Quadrant | BADHDUFLAG | Total packets | Discarded packets |
| A | 0 | 130 | 0 |
| B | 0 | 130 | 0 |
| C | 0 | 130 | 0 |
| D | 0 | 130 | 0 |
| Mode M0 | |||
|---|---|---|---|
| Quadrant | BADHDUFLAG | Total packets | Discarded packets |
| A | 0 | 22024 | 1 |
| B | 0 | 24443 | 3 |
| C | 0 | 14200 | 1 |
| D | 0 | 38325 | 1 |
| Mode M9 | |||
|---|---|---|---|
| Quadrant | BADHDUFLAG | Total packets | Discarded packets |
| A | 0 | 8 | 0 |
| B | 0 | 8 | 0 |
| C | 0 | 8 | 0 |
| D | 0 | 8 | 0 |
| Quadrant | Total seconds | Saturated seconds | Saturation percentage |
|---|---|---|---|
| A | 6423 | 285 | 4.437179% |
| B | 6423 | 775 | 12.066013% |
| C | 6423 | 87 | 1.354507% |
| D | 6423 | 2084 | 32.445898% |
Noise dominated data is calculated using 1-second bins in cleaned event files. If a bin has >2000 counts, and if more than 50% of those come from <1% of pixels, then it is considered to be noise-dominated and hence unusable.
| Quadrant | # 1 sec bins | Bins with >0 counts | Bins with >2000 counts | High rate bins dominated by noise | Noise dominated (total time) | Noise dominated (detector-on time) | Marked lightcurve |
|---|---|---|---|---|---|---|---|
| A | 7233 | 6424 | 26 | 26 | 0.36% | 0.40% | 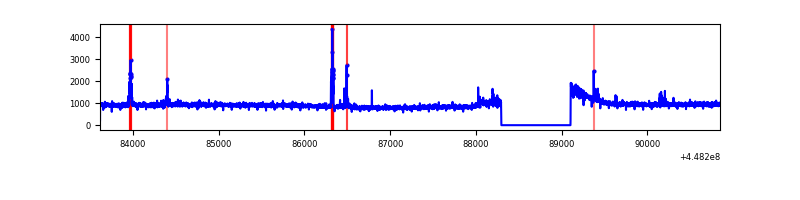 |
| B | 7233 | 6424 | 425 | 425 | 5.88% | 6.62% | 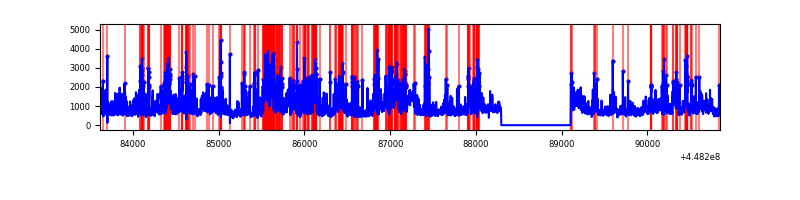 |
| C | 7233 | 6424 | 35 | 35 | 0.48% | 0.54% | 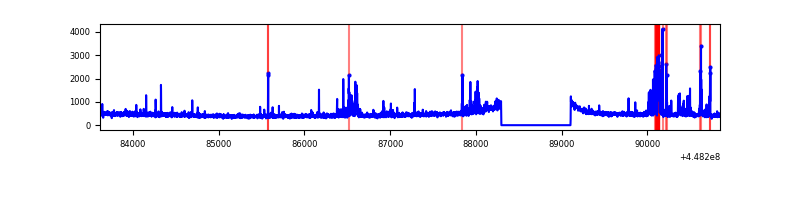 |
| D | 7233 | 6424 | 2219 | 2219 | 30.68% | 34.54% | 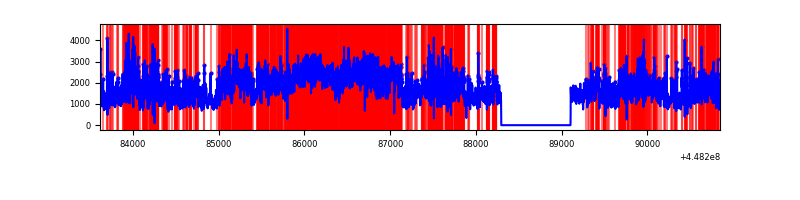 |
Top three noisy pixels from each quadrant. If the there are fewer than three noisy pixels in the level2.evt file, extra rows are filled as -1
| Pixel properties | Quadrant properties | ||||||
|---|---|---|---|---|---|---|---|
| Quadrant | DetID | PixID | Counts | Sigma | Mean | Median | Sigma |
| A | 10 | 83 | 2963548 | 18973.89 | 744 | 726 | 156.2 |
| A | 13 | 248 | 132585 | 844.42 | 744 | 726 | 156.2 |
| A | 14 | 235 | 23457 | 145.57 | 744 | 726 | 156.2 |
| B | 3 | 112 | 1934878 | 13769.7 | 720 | 700 | 140.5 |
| B | 4 | 171 | 352934 | 2507.61 | 720 | 700 | 140.5 |
| B | 15 | 201 | 337611 | 2398.52 | 720 | 700 | 140.5 |
| C | 14 | 96 | 182433 | 1050.35 | 734 | 739 | 173.0 |
| C | 1 | 3 | 94298 | 540.85 | 734 | 739 | 173.0 |
| C | 2 | 14 | 38901 | 220.61 | 734 | 739 | 173.0 |
| D | 11 | 241 | 6631118 | 37804.57 | 676 | 654 | 175.4 |
| D | 2 | 249 | 773896 | 4408.75 | 676 | 654 | 175.4 |
| D | 1 | 52 | 324537 | 1846.67 | 676 | 654 | 175.4 |
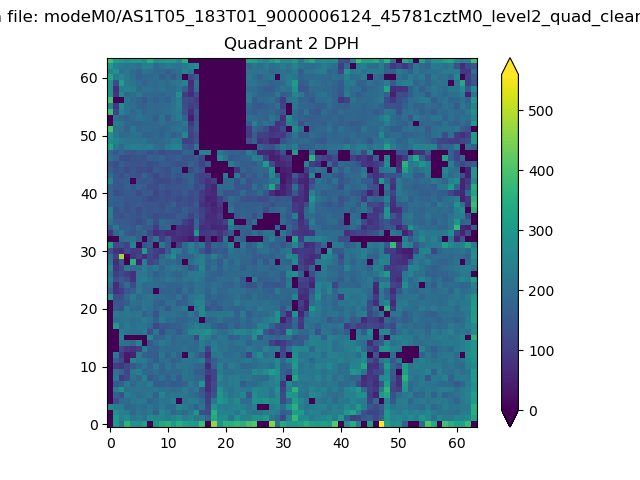
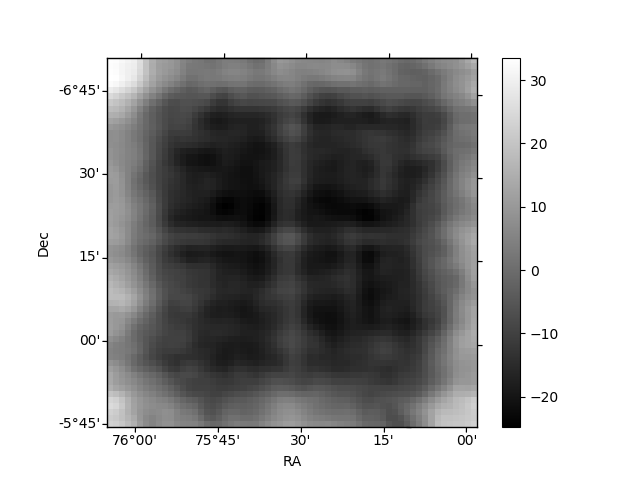
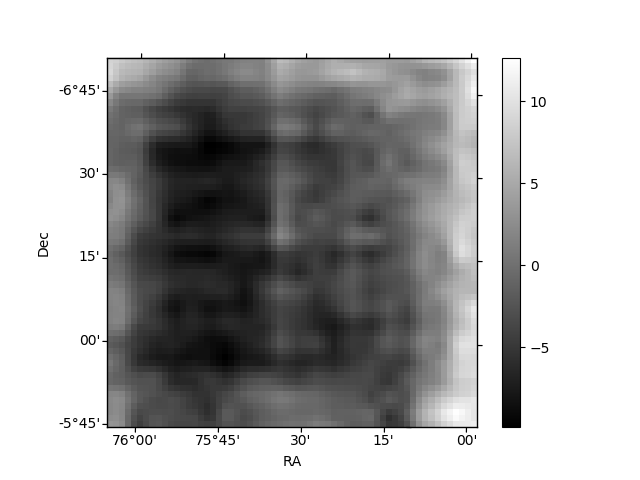
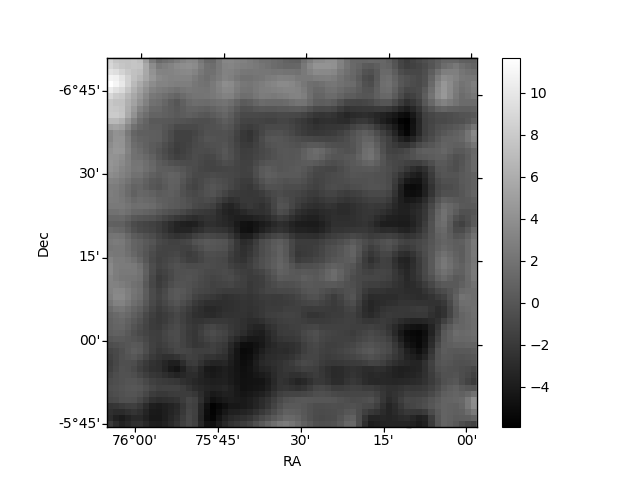
Histogram calculated using DETX and DETY for each event in the final _common_clean file
| Quadrant A | 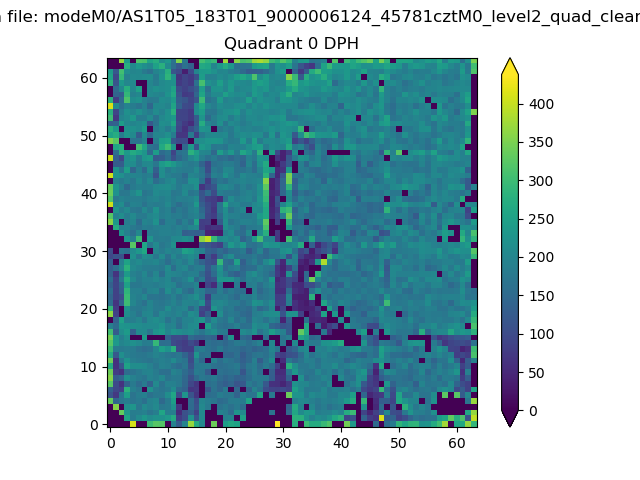 |
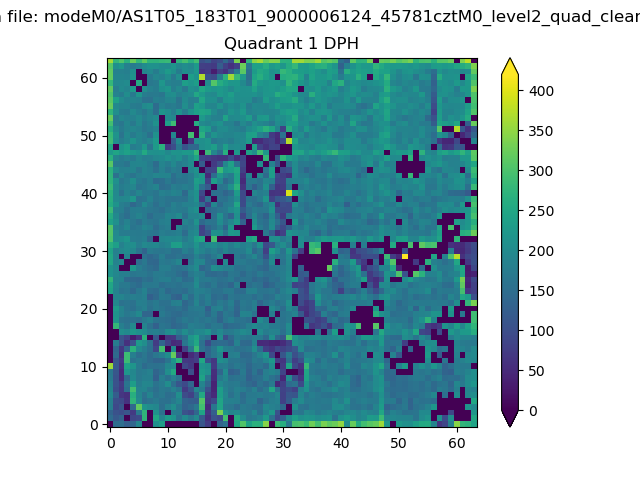 |
Quadrant B |
|---|---|---|---|
| Quadrant D | 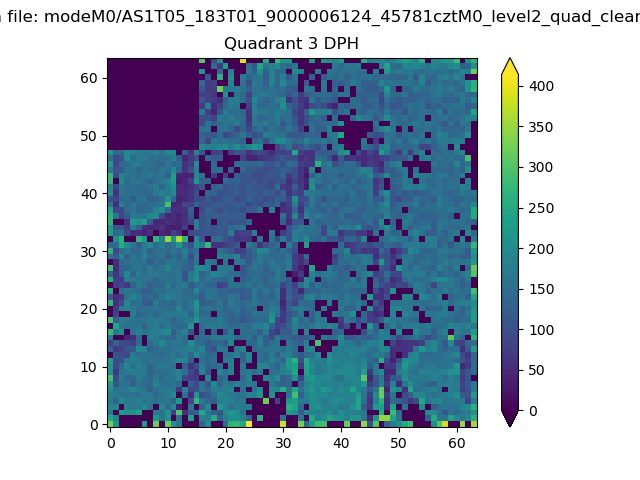 |
 |
Quadrant C |
| Plot type | Count rate plots | Images |
|---|---|---|
| Comparison with Poisson distribution Blue bars denote a histogram of data divided into 1 sec bins. Red curve is a Poisson curve with rate = median count rate of data. |
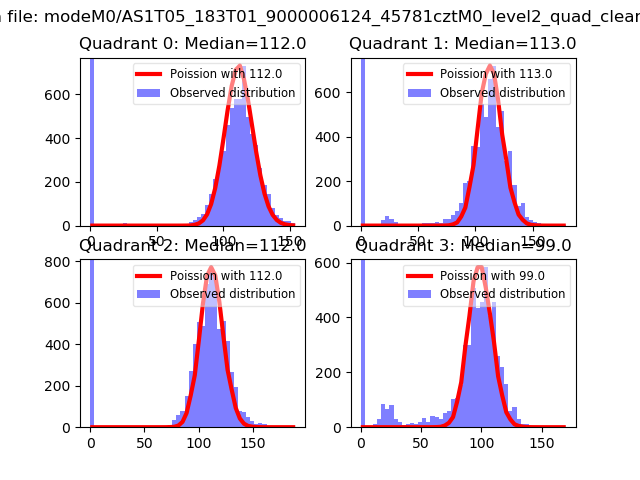 |
 |
| Quadrant-wise count rates Data is divided into 100 sec bins |
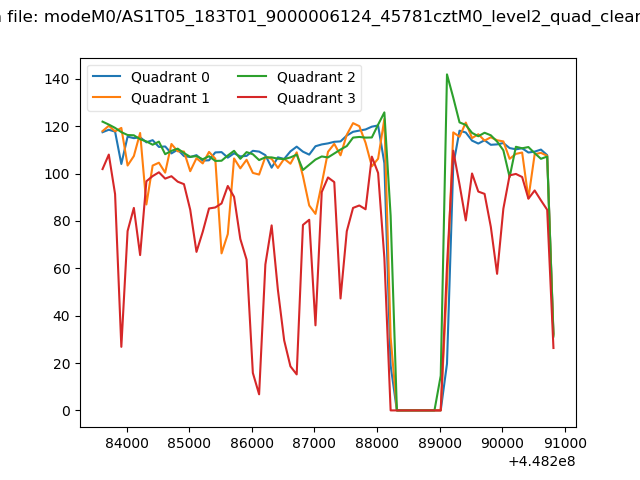 |
|
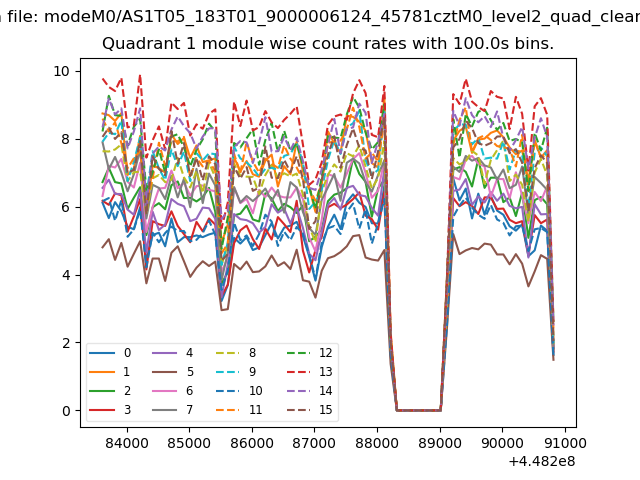
| Module-wise count rates for Quadrant A Data is divided into 100 sec bins |
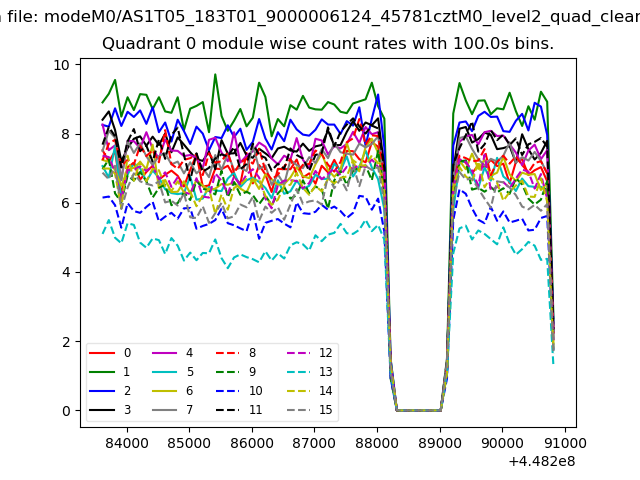 |
 |
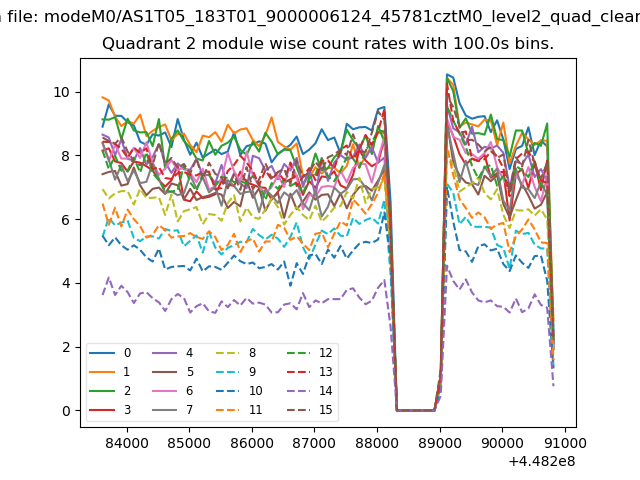
| Module-wise count rates for Quadrant B Data is divided into 100 sec bins |
 |
 |
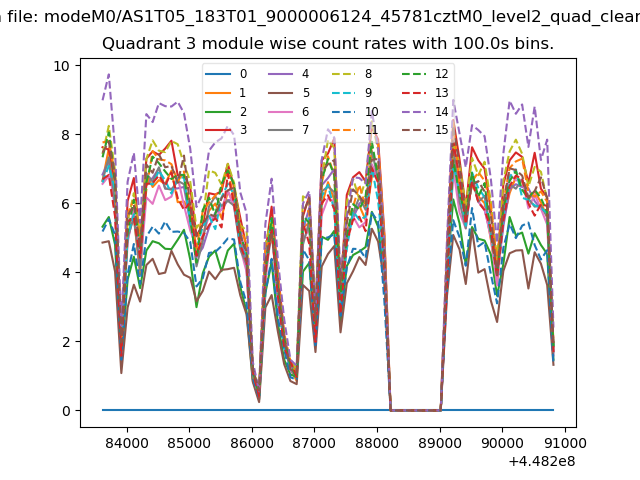
| Module-wise count rates for Quadrant C Data is divided into 100 sec bins |
 |
 |
| Module-wise count rates for Quadrant D Data is divided into 100 sec bins |
 |
 |
| Parameter | Plot |
|---|---|
| CZT HV Monitor | 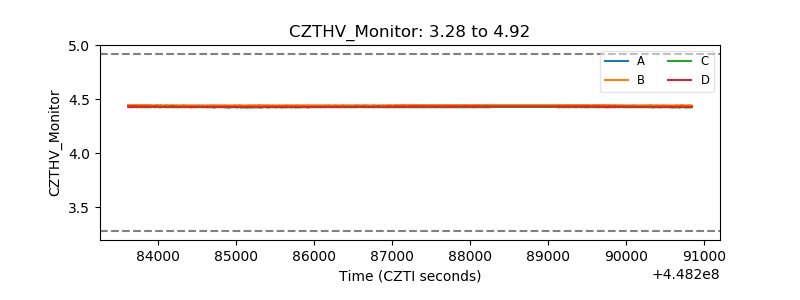 |
| D_VDD | 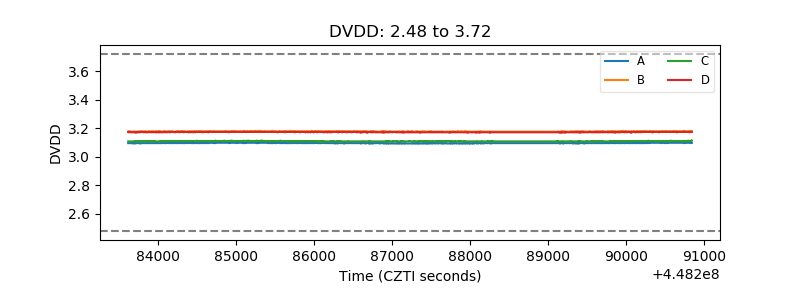 |
| Temperature 1 | 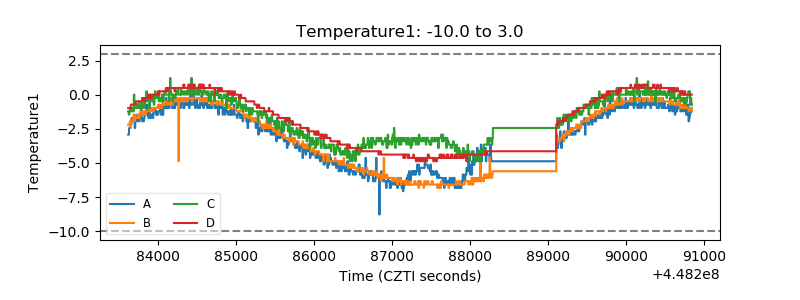 |
| Veto HV Monitor | 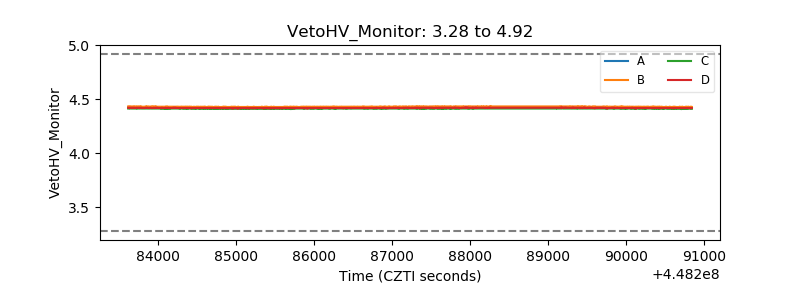 |
| Veto LLD | 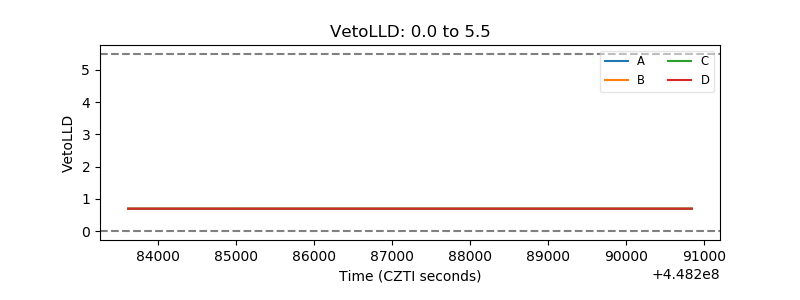 |
| Alpha Counter | 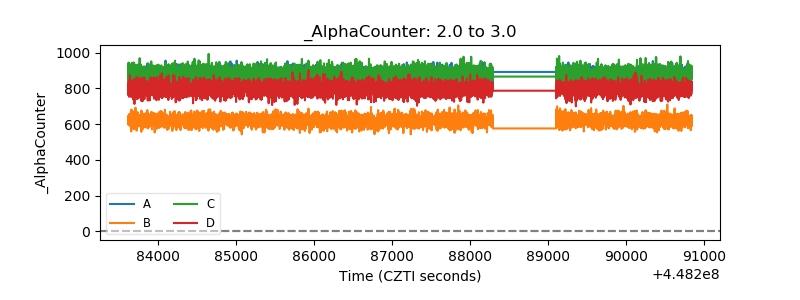 |
| _CPM_Rate | 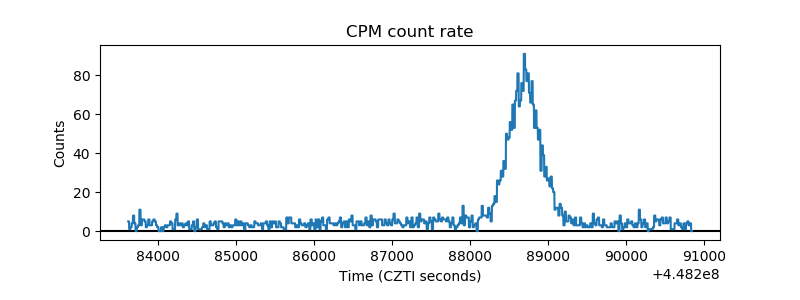 |
| CZT Counter | 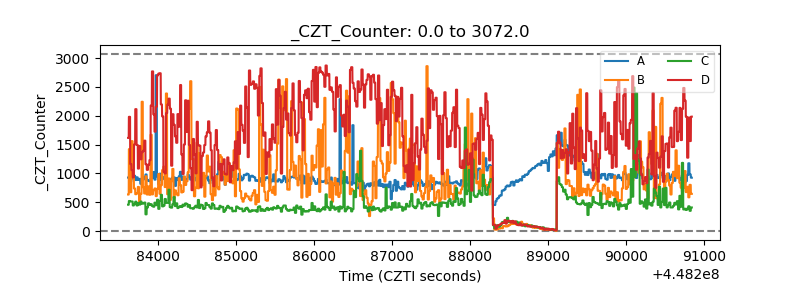 |
| +2.5 Volts monitor | 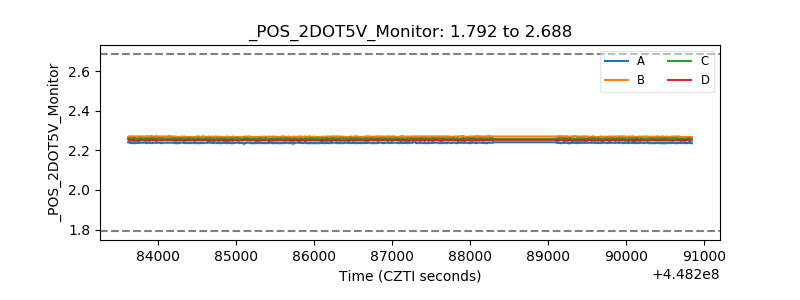 |
| +5 Volts monitor | 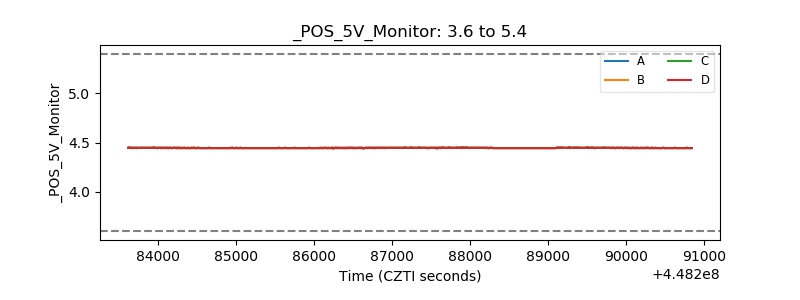 |
| _ROLL_ROT | 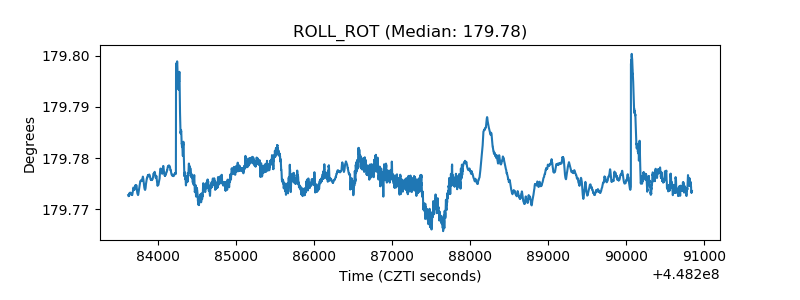 |
| _Roll_DEC | 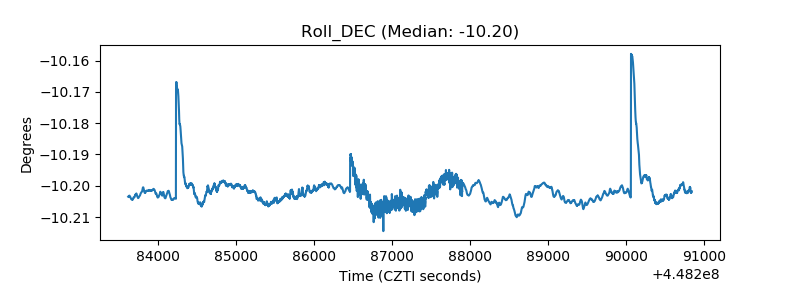 |
| _Roll_RA | 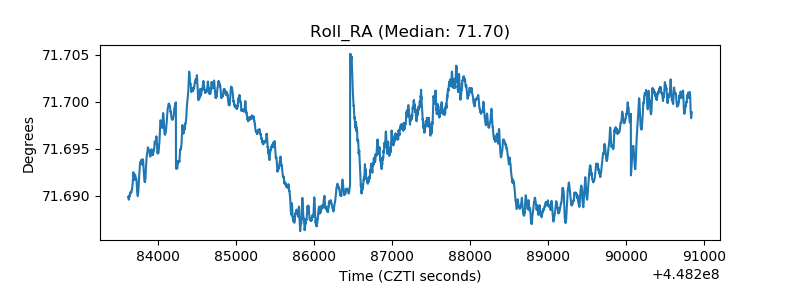 |
| Veto Counter | 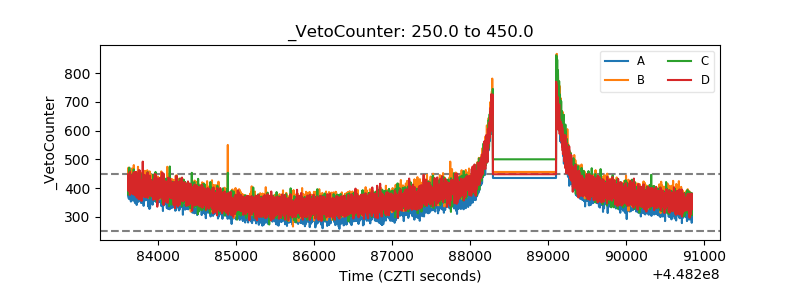 |