| Param | Original file | Final file |
|---|---|---|
| Filename | modeM0/AS1T05_183T01_9000006124_45782cztM0_level2.fits | modeM0/AS1T05_183T01_9000006124_45782cztM0_level2_quad_clean.evt |
| Size (bytes) | 864,187,200 | 99,089,280 |
| Size | 824.2 MB | 94.5 MB |
| Events in quadrant A | 6,630,757 | 707,031 |
| Events in quadrant B | 7,387,405 | 695,733 |
| Events in quadrant C | 4,046,536 | 726,459 |
| Events in quadrant D | 13,400,778 | 396,911 |
| Mode SS | |||
|---|---|---|---|
| Quadrant | BADHDUFLAG | Total packets | Discarded packets |
| A | 0 | 138 | 0 |
| B | 0 | 138 | 0 |
| C | 0 | 138 | 0 |
| D | 0 | 138 | 0 |
| Mode M0 | |||
|---|---|---|---|
| Quadrant | BADHDUFLAG | Total packets | Discarded packets |
| A | 0 | 24400 | 1 |
| B | 0 | 26762 | 5 |
| C | 0 | 16916 | 1 |
| D | 0 | 44482 | 1 |
| Mode M9 | |||
|---|---|---|---|
| Quadrant | BADHDUFLAG | Total packets | Discarded packets |
| A | 0 | 4 | 0 |
| B | 0 | 4 | 0 |
| C | 0 | 4 | 0 |
| D | 0 | 4 | 0 |
| Quadrant | Total seconds | Saturated seconds | Saturation percentage |
|---|---|---|---|
| A | 6794 | 435 | 6.402708% |
| B | 6793 | 856 | 12.601207% |
| C | 6794 | 269 | 3.959376% |
| D | 6794 | 3337 | 49.116868% |
Noise dominated data is calculated using 1-second bins in cleaned event files. If a bin has >2000 counts, and if more than 50% of those come from <1% of pixels, then it is considered to be noise-dominated and hence unusable.
| Quadrant | # 1 sec bins | Bins with >0 counts | Bins with >2000 counts | High rate bins dominated by noise | Noise dominated (total time) | Noise dominated (detector-on time) | Marked lightcurve |
|---|---|---|---|---|---|---|---|
| A | 7154 | 6795 | 112 | 112 | 1.57% | 1.65% | 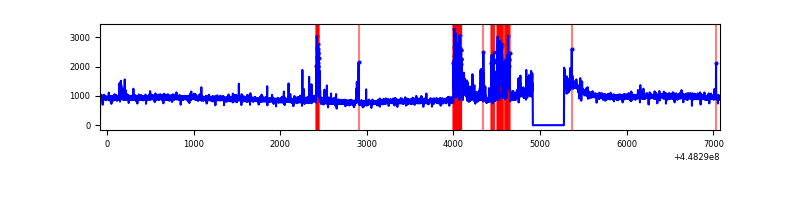 |
| B | 7153 | 6794 | 546 | 546 | 7.63% | 8.04% | 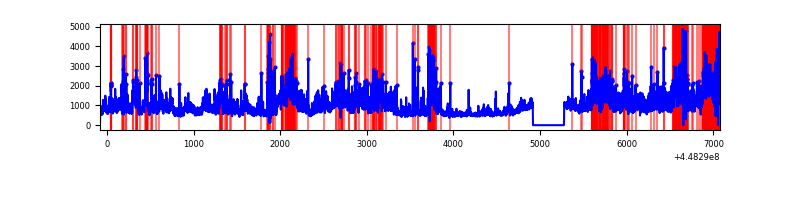 |
| C | 7154 | 6795 | 255 | 255 | 3.56% | 3.75% | 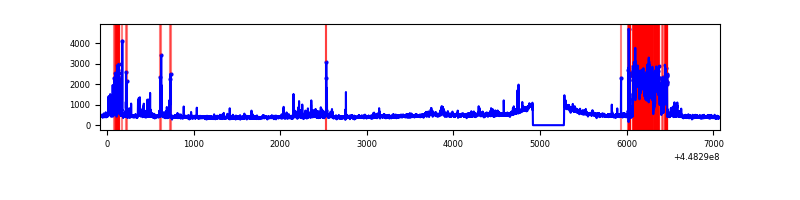 |
| D | 7154 | 6795 | 3179 | 3179 | 44.44% | 46.78% | 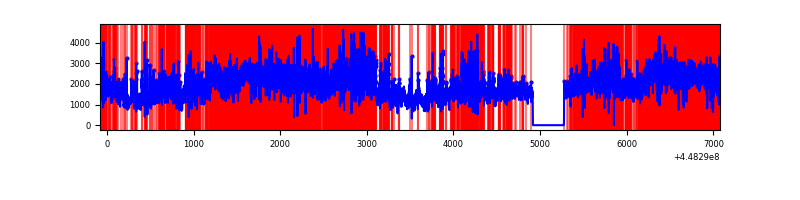 |
Top three noisy pixels from each quadrant. If the there are fewer than three noisy pixels in the level2.evt file, extra rows are filled as -1
| Pixel properties | Quadrant properties | ||||||
|---|---|---|---|---|---|---|---|
| Quadrant | DetID | PixID | Counts | Sigma | Mean | Median | Sigma |
| A | 10 | 83 | 3086169 | 18879.18 | 777 | 761 | 163.4 |
| A | 13 | 248 | 405081 | 2473.97 | 777 | 761 | 163.4 |
| A | 14 | 235 | 81005 | 491.0 | 777 | 761 | 163.4 |
| B | 3 | 112 | 2882023 | 19302.14 | 757 | 735 | 149.3 |
| B | 5 | 172 | 516544 | 3455.47 | 757 | 735 | 149.3 |
| B | 4 | 171 | 318443 | 2128.37 | 757 | 735 | 149.3 |
| C | 12 | 2 | 725829 | 3973.37 | 766 | 772 | 182.5 |
| C | 14 | 96 | 189315 | 1033.23 | 766 | 772 | 182.5 |
| C | 1 | 3 | 62392 | 337.68 | 766 | 772 | 182.5 |
| D | 11 | 241 | 7221410 | 42866.95 | 653 | 631 | 168.4 |
| D | 1 | 52 | 1067845 | 6335.63 | 653 | 631 | 168.4 |
| D | 8 | 48 | 941017 | 5582.7 | 653 | 631 | 168.4 |
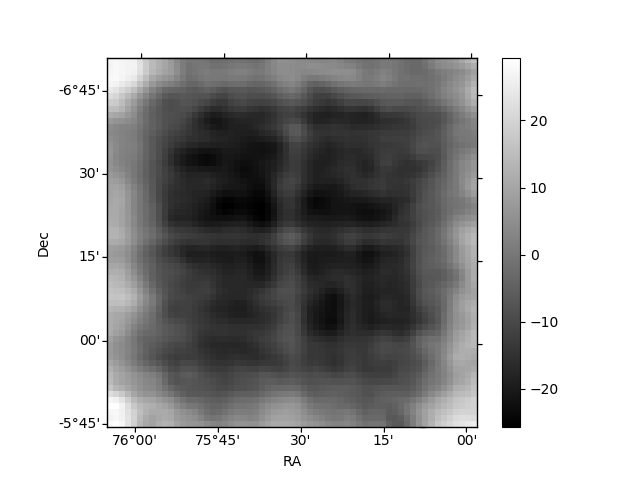
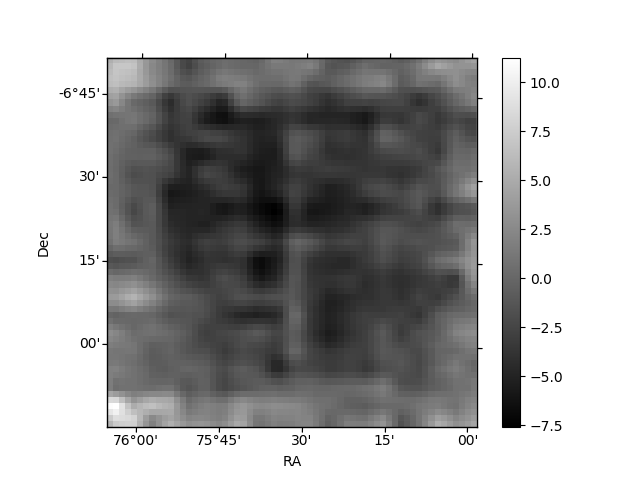
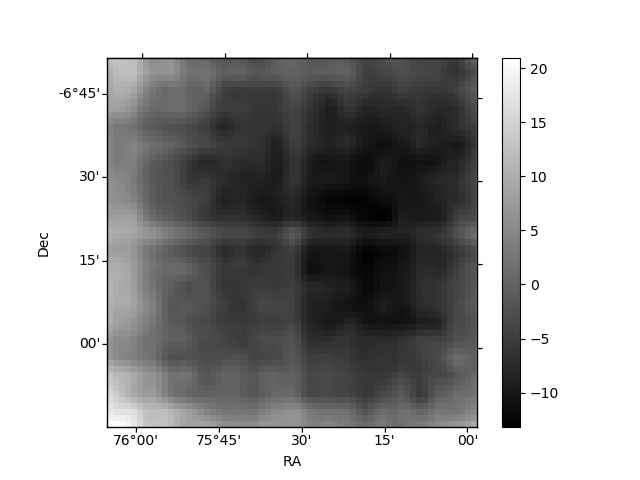
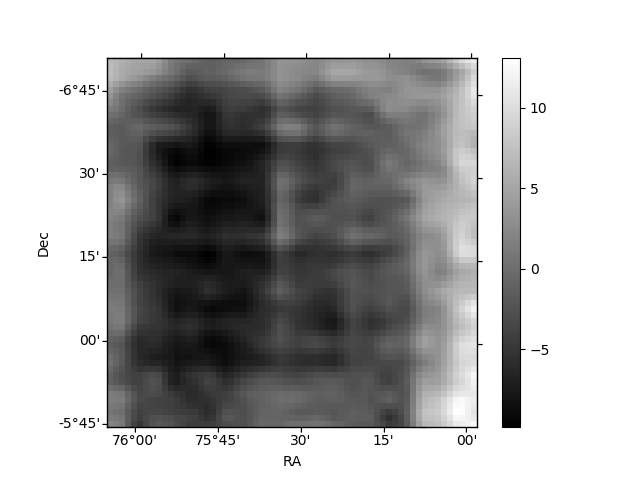
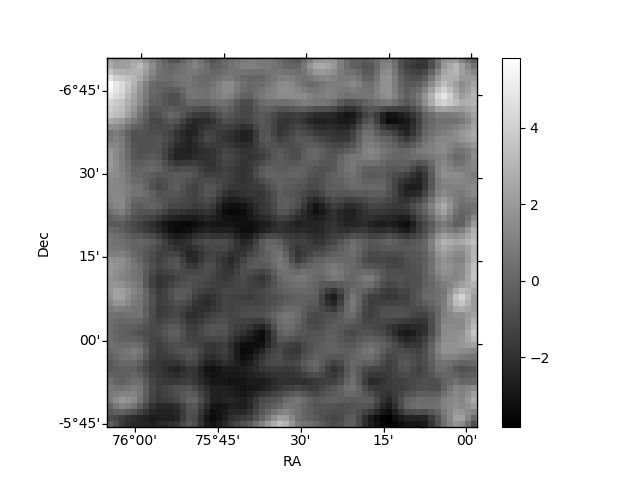
Histogram calculated using DETX and DETY for each event in the final _common_clean file
| Quadrant A | 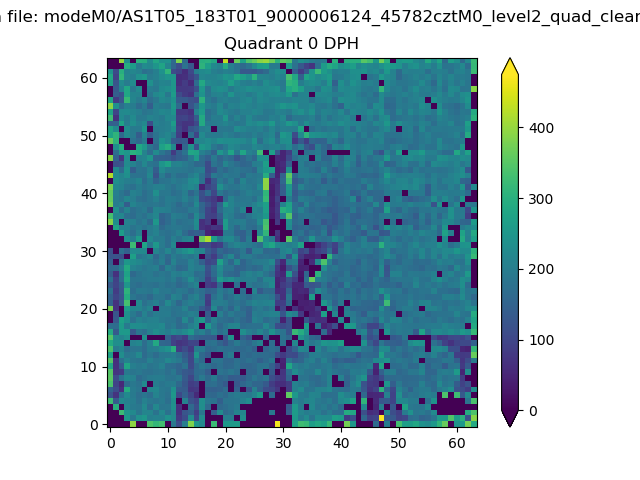 |
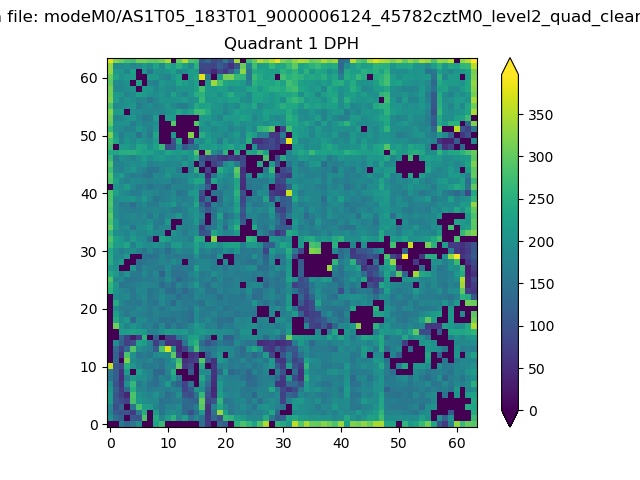 |
Quadrant B |
|---|---|---|---|
| Quadrant D | 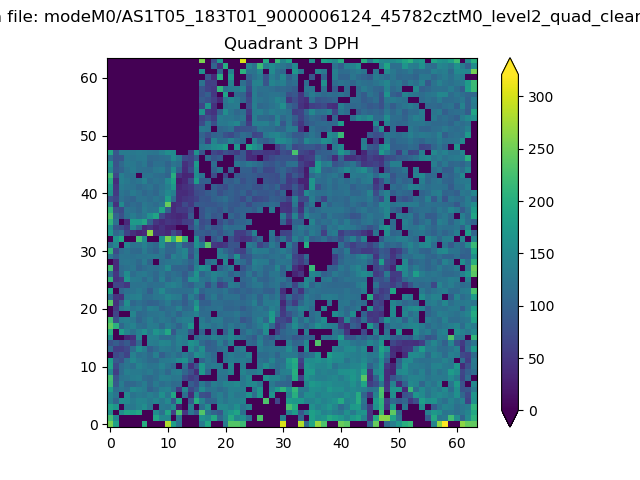 |
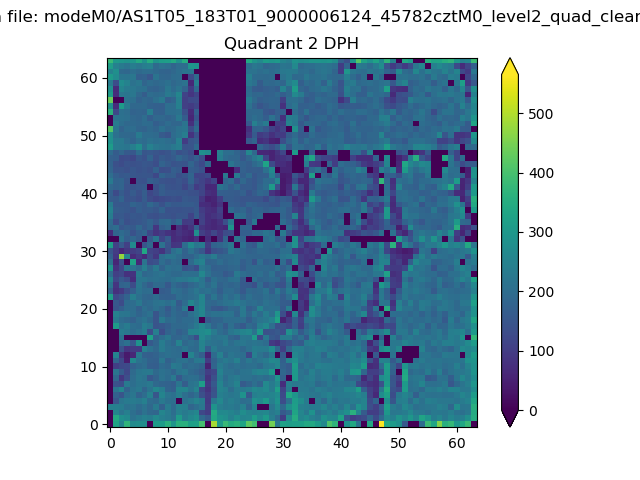 |
Quadrant C |
| Plot type | Count rate plots | Images |
|---|---|---|
| Comparison with Poisson distribution Blue bars denote a histogram of data divided into 1 sec bins. Red curve is a Poisson curve with rate = median count rate of data. |
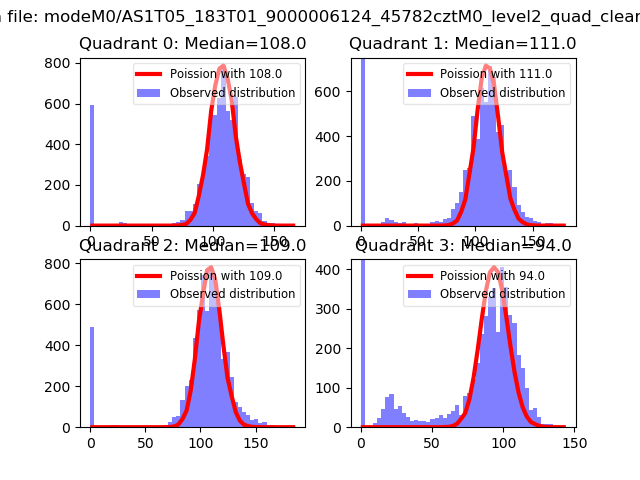 |
 |
| Quadrant-wise count rates Data is divided into 100 sec bins |
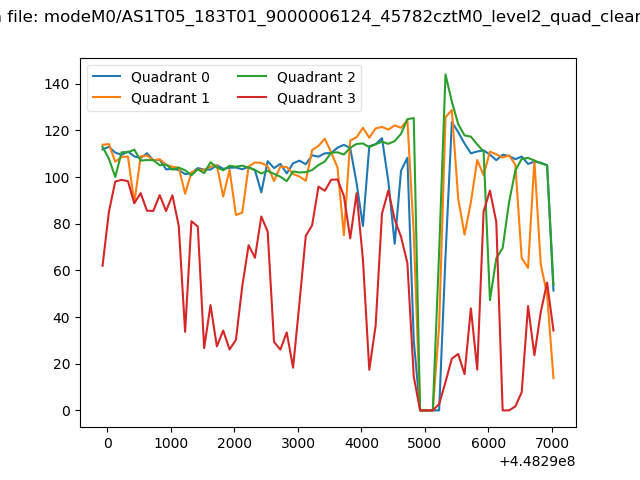 |
|
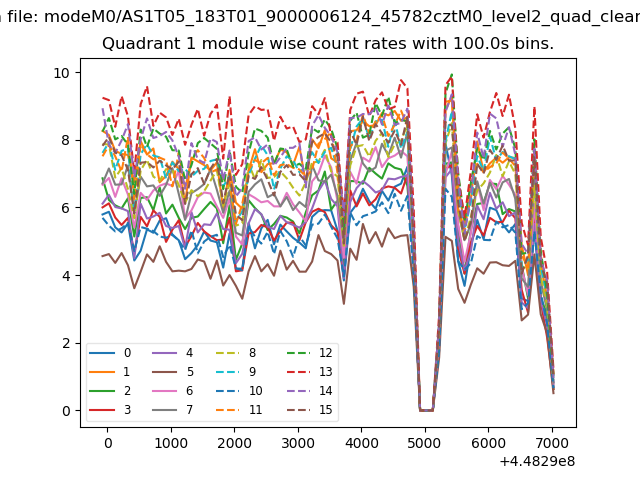
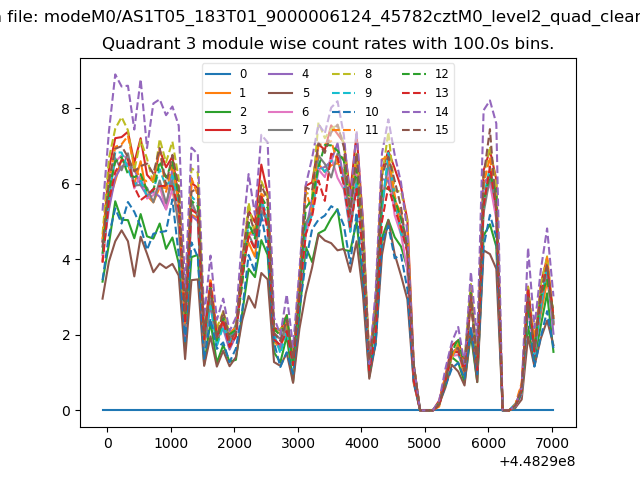
| Module-wise count rates for Quadrant A Data is divided into 100 sec bins |
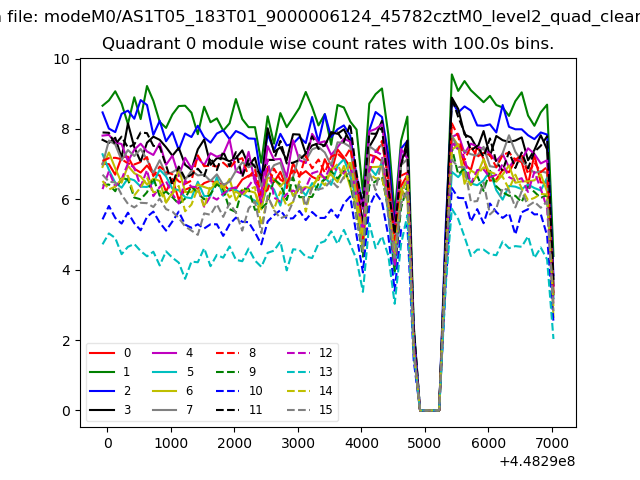 |
 |
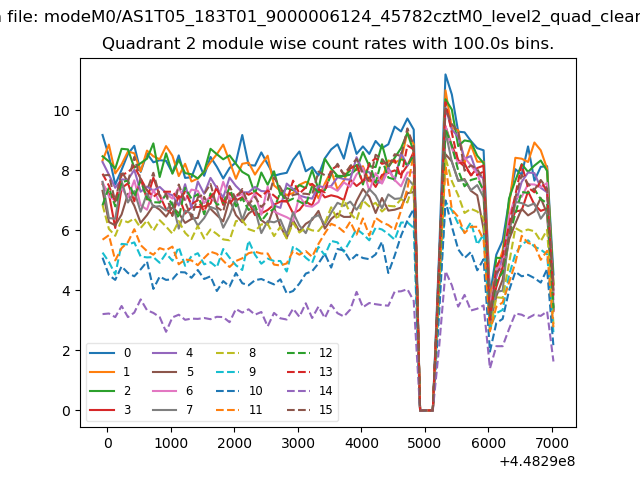
| Module-wise count rates for Quadrant B Data is divided into 100 sec bins |
 |
 |
| Module-wise count rates for Quadrant C Data is divided into 100 sec bins |
 |
 |
| Module-wise count rates for Quadrant D Data is divided into 100 sec bins |
 |
 |
| Parameter | Plot |
|---|---|
| CZT HV Monitor | 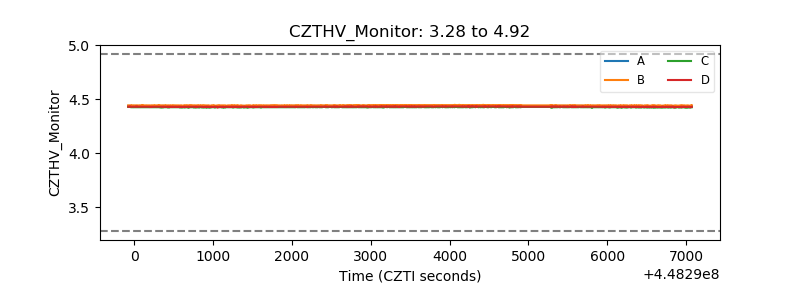 |
| D_VDD | 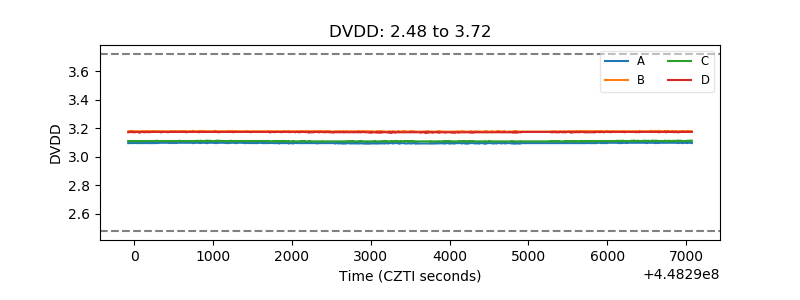 |
| Temperature 1 |  |
| Veto HV Monitor | 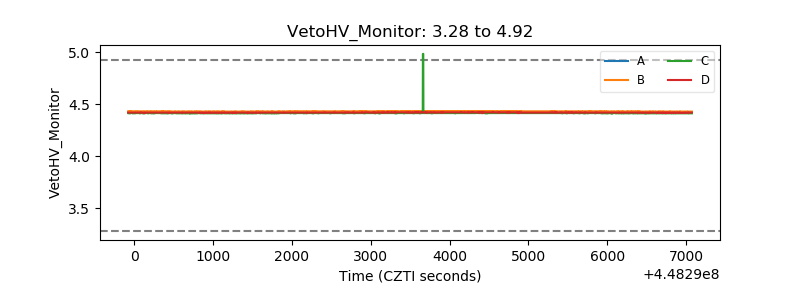 |
| Veto LLD | 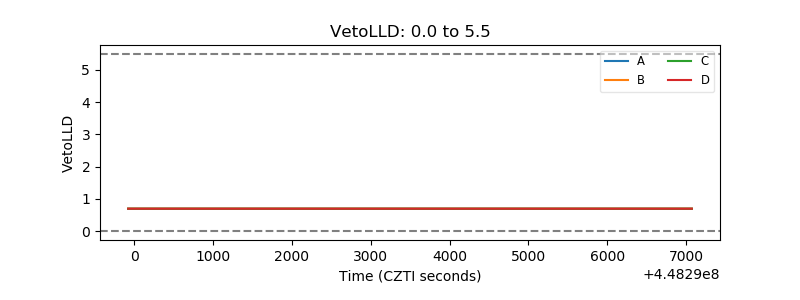 |
| Alpha Counter | 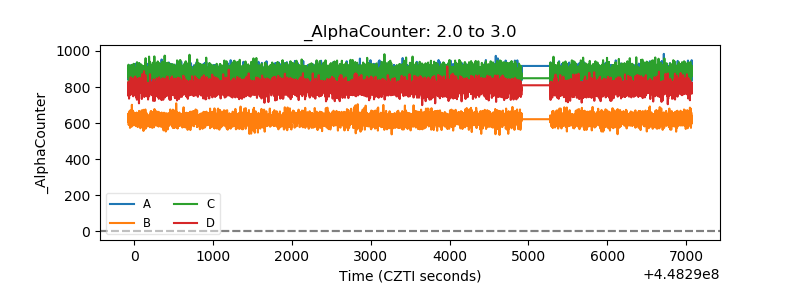 |
| _CPM_Rate | 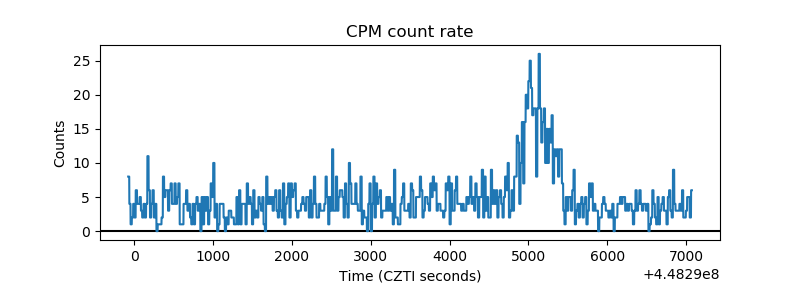 |
| CZT Counter | 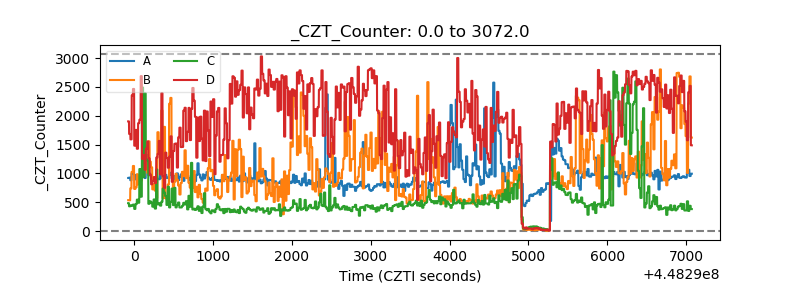 |
| +2.5 Volts monitor | 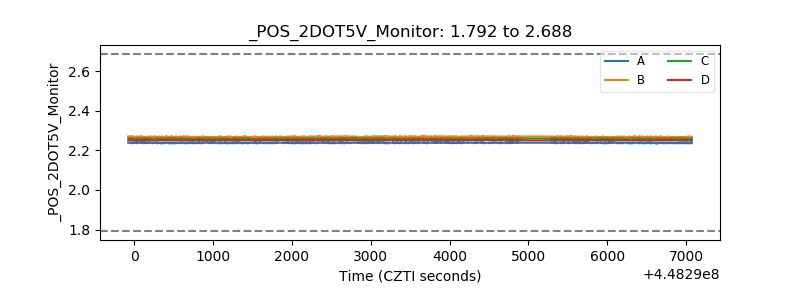 |
| +5 Volts monitor | 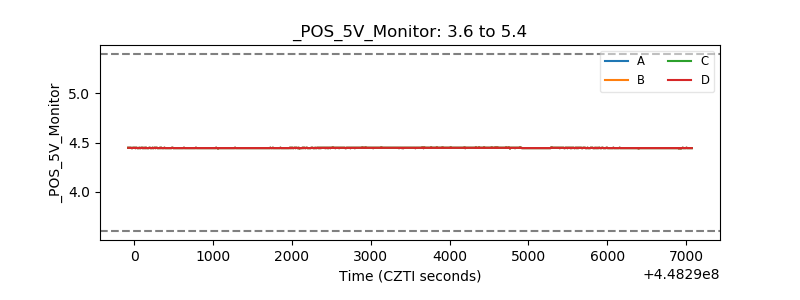 |
| _ROLL_ROT | 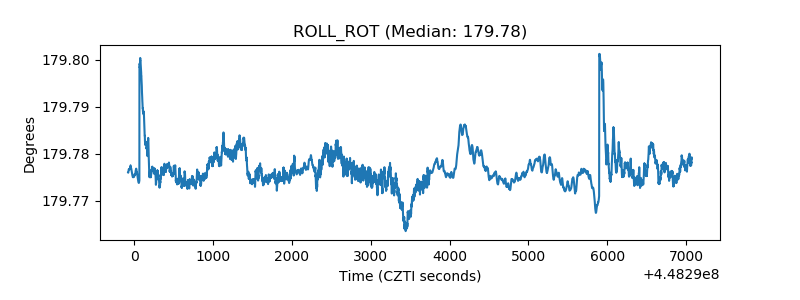 |
| _Roll_DEC | 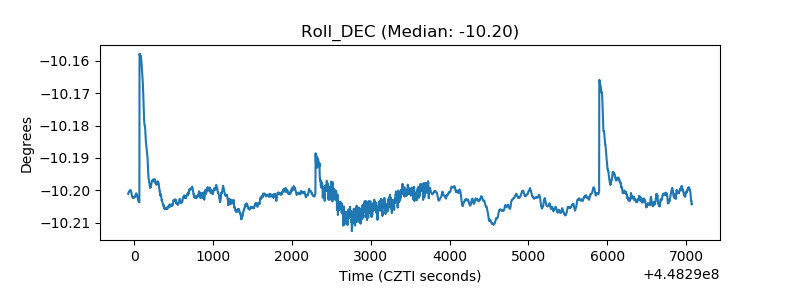 |
| _Roll_RA | 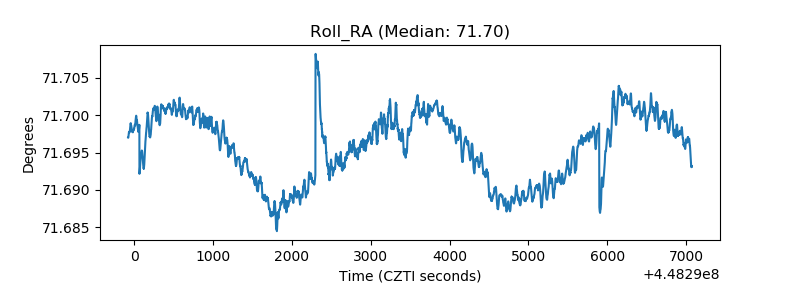 |
| Veto Counter | 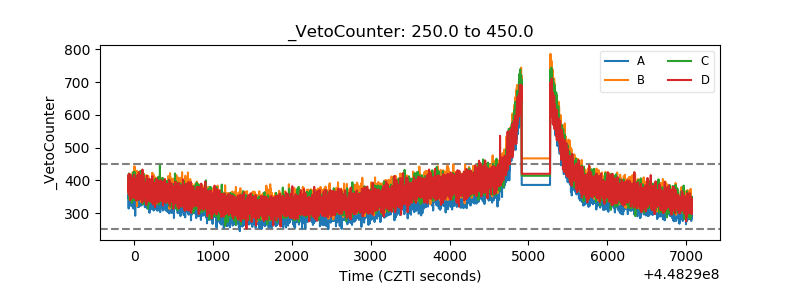 |