| Param | Original file | Final file |
|---|---|---|
| Filename | modeM0/AS1T05_183T01_9000006124_45783cztM0_level2.fits | modeM0/AS1T05_183T01_9000006124_45783cztM0_level2_quad_clean.evt |
| Size (bytes) | 871,606,080 | 110,064,960 |
| Size | 831.2 MB | 105.0 MB |
| Events in quadrant A | 6,937,125 | 778,728 |
| Events in quadrant B | 8,120,043 | 723,960 |
| Events in quadrant C | 4,385,784 | 768,140 |
| Events in quadrant D | 12,263,073 | 556,393 |
| Mode SS | |||
|---|---|---|---|
| Quadrant | BADHDUFLAG | Total packets | Discarded packets |
| A | 0 | 146 | 0 |
| B | 0 | 146 | 0 |
| C | 0 | 146 | 0 |
| D | 0 | 146 | 0 |
| Mode M0 | |||
|---|---|---|---|
| Quadrant | BADHDUFLAG | Total packets | Discarded packets |
| A | 0 | 25757 | 0 |
| B | 0 | 29159 | 0 |
| C | 0 | 18317 | 0 |
| D | 0 | 41451 | 0 |
| Quadrant | Total seconds | Saturated seconds | Saturation percentage |
|---|---|---|---|
| A | 7246 | 186 | 2.566933% |
| B | 7246 | 1051 | 14.504554% |
| C | 7246 | 281 | 3.878002% |
| D | 7246 | 2135 | 29.464532% |
Noise dominated data is calculated using 1-second bins in cleaned event files. If a bin has >2000 counts, and if more than 50% of those come from <1% of pixels, then it is considered to be noise-dominated and hence unusable.
| Quadrant | # 1 sec bins | Bins with >0 counts | Bins with >2000 counts | High rate bins dominated by noise | Noise dominated (total time) | Noise dominated (detector-on time) | Marked lightcurve |
|---|---|---|---|---|---|---|---|
| A | 7246 | 7246 | 58 | 58 | 0.80% | 0.80% | 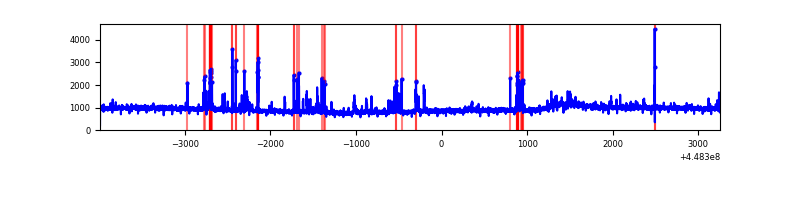 |
| B | 7246 | 7245 | 742 | 742 | 10.24% | 10.24% | 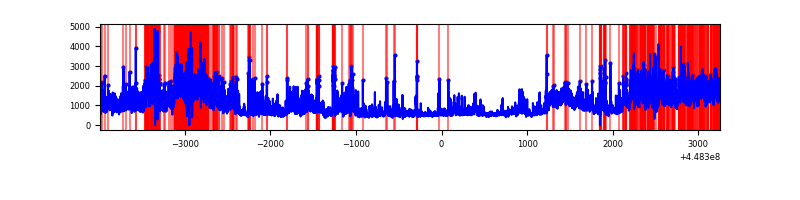 |
| C | 7246 | 7246 | 295 | 295 | 4.07% | 4.07% | 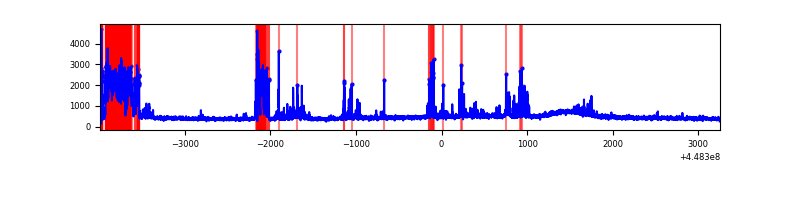 |
| D | 7246 | 7246 | 2483 | 2483 | 34.27% | 34.27% | 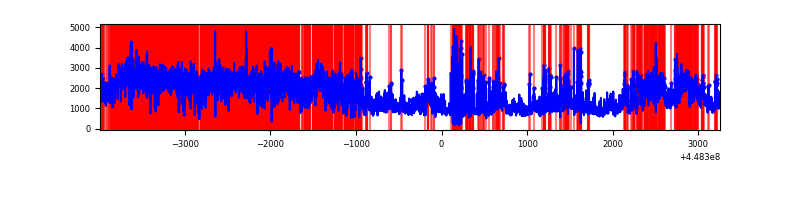 |
Top three noisy pixels from each quadrant. If the there are fewer than three noisy pixels in the level2.evt file, extra rows are filled as -1
| Pixel properties | Quadrant properties | ||||||
|---|---|---|---|---|---|---|---|
| Quadrant | DetID | PixID | Counts | Sigma | Mean | Median | Sigma |
| A | 10 | 83 | 3297104 | 18665.67 | 831 | 813 | 176.6 |
| A | 14 | 235 | 203653 | 1148.61 | 831 | 813 | 176.6 |
| A | 13 | 248 | 113157 | 636.16 | 831 | 813 | 176.6 |
| B | 3 | 112 | 3308679 | 21041.72 | 796 | 773 | 157.2 |
| B | 5 | 172 | 559021 | 3551.04 | 796 | 773 | 157.2 |
| B | 15 | 201 | 243527 | 1544.17 | 796 | 773 | 157.2 |
| C | 12 | 2 | 699311 | 3634.65 | 809 | 816 | 192.2 |
| C | 14 | 96 | 232150 | 1203.76 | 809 | 816 | 192.2 |
| C | 14 | 254 | 157929 | 817.54 | 809 | 816 | 192.2 |
| D | 11 | 241 | 6181005 | 32412.83 | 746 | 723 | 190.7 |
| D | 8 | 48 | 1308144 | 6856.84 | 746 | 723 | 190.7 |
| D | 1 | 52 | 1042472 | 5463.51 | 746 | 723 | 190.7 |
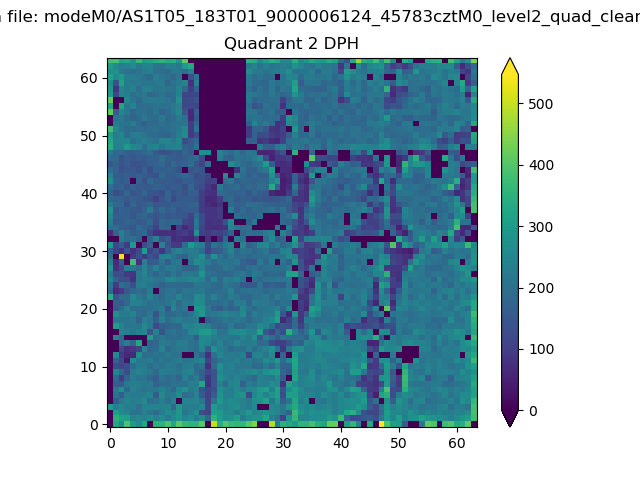
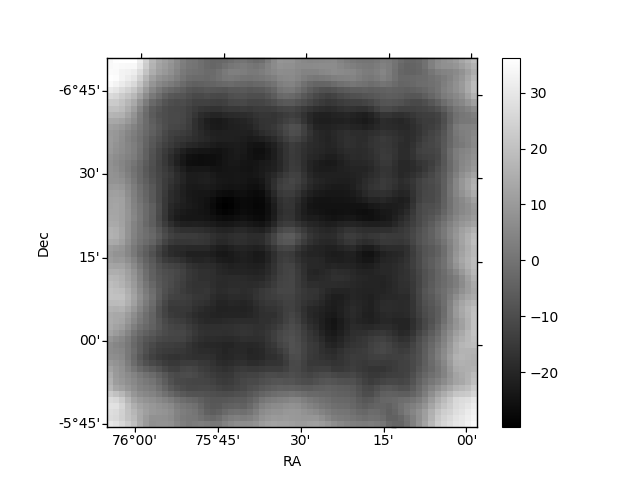
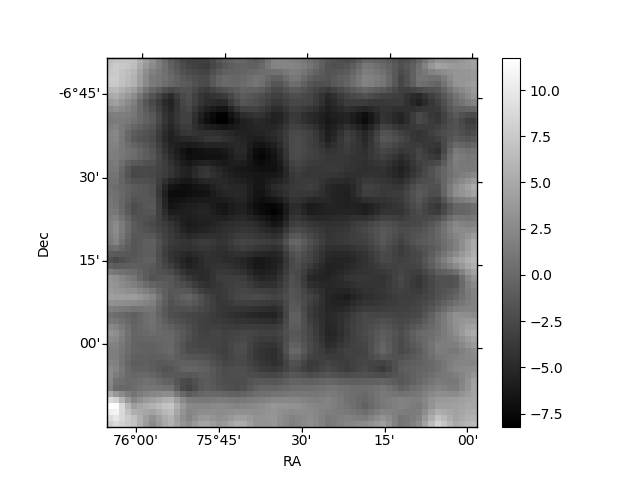
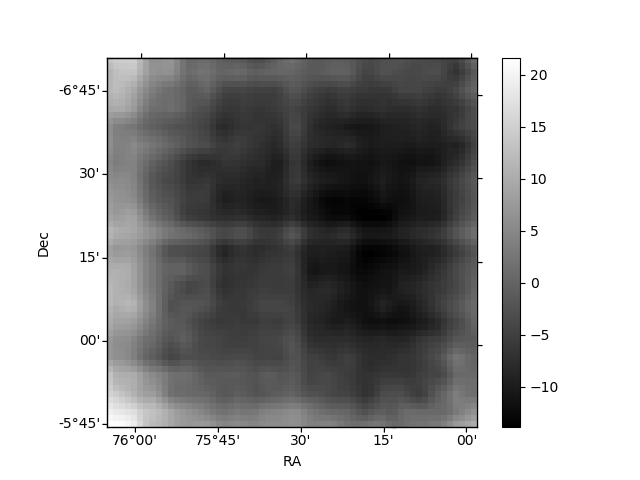
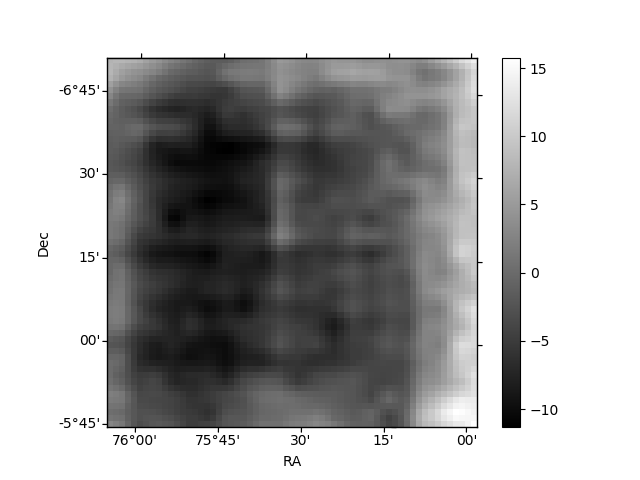
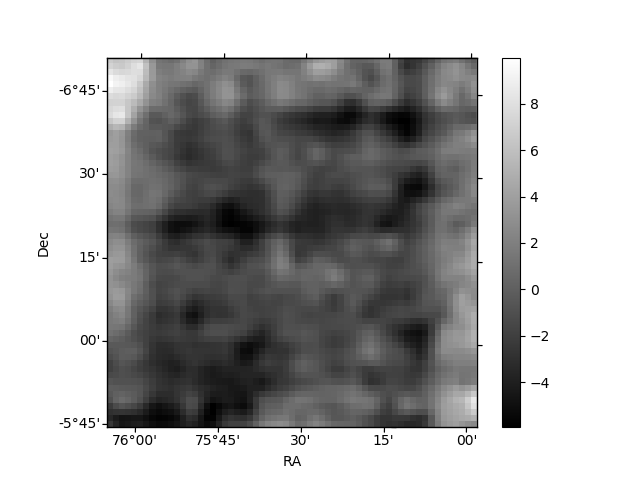
Histogram calculated using DETX and DETY for each event in the final _common_clean file
| Quadrant A | 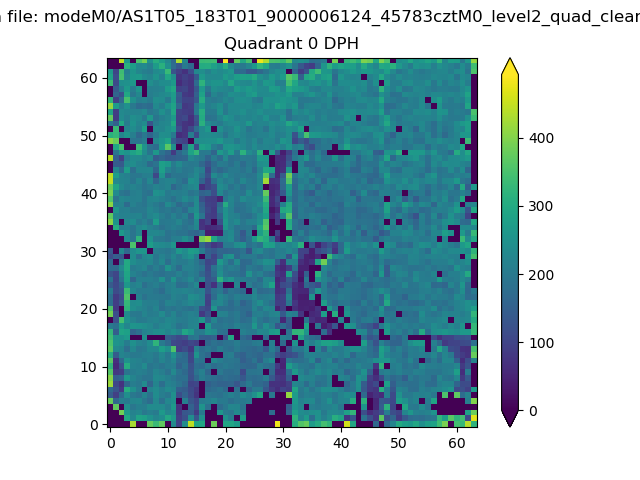 |
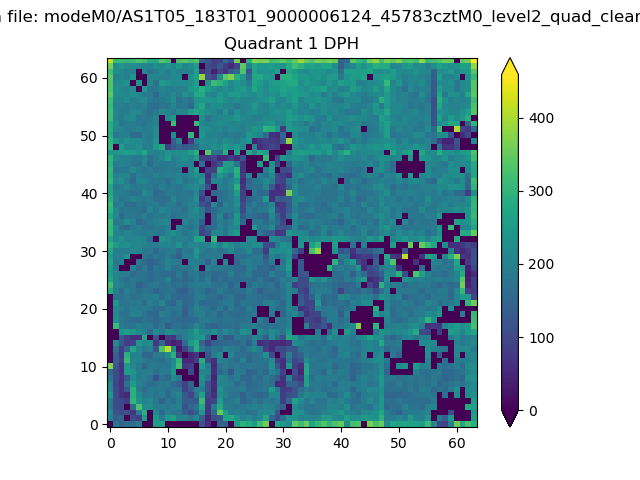 |
Quadrant B |
|---|---|---|---|
| Quadrant D | 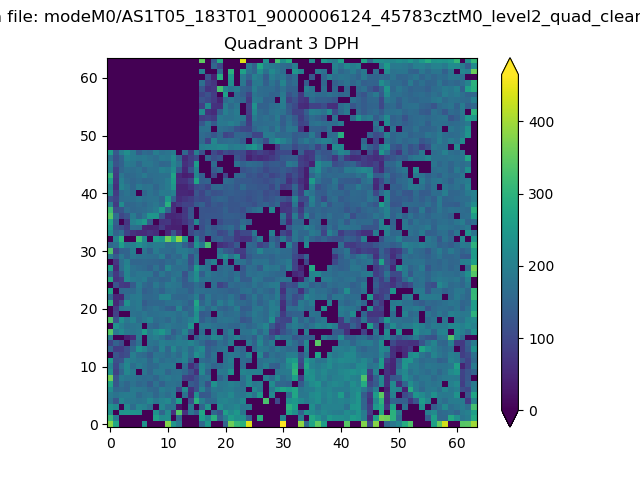 |
 |
Quadrant C |
| Plot type | Count rate plots | Images |
|---|---|---|
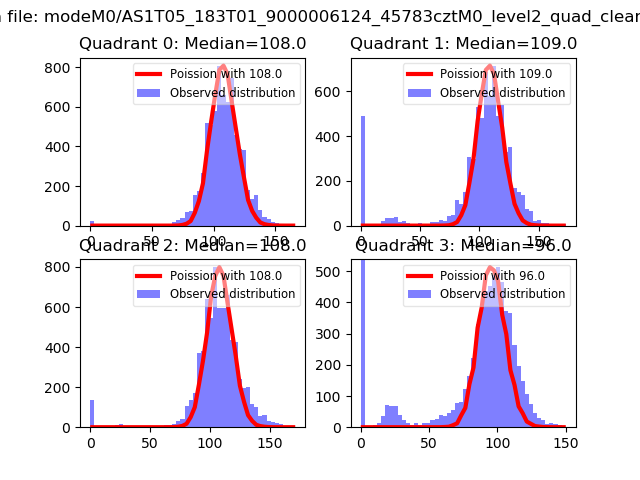
| Comparison with Poisson distribution Blue bars denote a histogram of data divided into 1 sec bins. Red curve is a Poisson curve with rate = median count rate of data. |
 |
 |
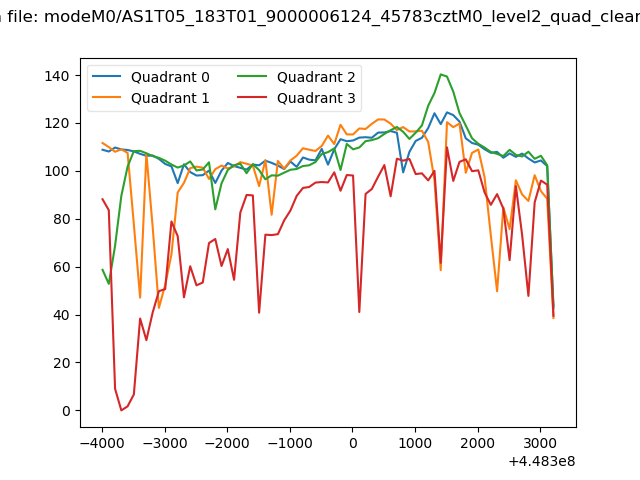
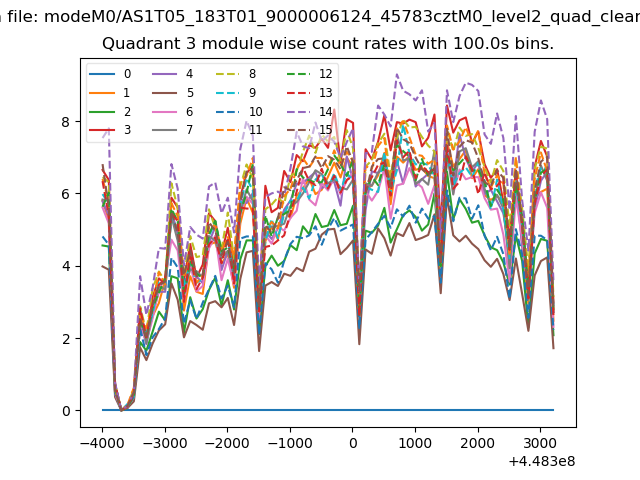
| Quadrant-wise count rates Data is divided into 100 sec bins |
 |
|
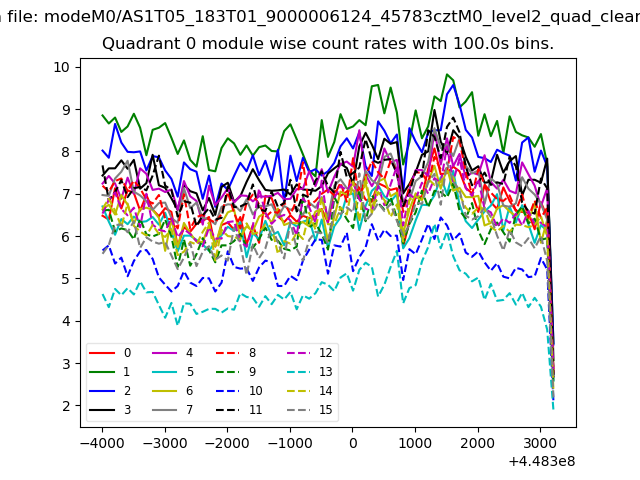
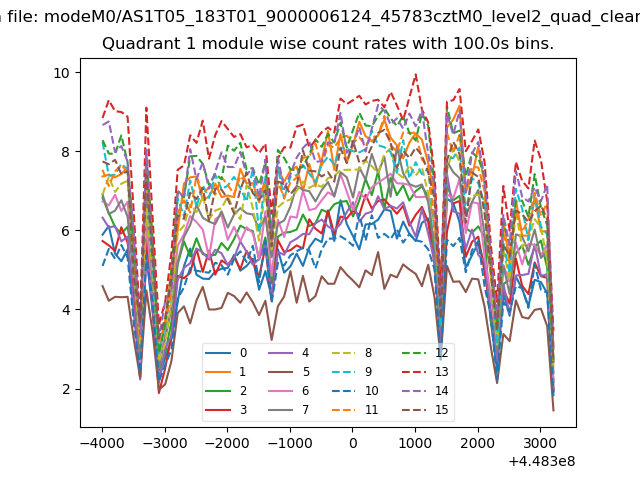
| Module-wise count rates for Quadrant A Data is divided into 100 sec bins |
 |
 |
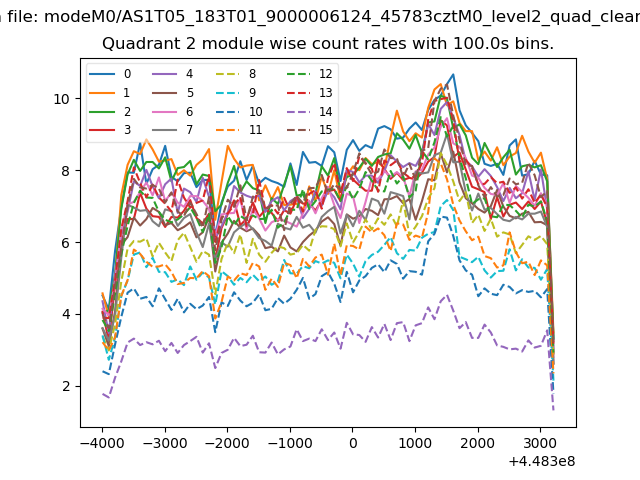
| Module-wise count rates for Quadrant B Data is divided into 100 sec bins |
 |
 |
| Module-wise count rates for Quadrant C Data is divided into 100 sec bins |
 |
 |
| Module-wise count rates for Quadrant D Data is divided into 100 sec bins |
 |
 |
| Parameter | Plot |
|---|---|
| CZT HV Monitor | 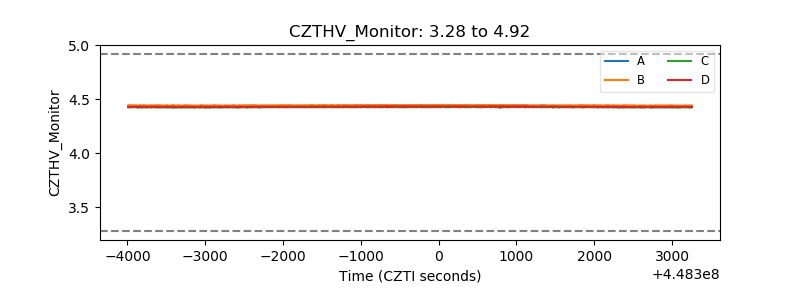 |
| D_VDD | 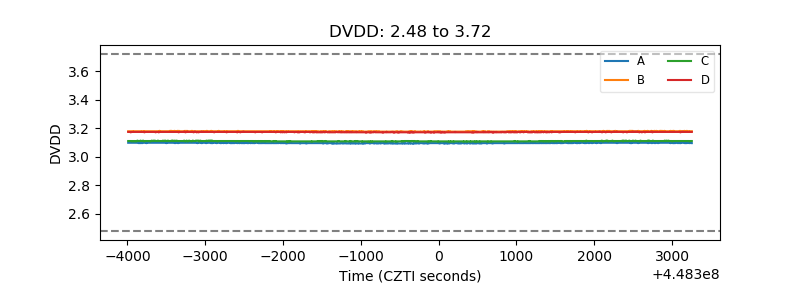 |
| Temperature 1 | 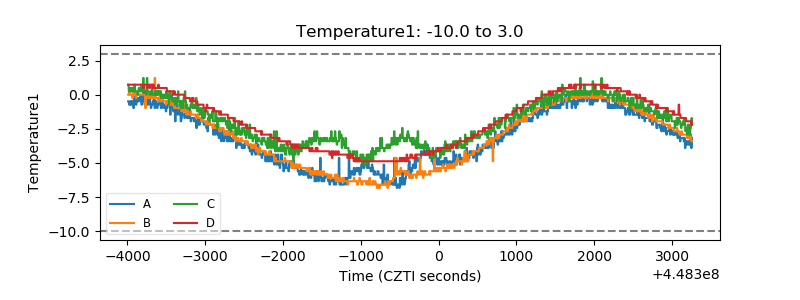 |
| Veto HV Monitor | 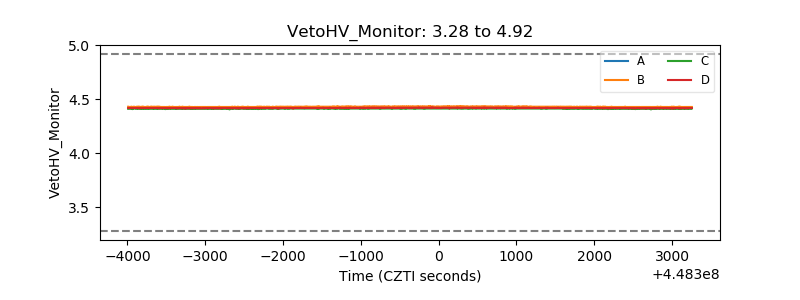 |
| Veto LLD | 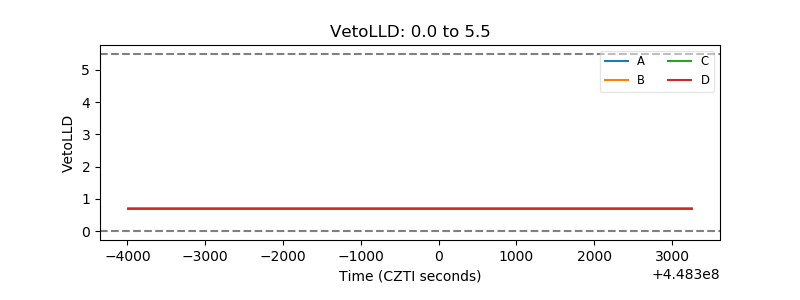 |
| Alpha Counter | 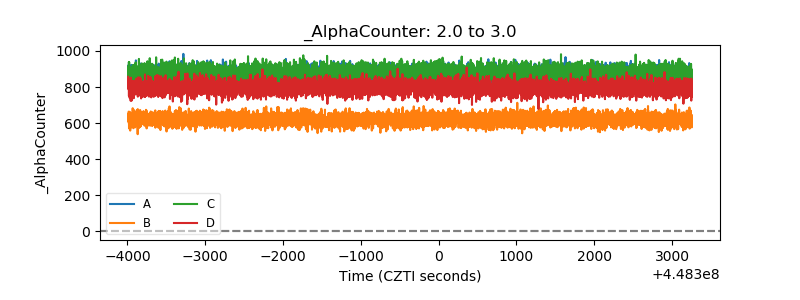 |
| _CPM_Rate | 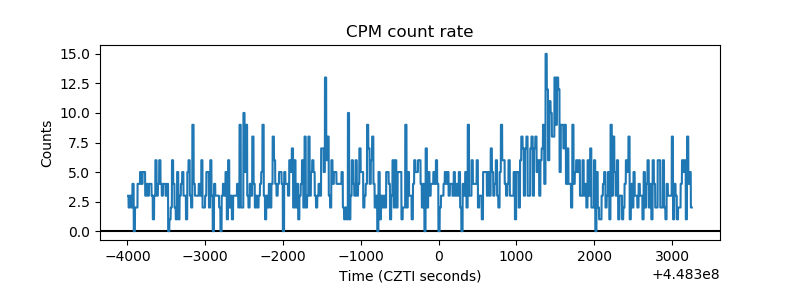 |
| CZT Counter | 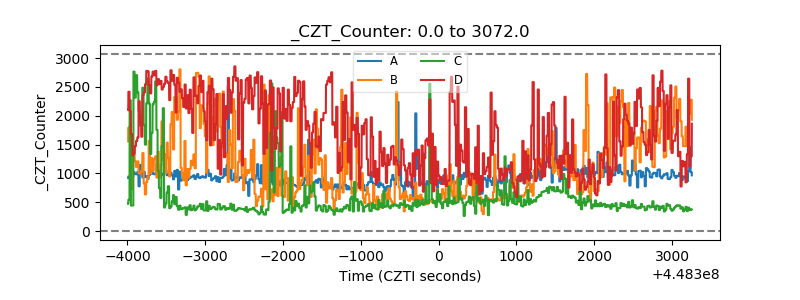 |
| +2.5 Volts monitor |  |
| +5 Volts monitor | 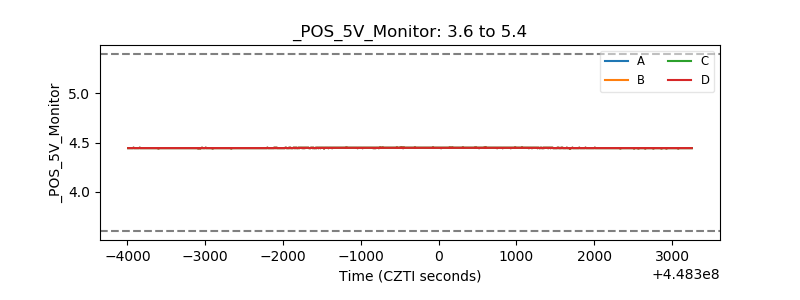 |
| _ROLL_ROT | 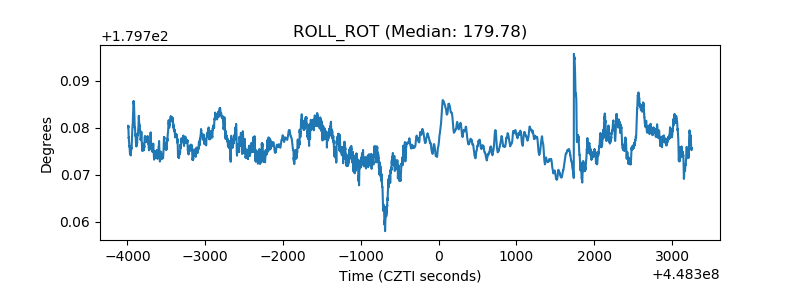 |
| _Roll_DEC | 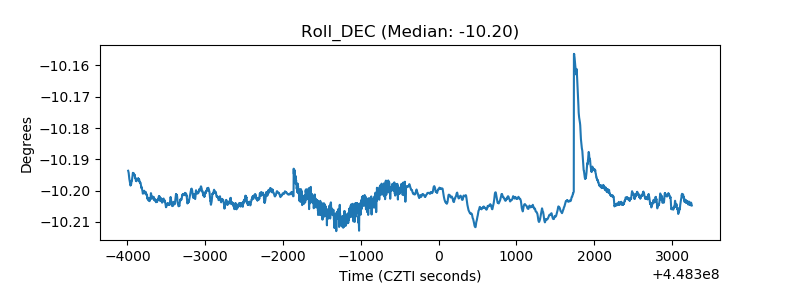 |
| _Roll_RA | 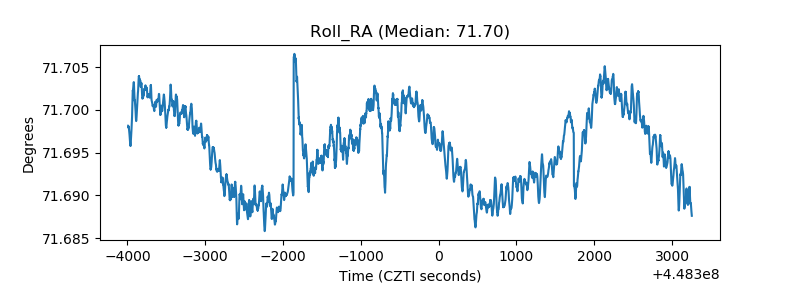 |
| Veto Counter | 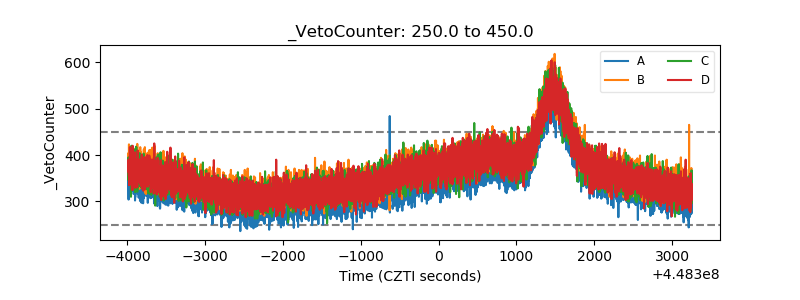 |