| Param | Original file | Final file |
|---|---|---|
| Filename | modeM0/AS1T05_088T01_9000006126_45788cztM0_level2.fits | modeM0/AS1T05_088T01_9000006126_45788cztM0_level2_quad_clean.evt |
| Size (bytes) | 485,907,840 | 74,502,720 |
| Size | 463.4 MB | 71.1 MB |
| Events in quadrant A | 4,671,444 | 509,733 |
| Events in quadrant B | 3,801,722 | 513,176 |
| Events in quadrant C | 4,275,418 | 462,334 |
| Events in quadrant D | 4,861,483 | 429,511 |
| Mode M9 | |||
|---|---|---|---|
| Quadrant | BADHDUFLAG | Total packets | Discarded packets |
| A | 0 | 5 | 0 |
| B | 0 | 5 | 0 |
| C | 0 | 5 | 0 |
| D | 0 | 5 | 0 |
| Mode M0 | |||
|---|---|---|---|
| Quadrant | BADHDUFLAG | Total packets | Discarded packets |
| A | 0 | 17462 | 1 |
| B | 0 | 14643 | 1 |
| C | 0 | 16111 | 1 |
| D | 0 | 17845 | 1 |
| Mode SS | |||
|---|---|---|---|
| Quadrant | BADHDUFLAG | Total packets | Discarded packets |
| A | 0 | 98 | 0 |
| B | 0 | 98 | 0 |
| C | 0 | 98 | 0 |
| D | 0 | 98 | 0 |
| Quadrant | Total seconds | Saturated seconds | Saturation percentage |
|---|---|---|---|
| A | 4858 | 200 | 4.116921% |
| B | 4858 | 304 | 6.257719% |
| C | 4858 | 666 | 13.709345% |
| D | 4858 | 535 | 11.012762% |
Noise dominated data is calculated using 1-second bins in cleaned event files. If a bin has >2000 counts, and if more than 50% of those come from <1% of pixels, then it is considered to be noise-dominated and hence unusable.
| Quadrant | # 1 sec bins | Bins with >0 counts | Bins with >2000 counts | High rate bins dominated by noise | Noise dominated (total time) | Noise dominated (detector-on time) | Marked lightcurve |
|---|---|---|---|---|---|---|---|
| A | 5353 | 4859 | 78 | 78 | 1.46% | 1.61% | 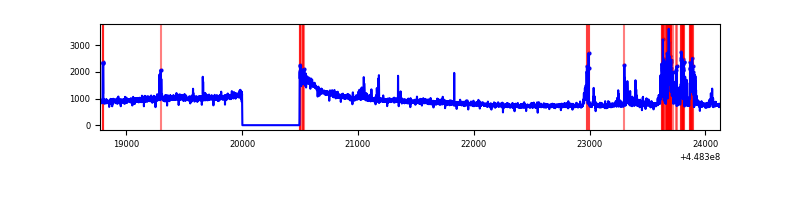 |
| B | 5353 | 4859 | 130 | 130 | 2.43% | 2.68% | 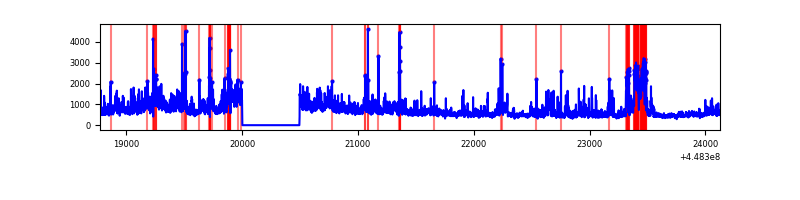 |
| C | 5353 | 4859 | 608 | 608 | 11.36% | 12.51% | 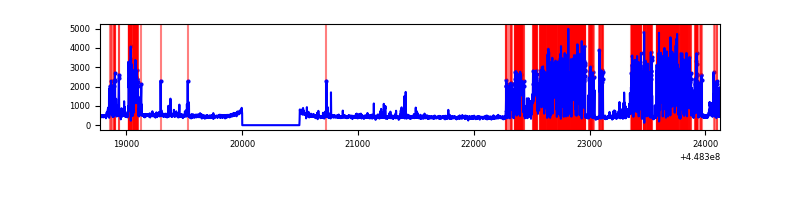 |
| D | 5353 | 4859 | 351 | 351 | 6.56% | 7.22% | 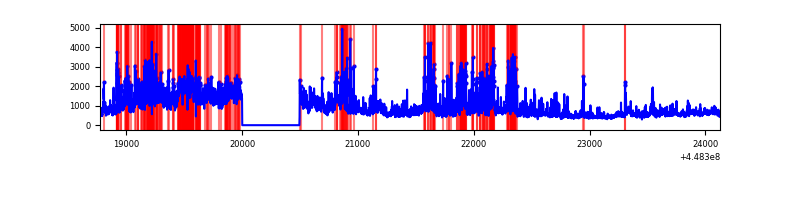 |
Top three noisy pixels from each quadrant. If the there are fewer than three noisy pixels in the level2.evt file, extra rows are filled as -1
| Pixel properties | Quadrant properties | ||||||
|---|---|---|---|---|---|---|---|
| Quadrant | DetID | PixID | Counts | Sigma | Mean | Median | Sigma |
| A | 10 | 83 | 2214222 | 19825.44 | 534 | 522 | 111.7 |
| A | 9 | 191 | 294264 | 2630.69 | 534 | 522 | 111.7 |
| A | 14 | 235 | 32583 | 287.13 | 534 | 522 | 111.7 |
| B | 3 | 112 | 1213401 | 11508.75 | 529 | 513 | 105.4 |
| B | 5 | 172 | 97483 | 920.12 | 529 | 513 | 105.4 |
| B | 0 | 189 | 83394 | 786.43 | 529 | 513 | 105.4 |
| C | 12 | 2 | 2029032 | 16774.81 | 506 | 509 | 120.9 |
| C | 14 | 254 | 231341 | 1908.86 | 506 | 509 | 120.9 |
| C | 2 | 14 | 24698 | 200.03 | 506 | 509 | 120.9 |
| D | 11 | 241 | 1500922 | 11497.04 | 508 | 491 | 130.5 |
| D | 2 | 249 | 554019 | 4241.4 | 508 | 491 | 130.5 |
| D | 12 | 2 | 370847 | 2837.85 | 508 | 491 | 130.5 |
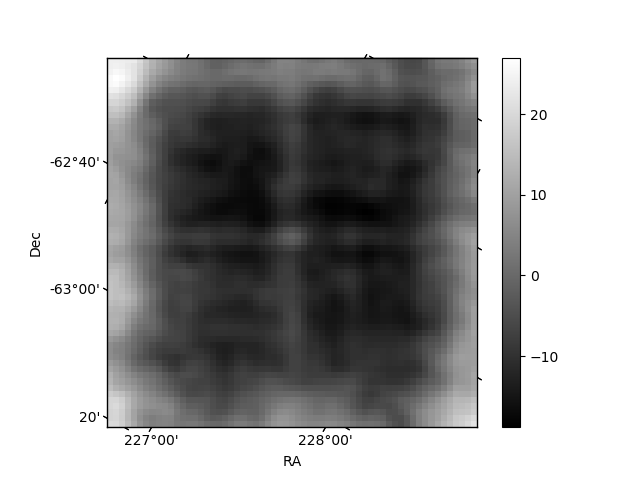
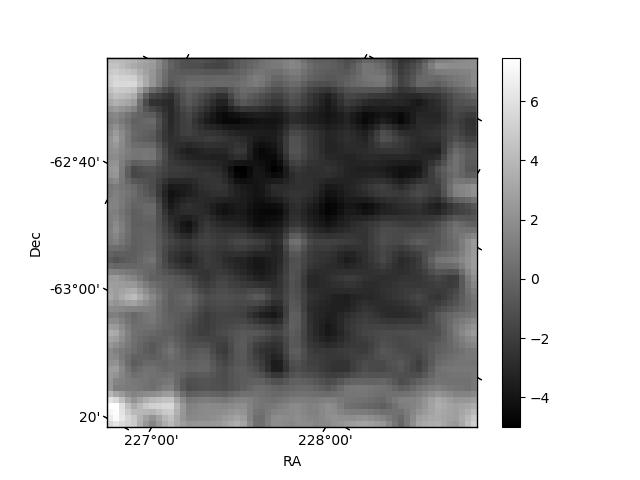
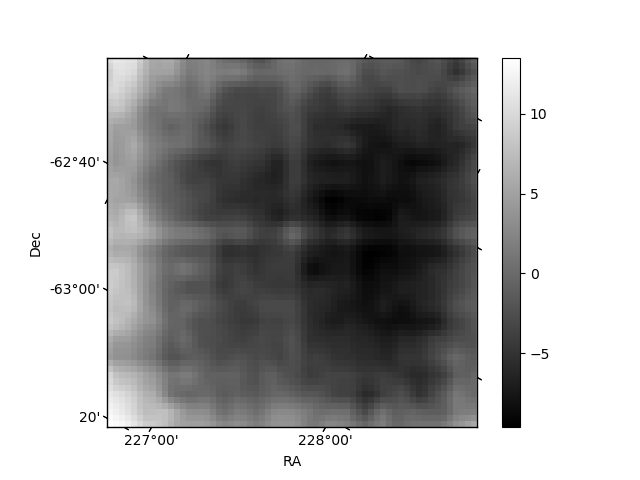
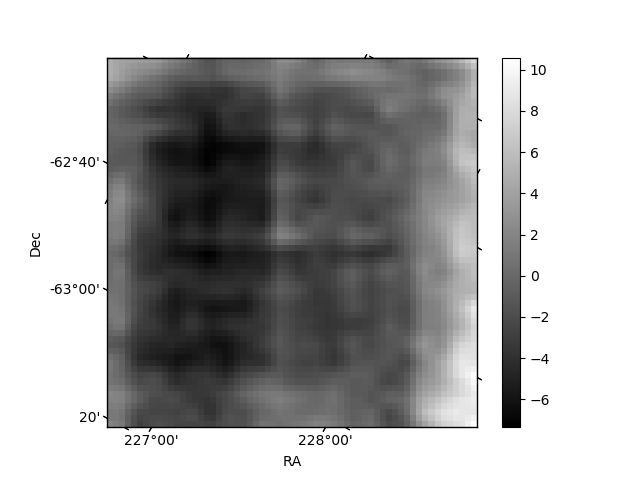
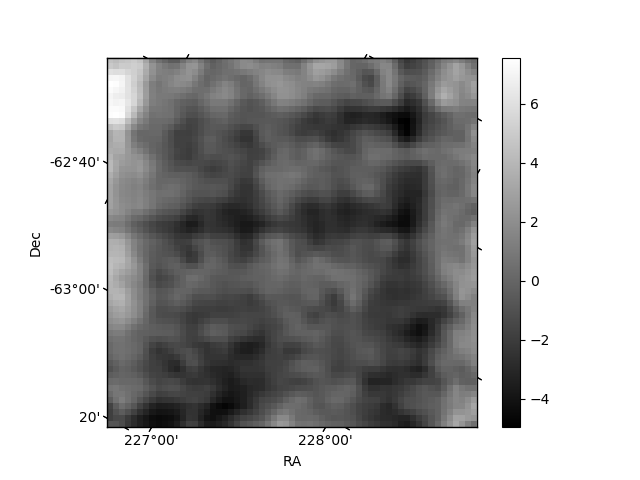
Histogram calculated using DETX and DETY for each event in the final _common_clean file
| Quadrant A | 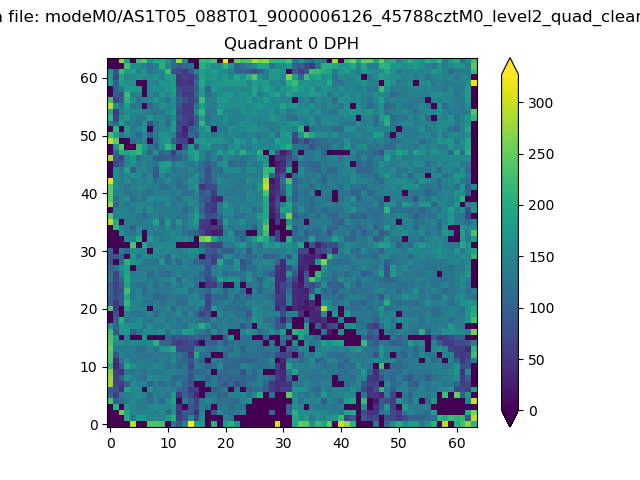 |
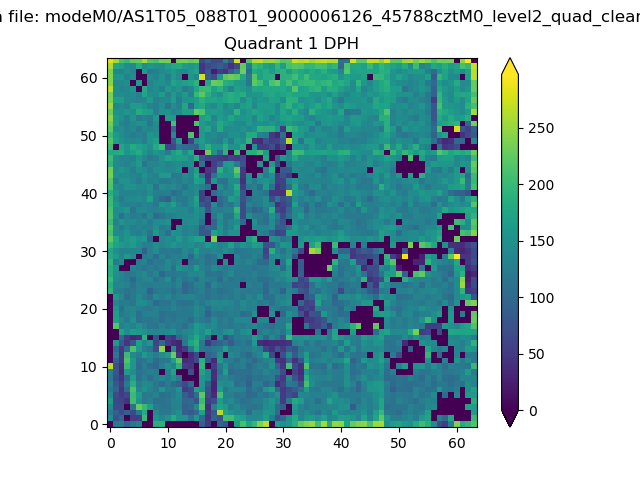 |
Quadrant B |
|---|---|---|---|
| Quadrant D | 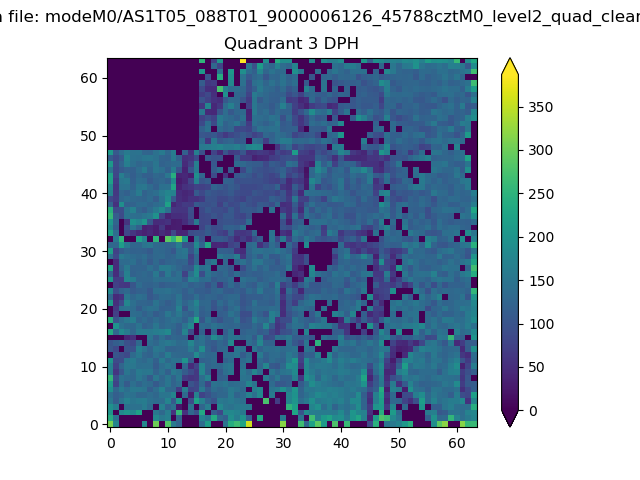 |
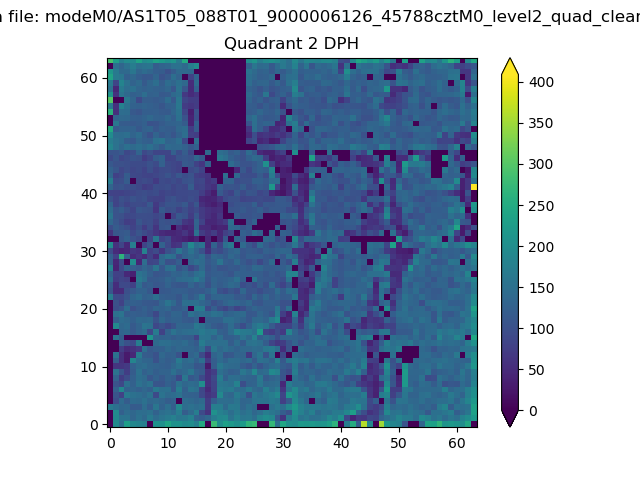 |
Quadrant C |
| Plot type | Count rate plots | Images |
|---|---|---|
| Comparison with Poisson distribution Blue bars denote a histogram of data divided into 1 sec bins. Red curve is a Poisson curve with rate = median count rate of data. |
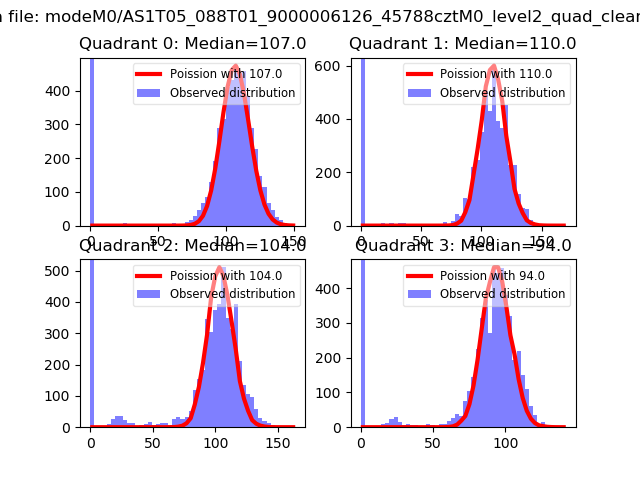 |
 |
| Quadrant-wise count rates Data is divided into 100 sec bins |
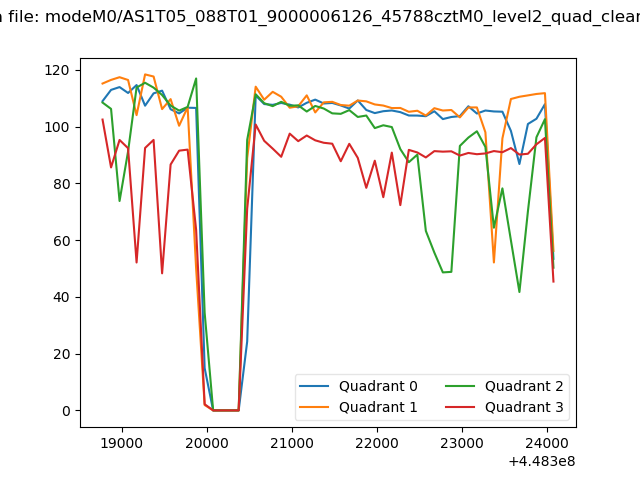 |
|
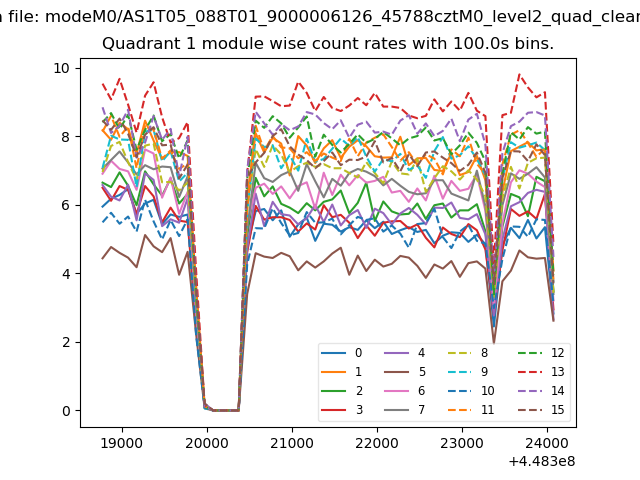
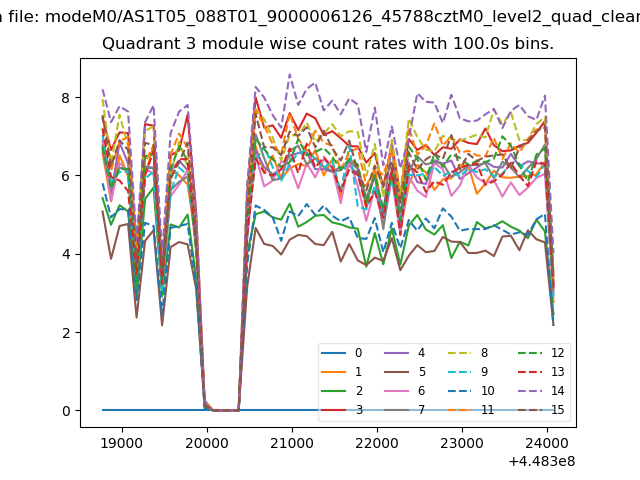
| Module-wise count rates for Quadrant A Data is divided into 100 sec bins |
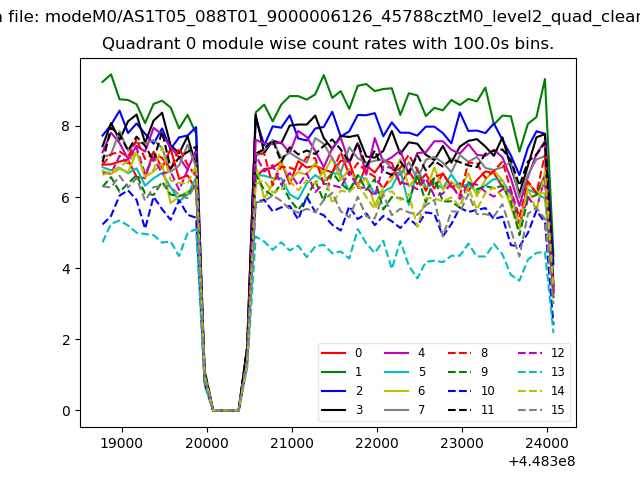 |
 |
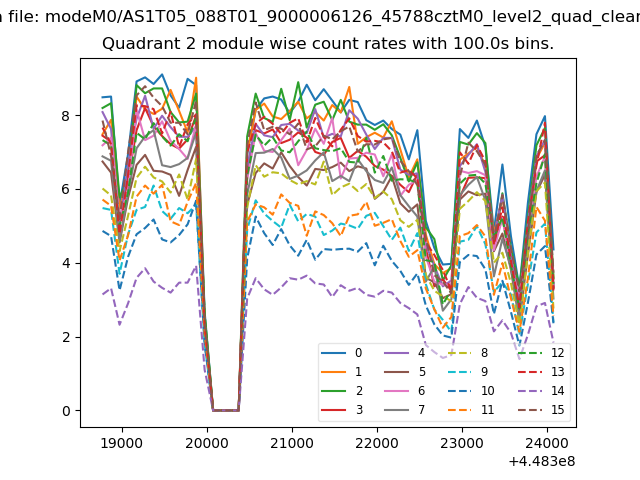
| Module-wise count rates for Quadrant B Data is divided into 100 sec bins |
 |
 |
| Module-wise count rates for Quadrant C Data is divided into 100 sec bins |
 |
 |
| Module-wise count rates for Quadrant D Data is divided into 100 sec bins |
 |
 |
| Parameter | Plot |
|---|---|
| CZT HV Monitor | 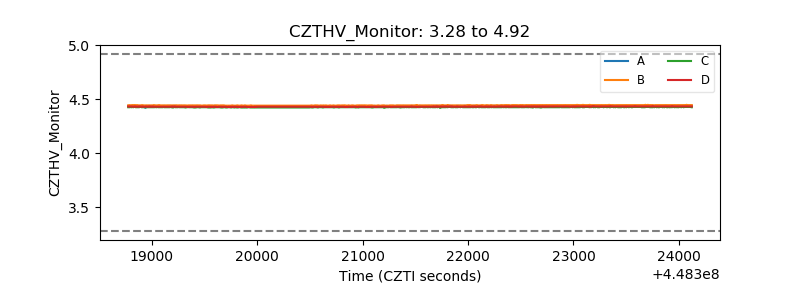 |
| D_VDD | 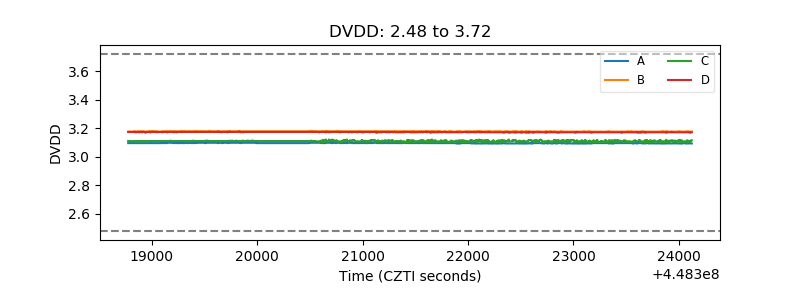 |
| Temperature 1 | 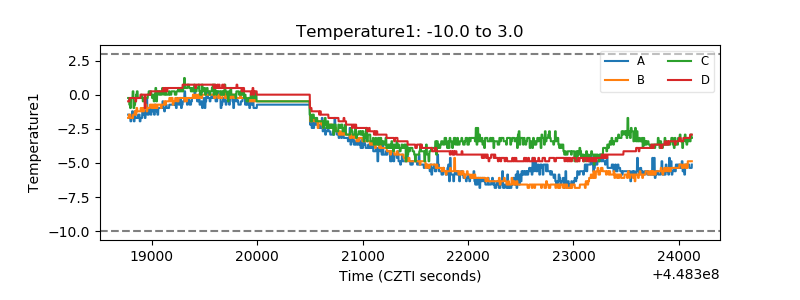 |
| Veto HV Monitor | 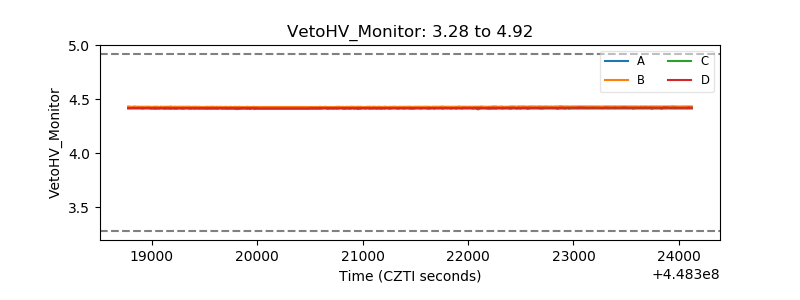 |
| Veto LLD | 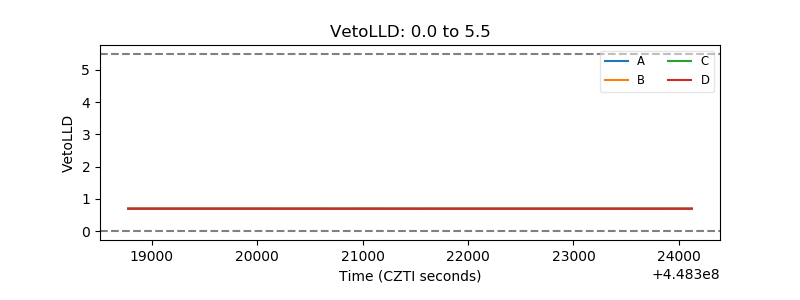 |
| Alpha Counter | 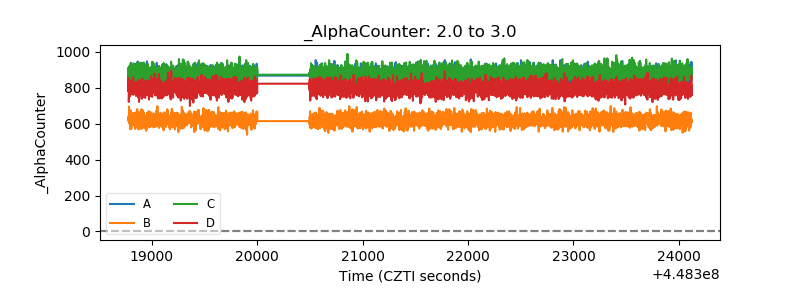 |
| _CPM_Rate | 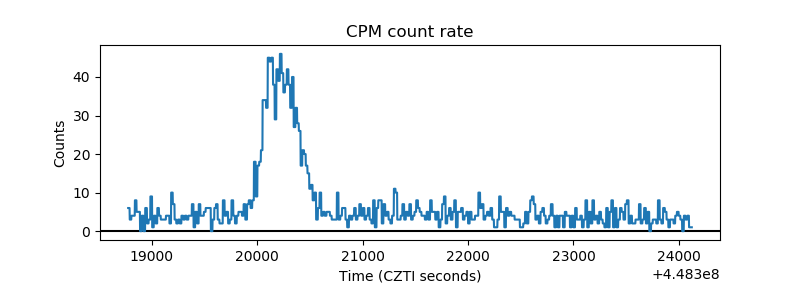 |
| CZT Counter | 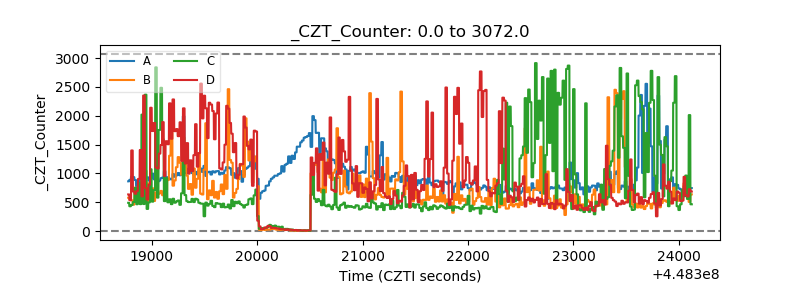 |
| +2.5 Volts monitor | 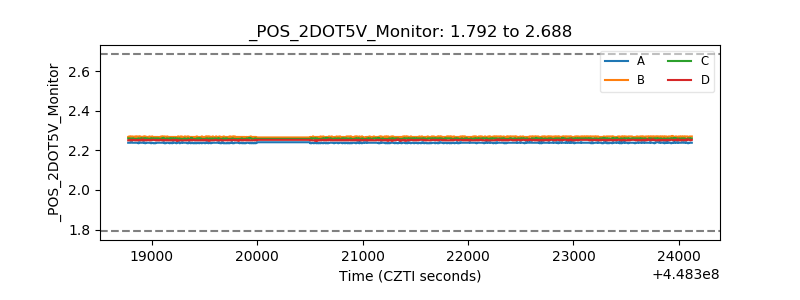 |
| +5 Volts monitor | 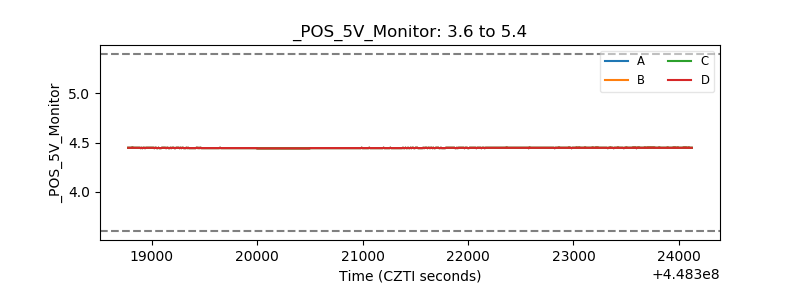 |
| _ROLL_ROT | 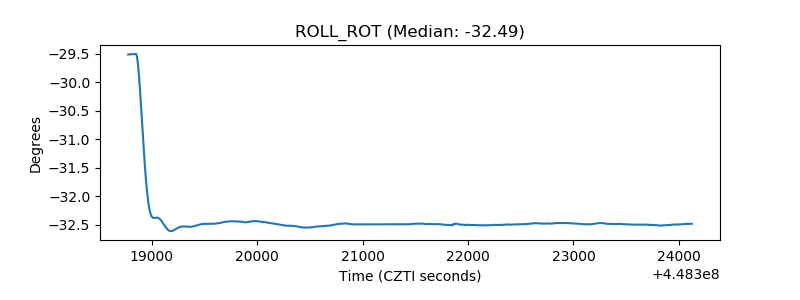 |
| _Roll_DEC | 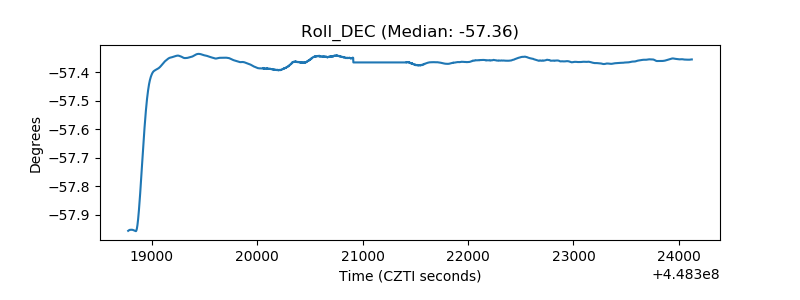 |
| _Roll_RA | 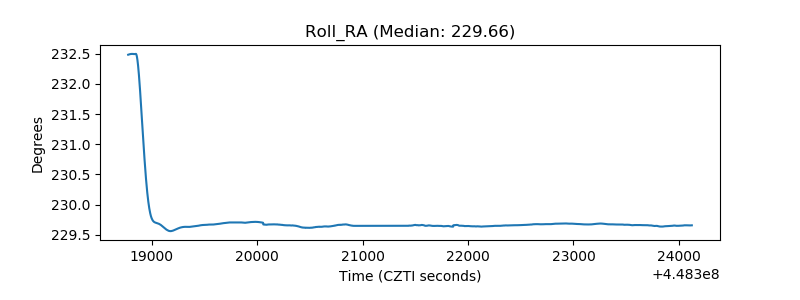 |
| Veto Counter | 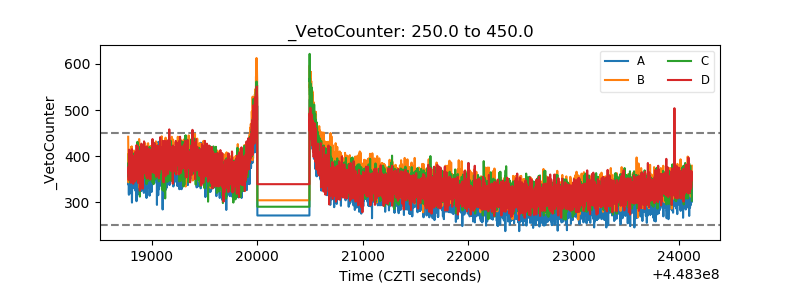 |