| Param | Original file | Final file |
|---|---|---|
| Filename | modeM0/AS1T05_088T01_9000006126_45790cztM0_level2.fits | modeM0/AS1T05_088T01_9000006126_45790cztM0_level2_quad_clean.evt |
| Size (bytes) | 1,417,685,760 | 225,915,840 |
| Size | 1.3 GB | 215.5 MB |
| Events in quadrant A | 13,476,175 | 1,568,508 |
| Events in quadrant B | 10,112,393 | 1,602,108 |
| Events in quadrant C | 11,967,543 | 1,365,453 |
| Events in quadrant D | 15,793,469 | 1,292,397 |
| Mode M9 | |||
|---|---|---|---|
| Quadrant | BADHDUFLAG | Total packets | Discarded packets |
| A | 0 | 26 | 0 |
| B | 0 | 26 | 0 |
| C | 0 | 26 | 0 |
| D | 0 | 26 | 0 |
| Mode M0 | |||
|---|---|---|---|
| Quadrant | BADHDUFLAG | Total packets | Discarded packets |
| A | 0 | 50136 | 3 |
| B | 0 | 39890 | 3 |
| C | 0 | 45962 | 3 |
| D | 0 | 57085 | 3 |
| Mode SS | |||
|---|---|---|---|
| Quadrant | BADHDUFLAG | Total packets | Discarded packets |
| A | 0 | 298 | 0 |
| B | 0 | 298 | 0 |
| C | 0 | 298 | 0 |
| D | 0 | 298 | 0 |
| Quadrant | Total seconds | Saturated seconds | Saturation percentage |
|---|---|---|---|
| A | 14650 | 448 | 3.058020% |
| B | 14650 | 552 | 3.767918% |
| C | 14650 | 2082 | 14.211604% |
| D | 14651 | 1656 | 11.302983% |
Noise dominated data is calculated using 1-second bins in cleaned event files. If a bin has >2000 counts, and if more than 50% of those come from <1% of pixels, then it is considered to be noise-dominated and hence unusable.
| Quadrant | # 1 sec bins | Bins with >0 counts | Bins with >2000 counts | High rate bins dominated by noise | Noise dominated (total time) | Noise dominated (detector-on time) | Marked lightcurve |
|---|---|---|---|---|---|---|---|
| A | 17240 | 14653 | 225 | 225 | 1.31% | 1.54% | 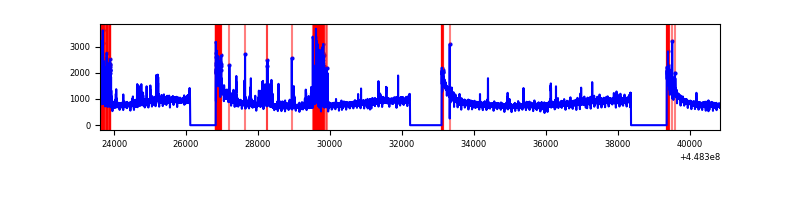 |
| B | 17240 | 14653 | 317 | 317 | 1.84% | 2.16% | 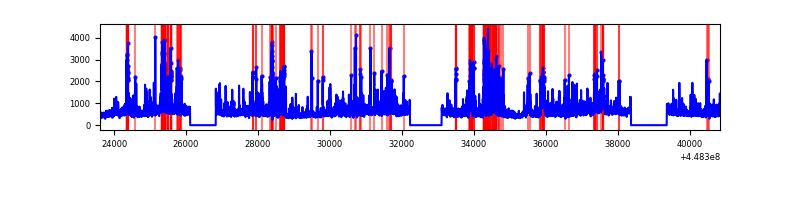 |
| C | 17240 | 14652 | 1838 | 1838 | 10.66% | 12.54% | 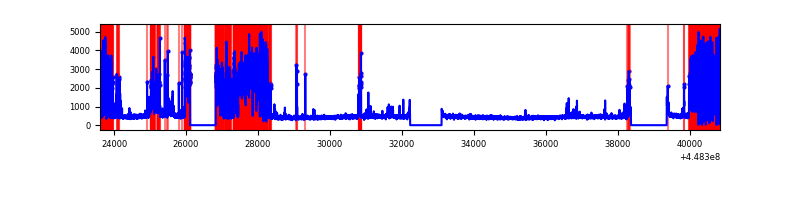 |
| D | 17241 | 14654 | 1285 | 1285 | 7.45% | 8.77% | 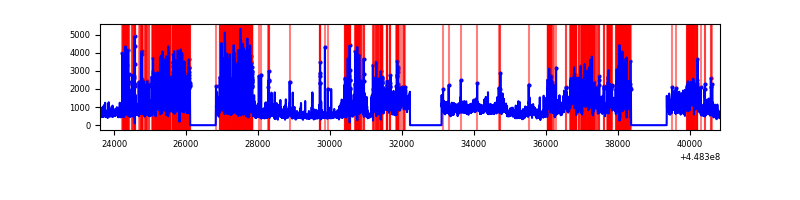 |
Top three noisy pixels from each quadrant. If the there are fewer than three noisy pixels in the level2.evt file, extra rows are filled as -1
| Pixel properties | Quadrant properties | ||||||
|---|---|---|---|---|---|---|---|
| Quadrant | DetID | PixID | Counts | Sigma | Mean | Median | Sigma |
| A | 10 | 83 | 6191382 | 18363.69 | 1634 | 1598 | 337.1 |
| A | 9 | 191 | 659093 | 1950.64 | 1634 | 1598 | 337.1 |
| A | 13 | 248 | 187820 | 552.48 | 1634 | 1598 | 337.1 |
| B | 3 | 112 | 2493120 | 7781.51 | 1631 | 1580 | 320.2 |
| B | 0 | 189 | 223511 | 693.13 | 1631 | 1580 | 320.2 |
| B | 15 | 201 | 218252 | 676.7 | 1631 | 1580 | 320.2 |
| C | 12 | 2 | 5978481 | 17085.64 | 1496 | 1504 | 349.8 |
| C | 2 | 14 | 71927 | 201.31 | 1496 | 1504 | 349.8 |
| C | 12 | 250 | 43389 | 119.73 | 1496 | 1504 | 349.8 |
| D | 11 | 241 | 4705849 | 11998.49 | 1551 | 1503 | 392.1 |
| D | 12 | 2 | 2654626 | 6766.82 | 1551 | 1503 | 392.1 |
| D | 1 | 52 | 420288 | 1068.12 | 1551 | 1503 | 392.1 |
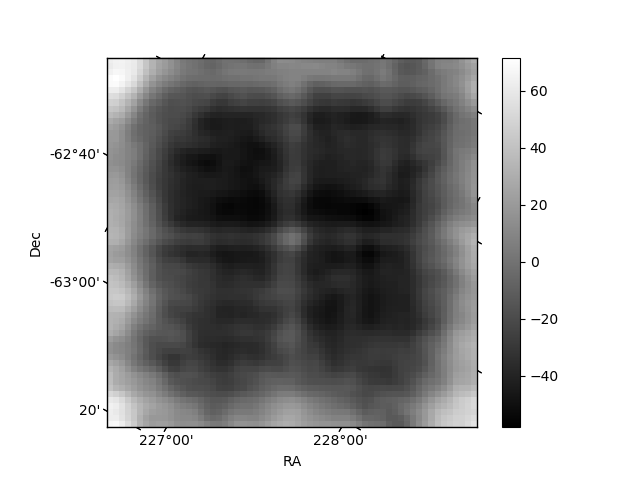
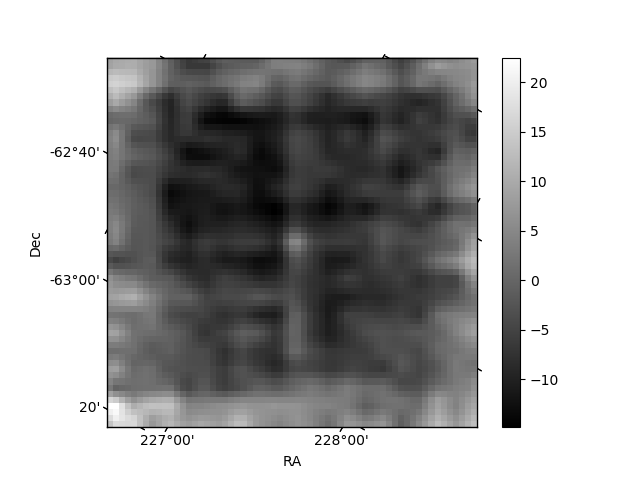
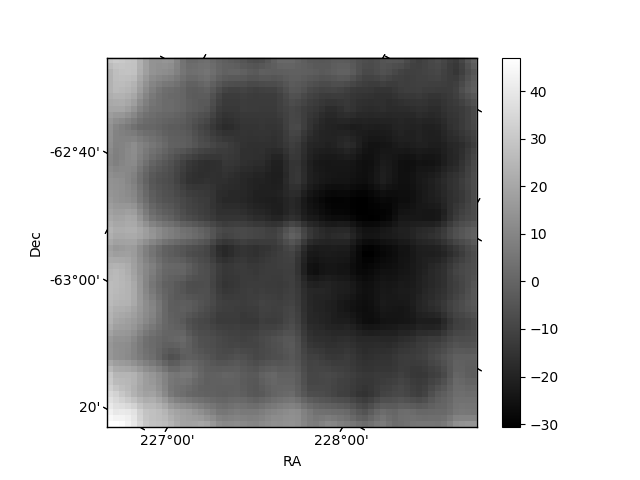
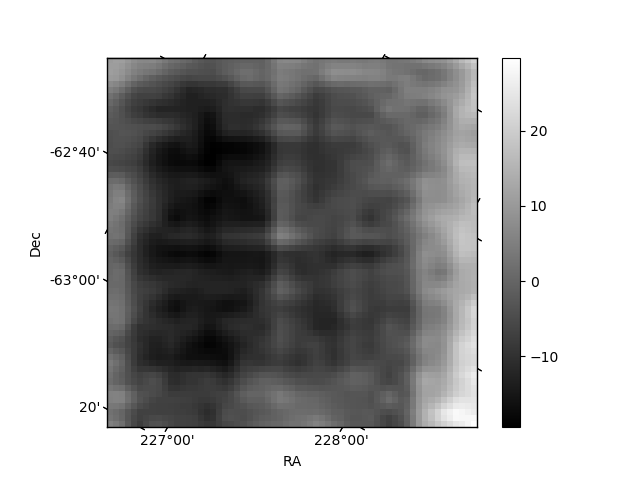
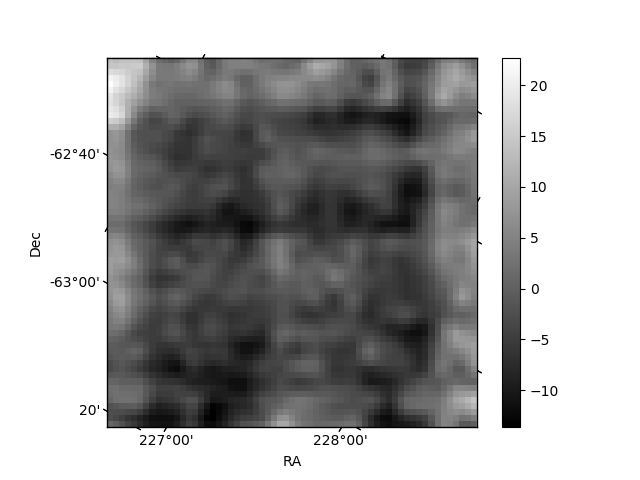
Histogram calculated using DETX and DETY for each event in the final _common_clean file
| Quadrant A | 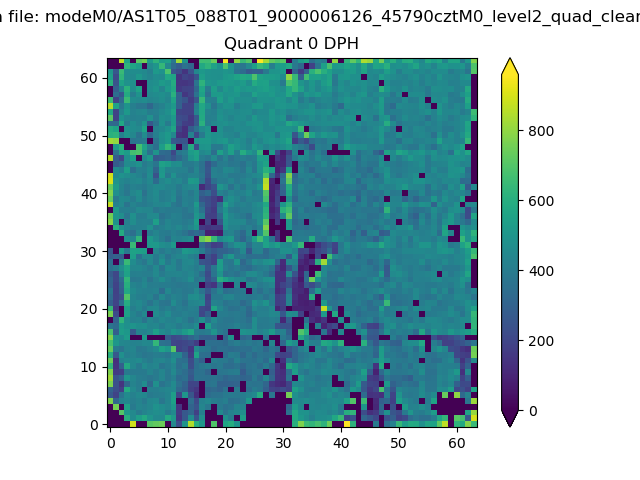 |
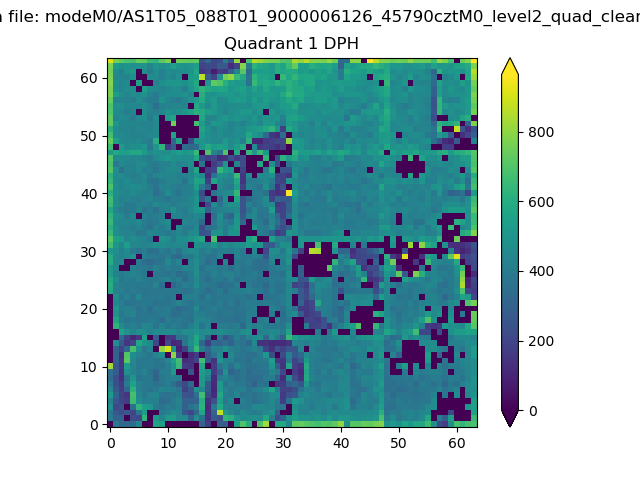 |
Quadrant B |
|---|---|---|---|
| Quadrant D | 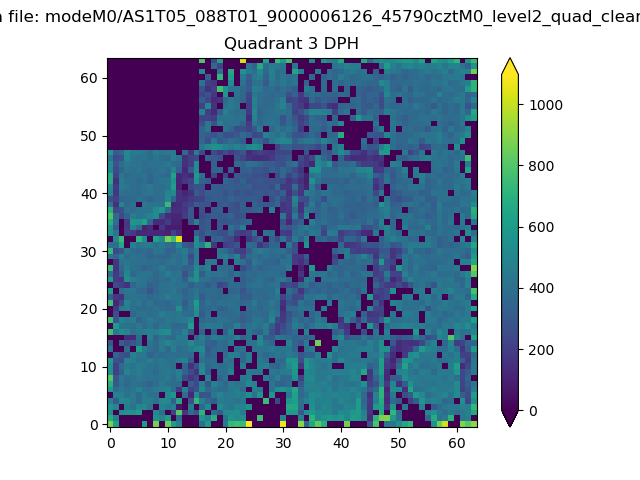 |
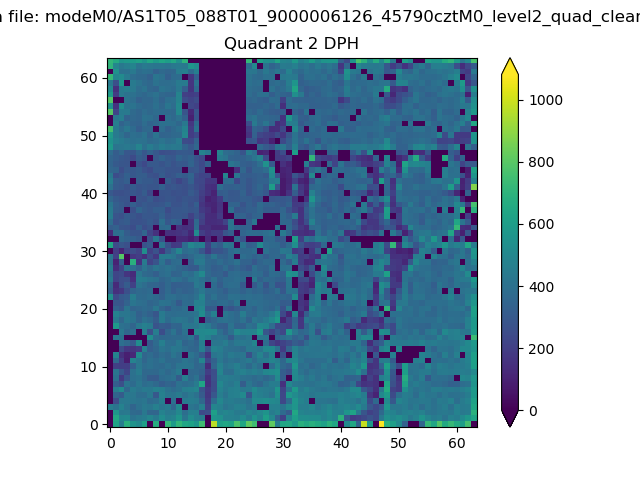 |
Quadrant C |
| Plot type | Count rate plots | Images |
|---|---|---|
| Comparison with Poisson distribution Blue bars denote a histogram of data divided into 1 sec bins. Red curve is a Poisson curve with rate = median count rate of data. |
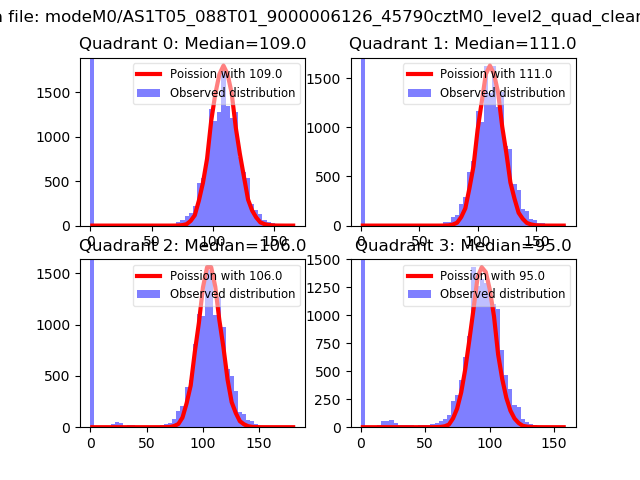 |
 |
| Quadrant-wise count rates Data is divided into 100 sec bins |
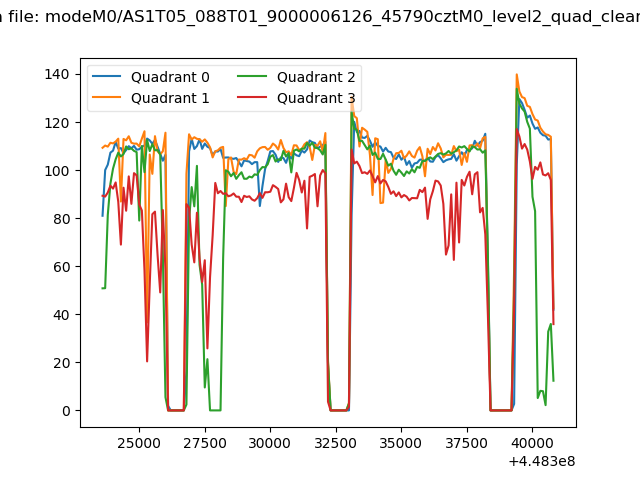 |
|
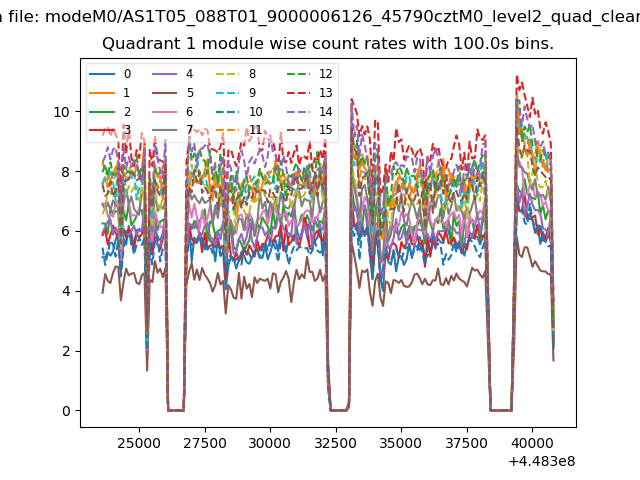
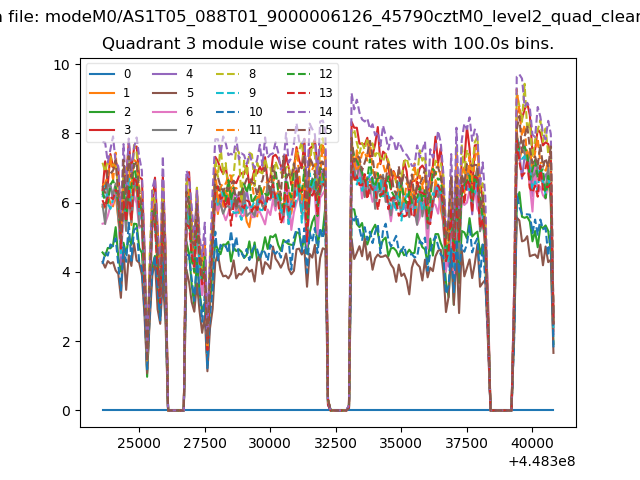
| Module-wise count rates for Quadrant A Data is divided into 100 sec bins |
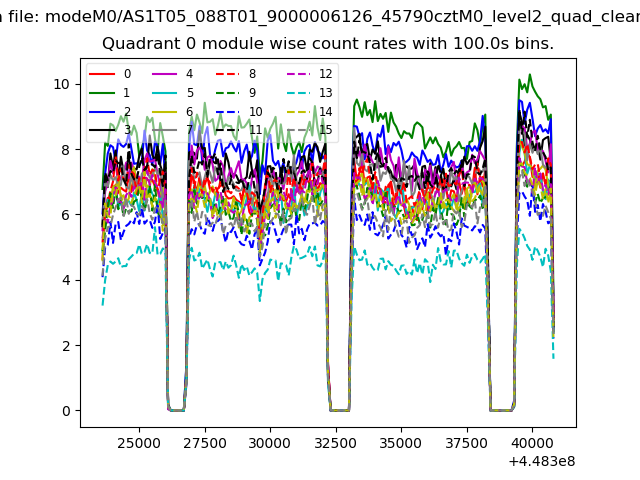 |
 |
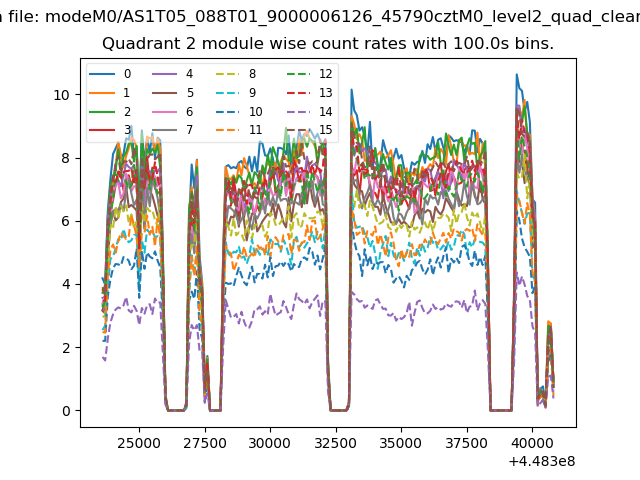
| Module-wise count rates for Quadrant B Data is divided into 100 sec bins |
 |
 |
| Module-wise count rates for Quadrant C Data is divided into 100 sec bins |
 |
 |
| Module-wise count rates for Quadrant D Data is divided into 100 sec bins |
 |
 |
| Parameter | Plot |
|---|---|
| CZT HV Monitor | 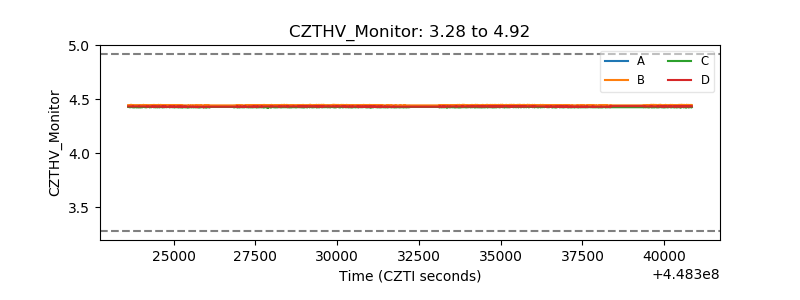 |
| D_VDD | 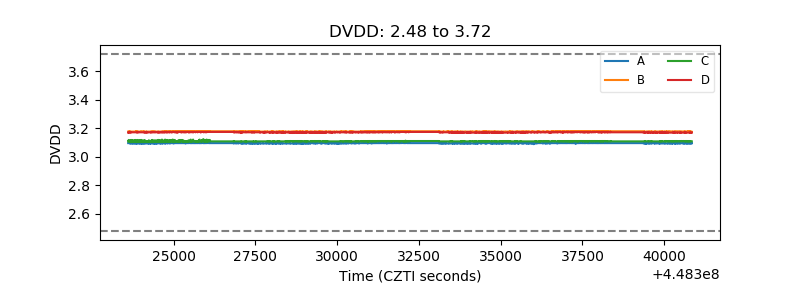 |
| Temperature 1 | 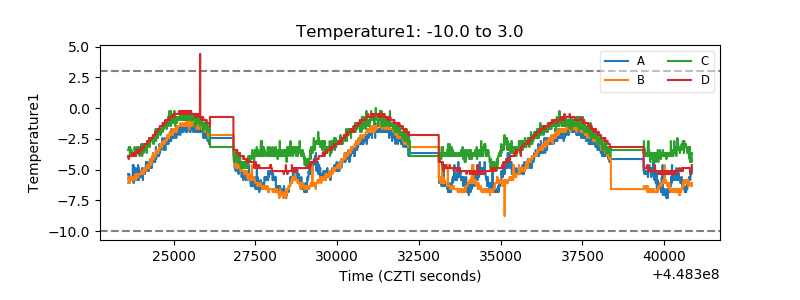 |
| Veto HV Monitor |  |
| Veto LLD | 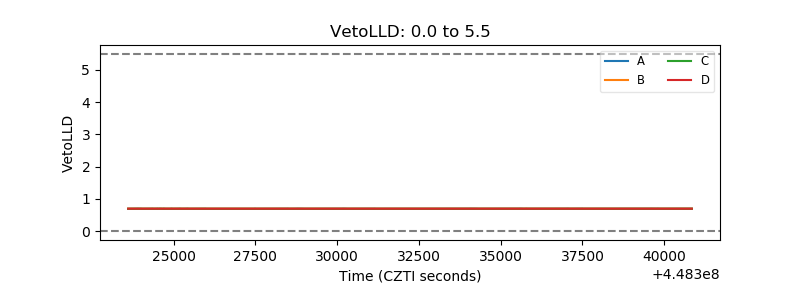 |
| Alpha Counter | 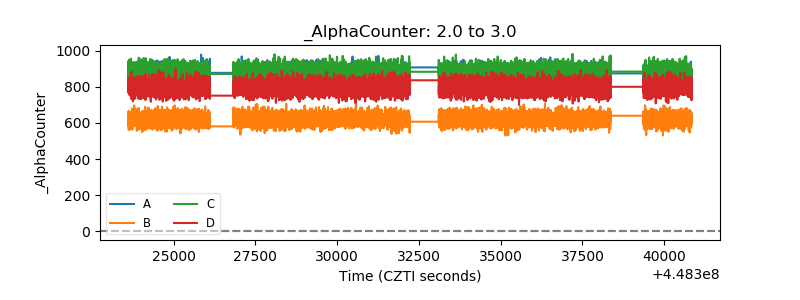 |
| _CPM_Rate | 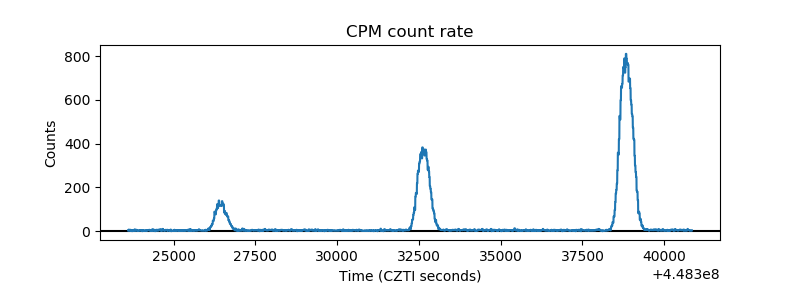 |
| CZT Counter | 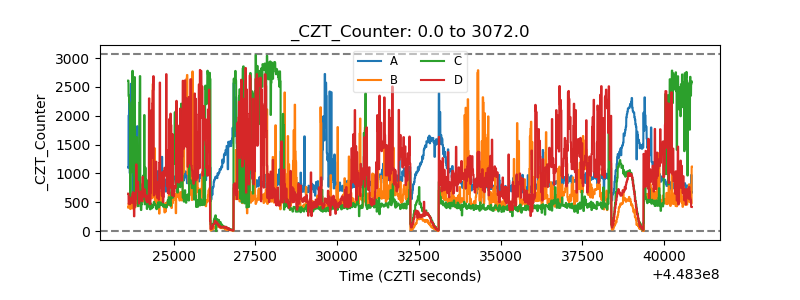 |
| +2.5 Volts monitor | 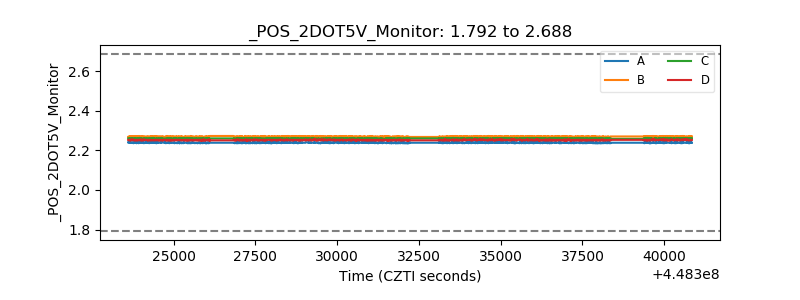 |
| +5 Volts monitor | 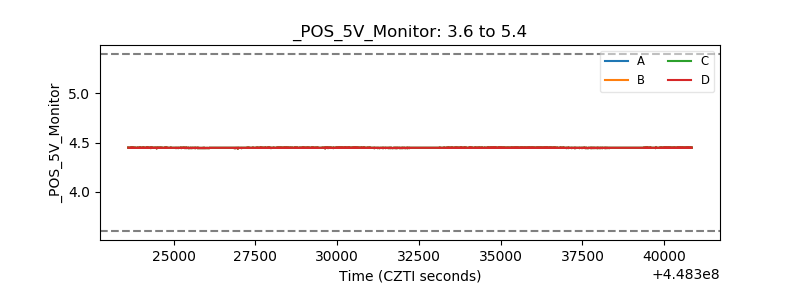 |
| _ROLL_ROT | 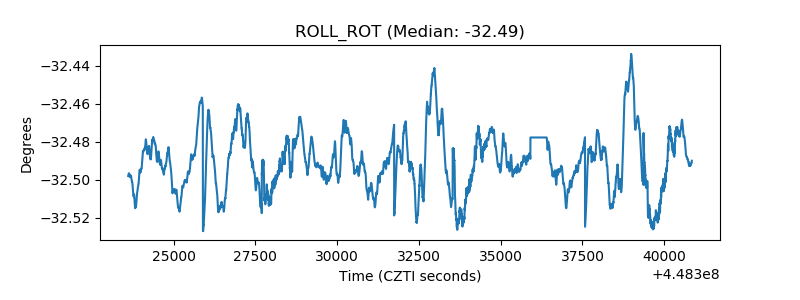 |
| _Roll_DEC | 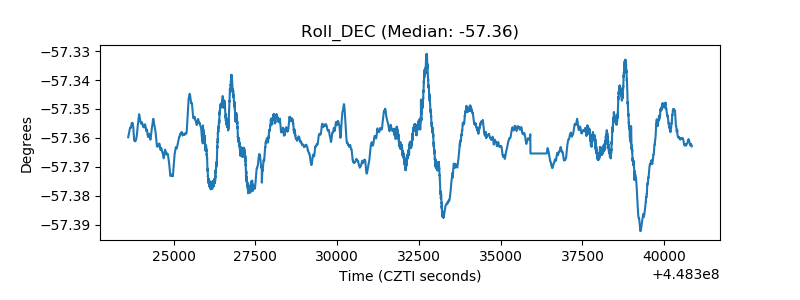 |
| _Roll_RA | 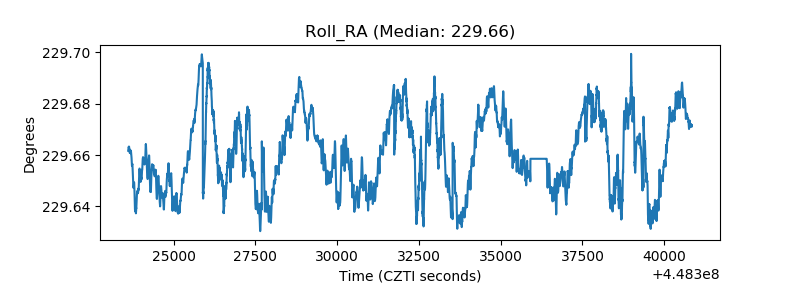 |
| Veto Counter | 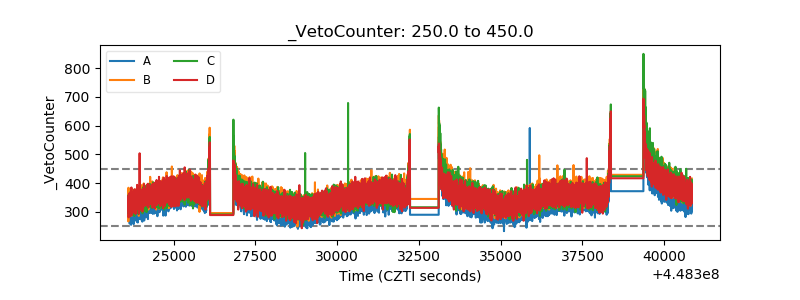 |