| Param | Original file | Final file |
|---|---|---|
| Filename | modeM0/AS1T05_088T01_9000006126_45791cztM0_level2.fits | modeM0/AS1T05_088T01_9000006126_45791cztM0_level2_quad_clean.evt |
| Size (bytes) | 662,624,640 | 106,594,560 |
| Size | 631.9 MB | 101.7 MB |
| Events in quadrant A | 5,922,082 | 732,202 |
| Events in quadrant B | 5,576,262 | 738,585 |
| Events in quadrant C | 5,522,812 | 661,621 |
| Events in quadrant D | 7,005,806 | 642,521 |
| Mode M9 | |||
|---|---|---|---|
| Quadrant | BADHDUFLAG | Total packets | Discarded packets |
| A | 0 | 13 | 0 |
| B | 0 | 14 | 0 |
| C | 0 | 14 | 0 |
| D | 0 | 14 | 0 |
| Mode M0 | |||
|---|---|---|---|
| Quadrant | BADHDUFLAG | Total packets | Discarded packets |
| A | 0 | 21854 | 2 |
| B | 0 | 21006 | 2 |
| C | 0 | 20713 | 2 |
| D | 0 | 25415 | 2 |
| Mode SS | |||
|---|---|---|---|
| Quadrant | BADHDUFLAG | Total packets | Discarded packets |
| A | 0 | 132 | 0 |
| B | 0 | 132 | 0 |
| C | 0 | 132 | 0 |
| D | 0 | 132 | 0 |
| Quadrant | Total seconds | Saturated seconds | Saturation percentage |
|---|---|---|---|
| A | 6486 | 200 | 3.083565% |
| B | 6486 | 515 | 7.940179% |
| C | 6486 | 866 | 13.351835% |
| D | 6486 | 501 | 7.724329% |
Noise dominated data is calculated using 1-second bins in cleaned event files. If a bin has >2000 counts, and if more than 50% of those come from <1% of pixels, then it is considered to be noise-dominated and hence unusable.
| Quadrant | # 1 sec bins | Bins with >0 counts | Bins with >2000 counts | High rate bins dominated by noise | Noise dominated (total time) | Noise dominated (detector-on time) | Marked lightcurve |
|---|---|---|---|---|---|---|---|
| A | 7606 | 6487 | 48 | 48 | 0.63% | 0.74% | 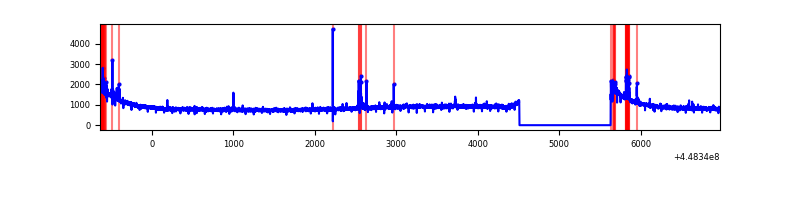 |
| B | 7606 | 6487 | 328 | 328 | 4.31% | 5.06% | 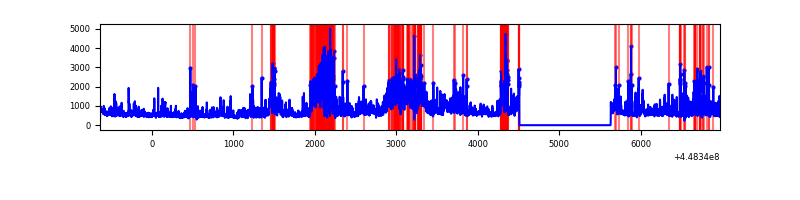 |
| C | 7606 | 6487 | 770 | 770 | 10.12% | 11.87% | 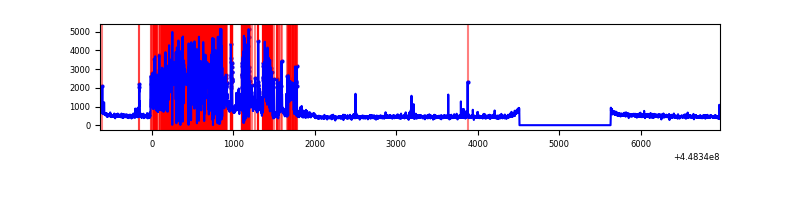 |
| D | 7606 | 6487 | 465 | 465 | 6.11% | 7.17% | 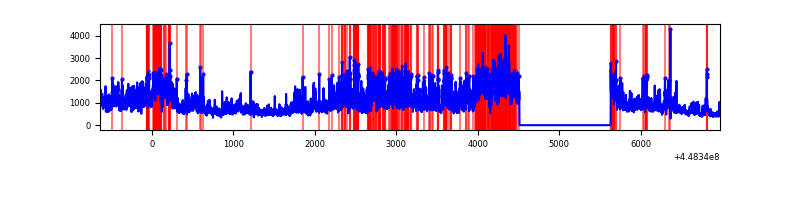 |
Top three noisy pixels from each quadrant. If the there are fewer than three noisy pixels in the level2.evt file, extra rows are filled as -1
| Pixel properties | Quadrant properties | ||||||
|---|---|---|---|---|---|---|---|
| Quadrant | DetID | PixID | Counts | Sigma | Mean | Median | Sigma |
| A | 10 | 83 | 2932715 | 19235.87 | 740 | 724 | 152.4 |
| A | 13 | 248 | 109190 | 711.61 | 740 | 724 | 152.4 |
| A | 13 | 254 | 11880 | 73.19 | 740 | 724 | 152.4 |
| B | 3 | 112 | 2178144 | 15386.84 | 733 | 712 | 141.5 |
| B | 5 | 172 | 168022 | 1182.3 | 733 | 712 | 141.5 |
| B | 4 | 171 | 105260 | 738.79 | 733 | 712 | 141.5 |
| C | 12 | 2 | 2784065 | 17354.37 | 690 | 695 | 160.4 |
| C | 2 | 14 | 28850 | 175.54 | 690 | 695 | 160.4 |
| C | 3 | 233 | 11533 | 67.57 | 690 | 695 | 160.4 |
| D | 11 | 241 | 3427749 | 18654.08 | 725 | 702 | 183.7 |
| D | 8 | 48 | 223270 | 1211.48 | 725 | 702 | 183.7 |
| D | 1 | 52 | 168214 | 911.8 | 725 | 702 | 183.7 |
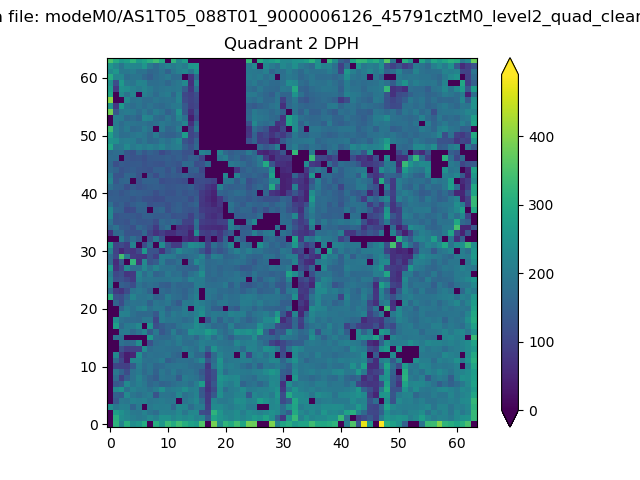
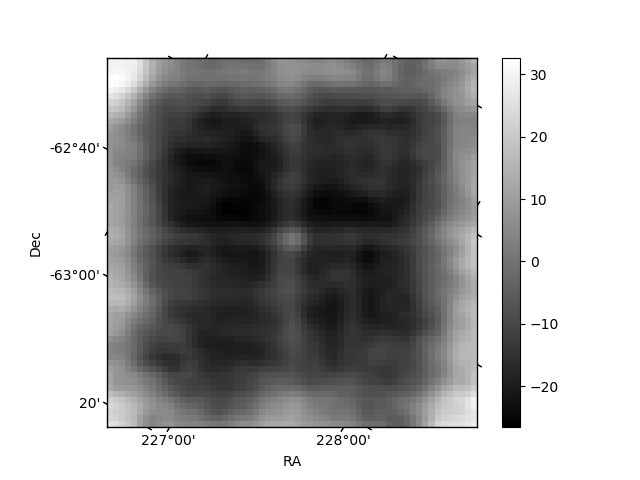
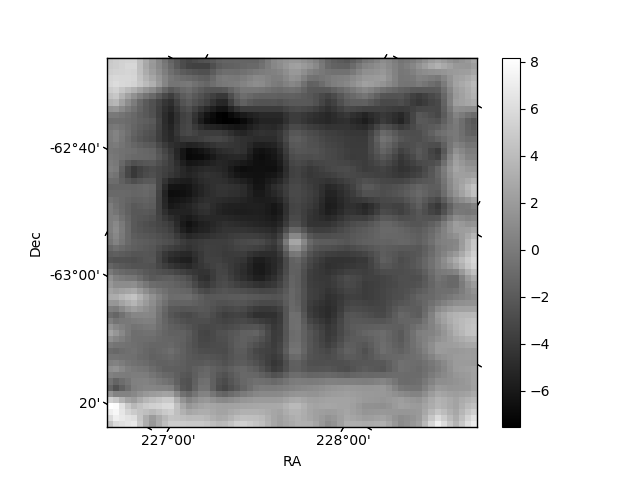
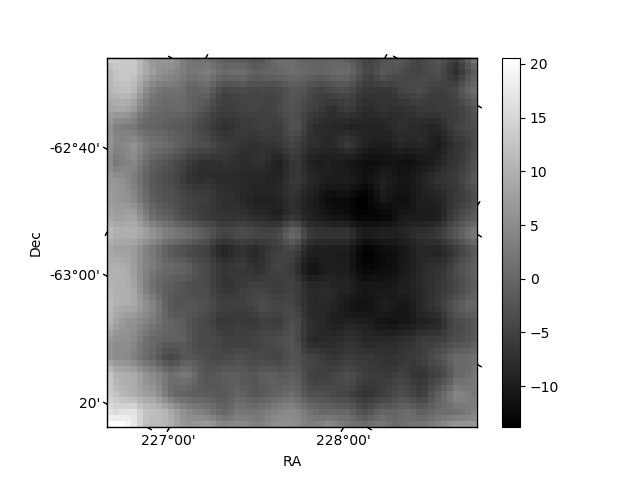
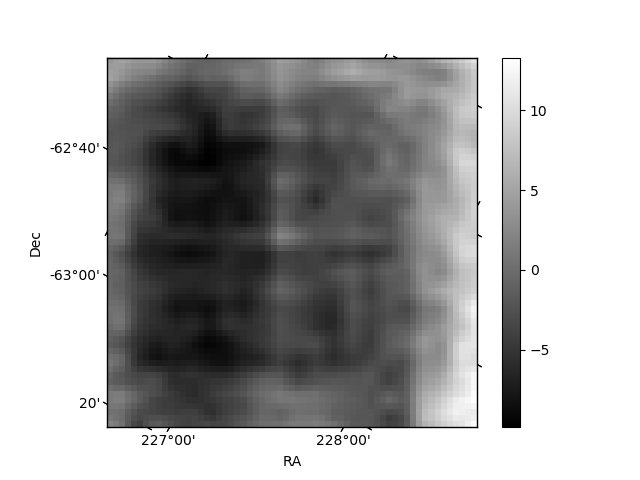
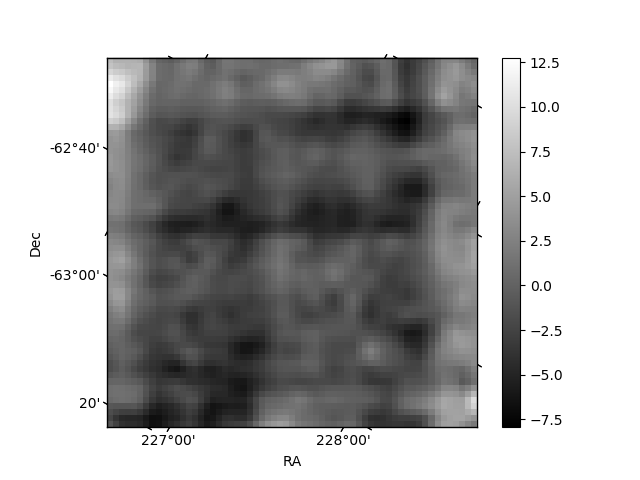
Histogram calculated using DETX and DETY for each event in the final _common_clean file
| Quadrant A | 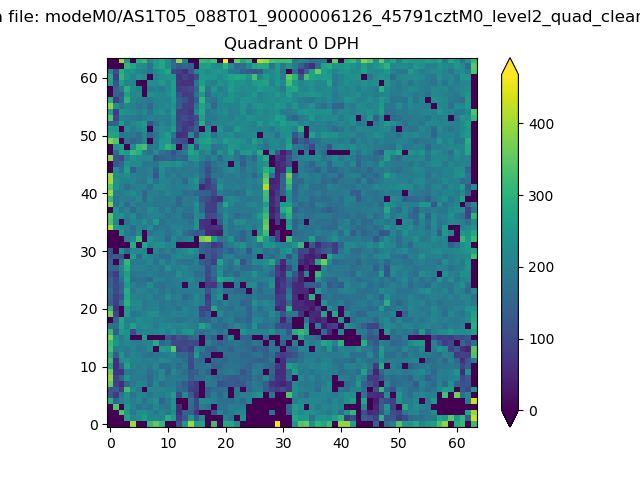 |
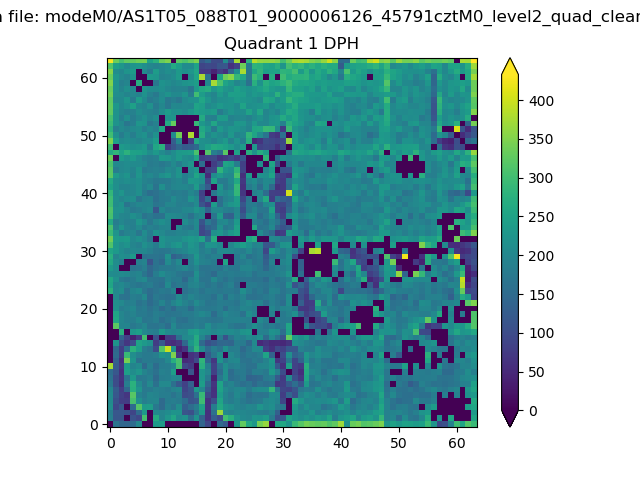 |
Quadrant B |
|---|---|---|---|
| Quadrant D | 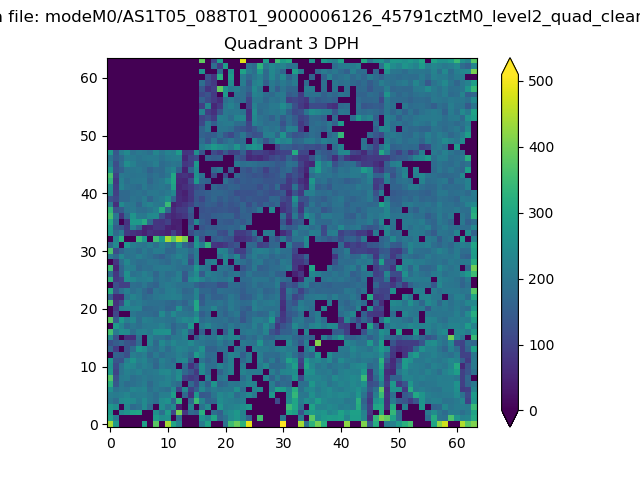 |
 |
Quadrant C |
| Plot type | Count rate plots | Images |
|---|---|---|
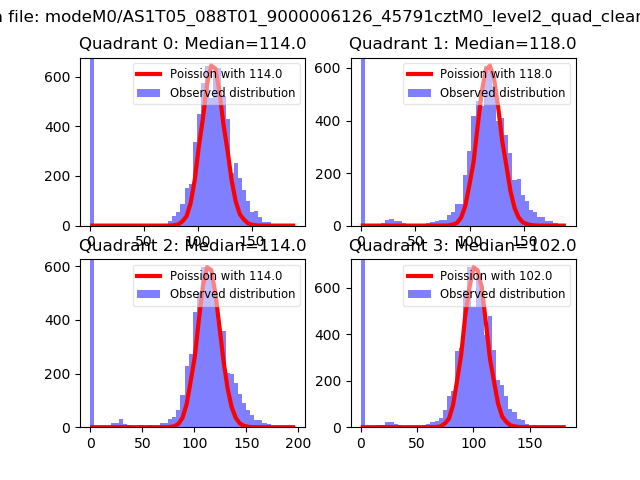
| Comparison with Poisson distribution Blue bars denote a histogram of data divided into 1 sec bins. Red curve is a Poisson curve with rate = median count rate of data. |
 |
 |
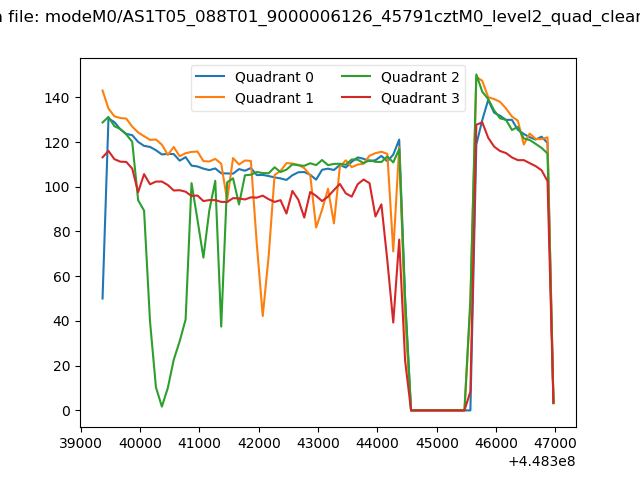
| Quadrant-wise count rates Data is divided into 100 sec bins |
 |
|
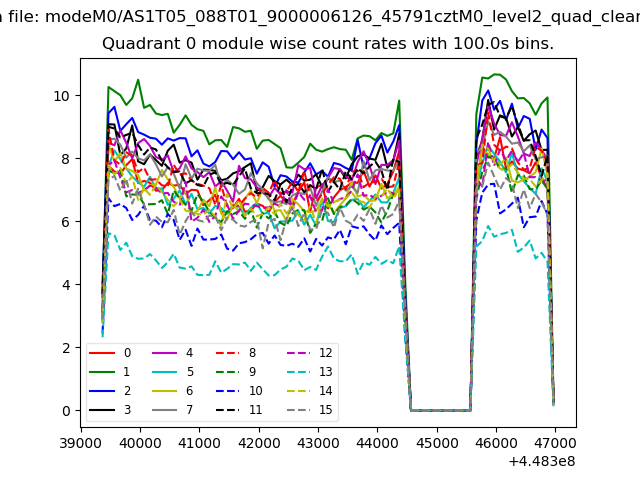
| Module-wise count rates for Quadrant A Data is divided into 100 sec bins |
 |
 |
| Module-wise count rates for Quadrant B Data is divided into 100 sec bins |
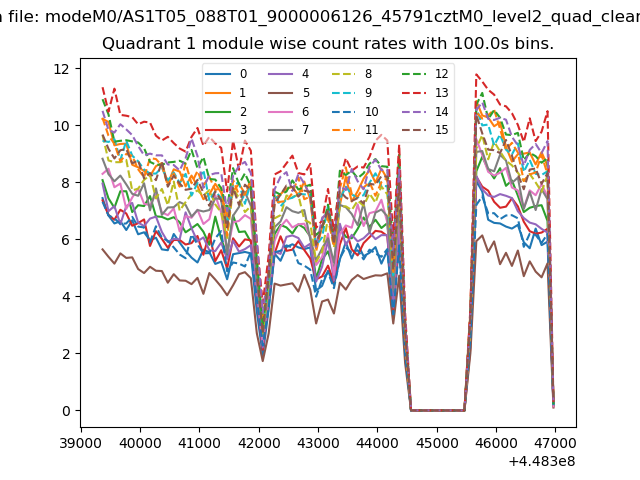 |
 |
| Module-wise count rates for Quadrant C Data is divided into 100 sec bins |
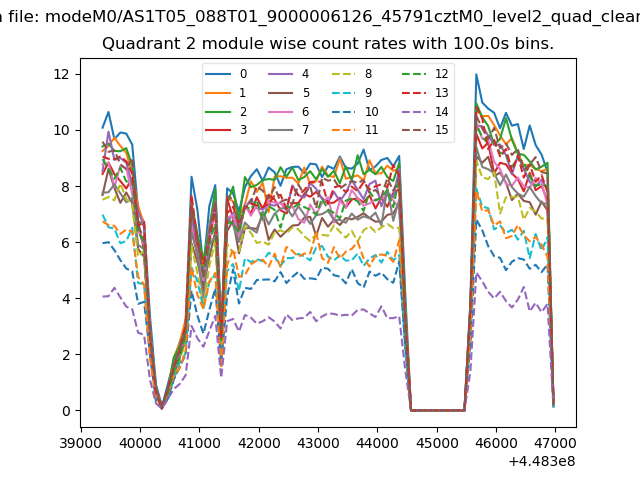 |
 |
| Module-wise count rates for Quadrant D Data is divided into 100 sec bins |
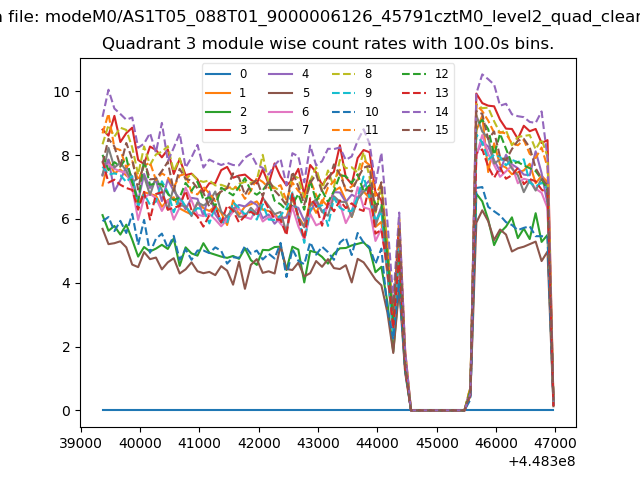 |
 |
| Parameter | Plot |
|---|---|
| CZT HV Monitor | 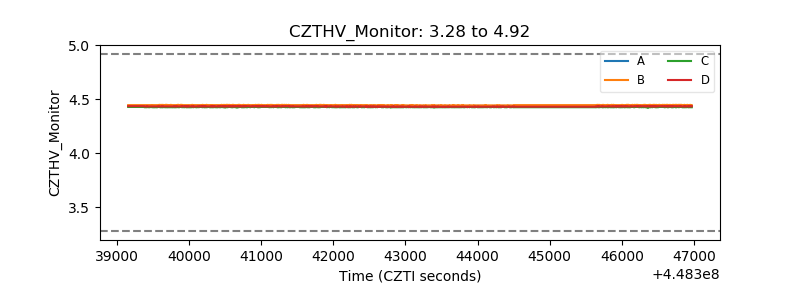 |
| D_VDD | 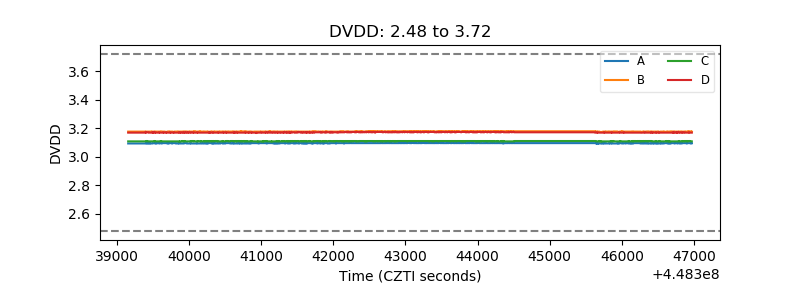 |
| Temperature 1 | 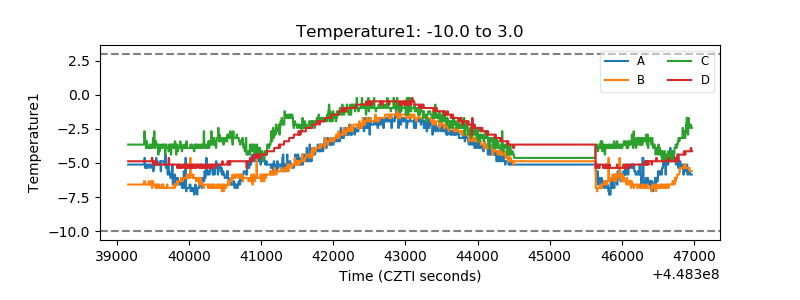 |
| Veto HV Monitor | 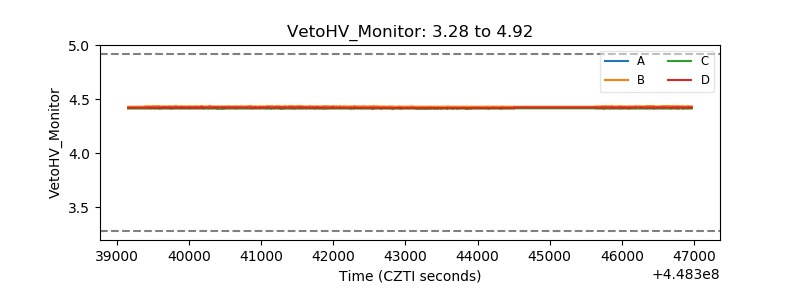 |
| Veto LLD | 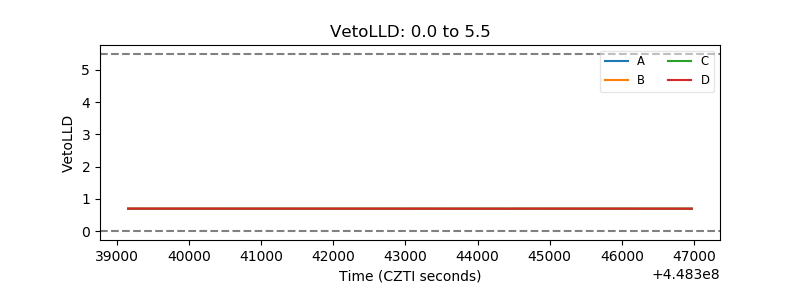 |
| Alpha Counter | 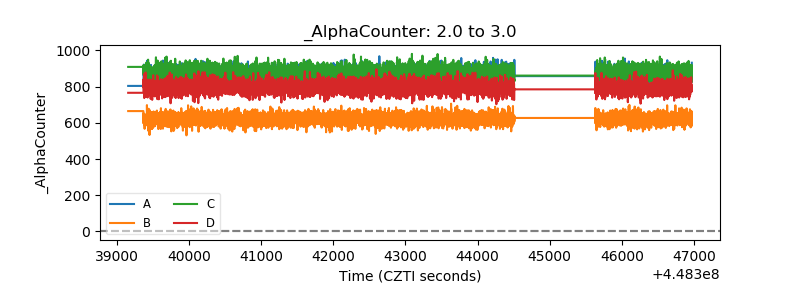 |
| _CPM_Rate | 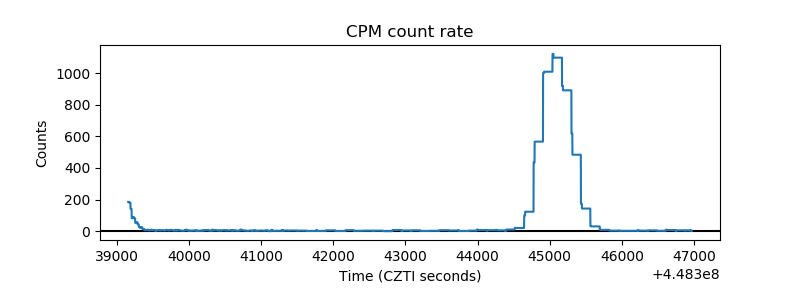 |
| CZT Counter | 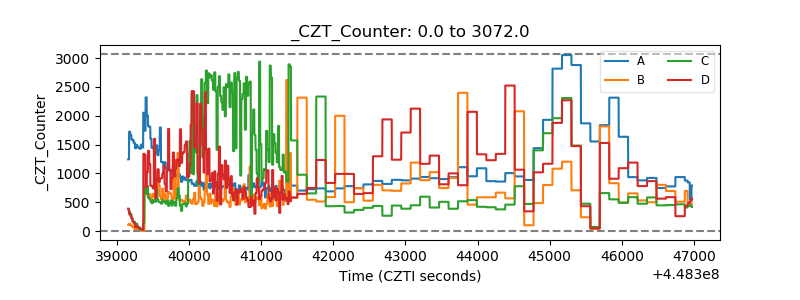 |
| +2.5 Volts monitor |  |
| +5 Volts monitor | 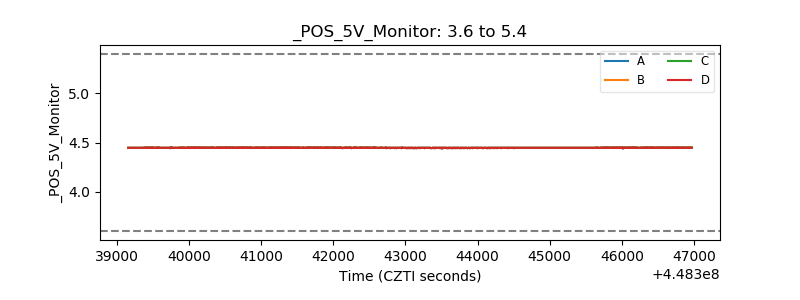 |
| _ROLL_ROT | 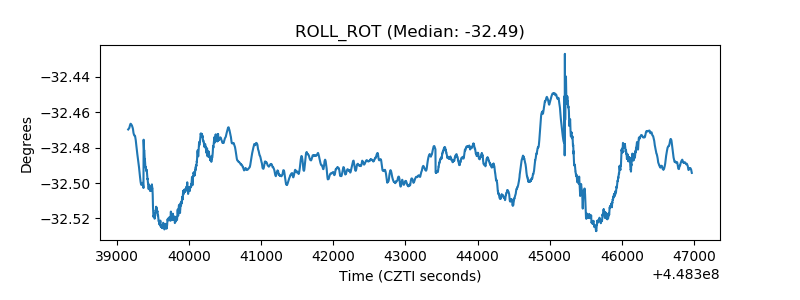 |
| _Roll_DEC | 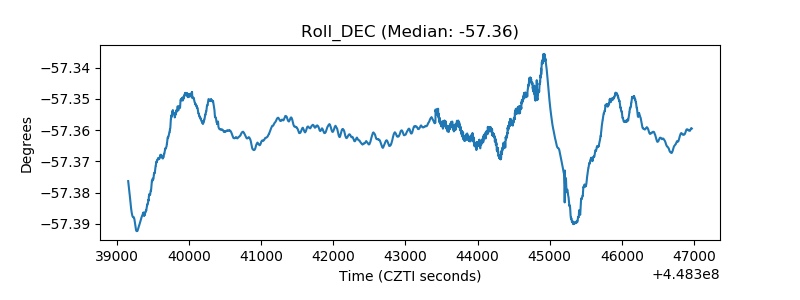 |
| _Roll_RA | 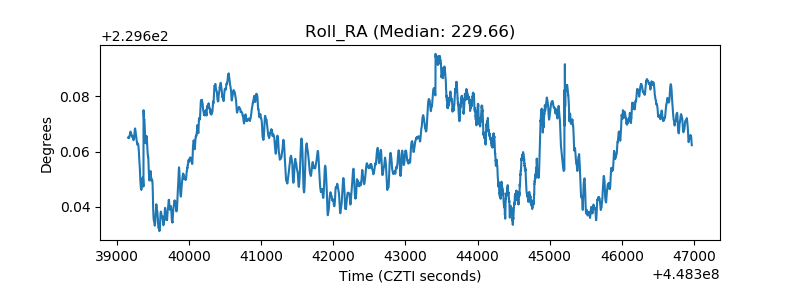 |
| Veto Counter | 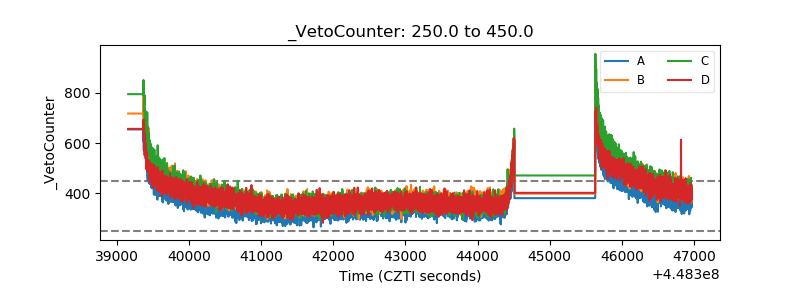 |