| Param | Original file | Final file |
|---|---|---|
| Filename | modeM0/AS1T05_088T01_9000006126_45792cztM0_level2.fits | modeM0/AS1T05_088T01_9000006126_45792cztM0_level2_quad_clean.evt |
| Size (bytes) | 567,843,840 | 102,329,280 |
| Size | 541.5 MB | 97.6 MB |
| Events in quadrant A | 5,407,963 | 699,299 |
| Events in quadrant B | 5,825,675 | 680,730 |
| Events in quadrant C | 2,858,661 | 707,782 |
| Events in quadrant D | 6,467,183 | 594,751 |
| Mode M9 | |||
|---|---|---|---|
| Quadrant | BADHDUFLAG | Total packets | Discarded packets |
| A | 0 | 12 | 0 |
| B | 0 | 12 | 0 |
| C | 0 | 12 | 0 |
| D | 0 | 12 | 0 |
| Mode M0 | |||
|---|---|---|---|
| Quadrant | BADHDUFLAG | Total packets | Discarded packets |
| A | 0 | 19790 | 1 |
| B | 0 | 21574 | 1 |
| C | 0 | 12457 | 1 |
| D | 0 | 23256 | 1 |
| Mode SS | |||
|---|---|---|---|
| Quadrant | BADHDUFLAG | Total packets | Discarded packets |
| A | 0 | 122 | 0 |
| B | 0 | 122 | 0 |
| C | 0 | 122 | 0 |
| D | 0 | 122 | 0 |
| Quadrant | Total seconds | Saturated seconds | Saturation percentage |
|---|---|---|---|
| A | 5951 | 138 | 2.318938% |
| B | 5952 | 626 | 10.517473% |
| C | 5952 | 41 | 0.688844% |
| D | 5952 | 638 | 10.719086% |
Noise dominated data is calculated using 1-second bins in cleaned event files. If a bin has >2000 counts, and if more than 50% of those come from <1% of pixels, then it is considered to be noise-dominated and hence unusable.
| Quadrant | # 1 sec bins | Bins with >0 counts | Bins with >2000 counts | High rate bins dominated by noise | Noise dominated (total time) | Noise dominated (detector-on time) | Marked lightcurve |
|---|---|---|---|---|---|---|---|
| A | 7141 | 5952 | 26 | 26 | 0.36% | 0.44% | 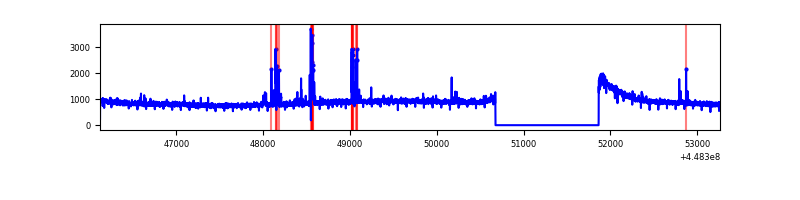 |
| B | 7142 | 5953 | 427 | 427 | 5.98% | 7.17% | 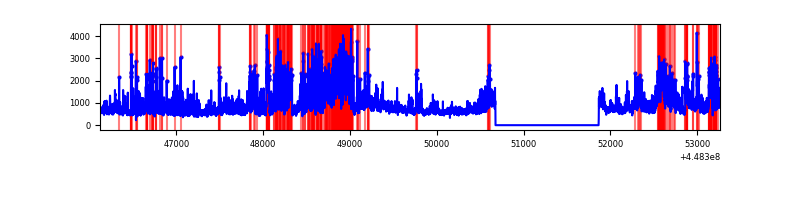 |
| C | 7142 | 5953 | 18 | 18 | 0.25% | 0.30% | 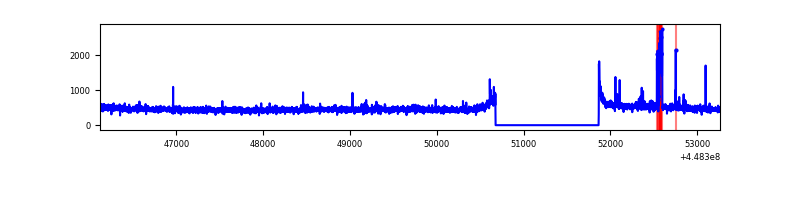 |
| D | 7142 | 5953 | 673 | 673 | 9.42% | 11.31% | 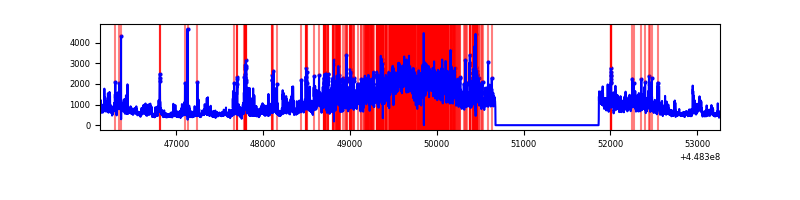 |
Top three noisy pixels from each quadrant. If the there are fewer than three noisy pixels in the level2.evt file, extra rows are filled as -1
| Pixel properties | Quadrant properties | ||||||
|---|---|---|---|---|---|---|---|
| Quadrant | DetID | PixID | Counts | Sigma | Mean | Median | Sigma |
| A | 10 | 83 | 2562549 | 17981.03 | 693 | 679 | 142.5 |
| A | 13 | 248 | 62628 | 434.8 | 693 | 679 | 142.5 |
| A | 4 | 0 | 45283 | 313.06 | 693 | 679 | 142.5 |
| B | 3 | 112 | 2923409 | 22292.74 | 675 | 655 | 131.1 |
| B | 4 | 171 | 85546 | 647.49 | 675 | 655 | 131.1 |
| B | 5 | 172 | 29663 | 221.25 | 675 | 655 | 131.1 |
| C | 9 | 54 | 82297 | 500.71 | 698 | 704 | 163.0 |
| C | 12 | 2 | 31357 | 188.11 | 698 | 704 | 163.0 |
| C | 2 | 14 | 17898 | 105.51 | 698 | 704 | 163.0 |
| D | 11 | 241 | 3353599 | 19843.75 | 674 | 653 | 169.0 |
| D | 13 | 249 | 117656 | 692.46 | 674 | 653 | 169.0 |
| D | 2 | 249 | 105243 | 619.0 | 674 | 653 | 169.0 |
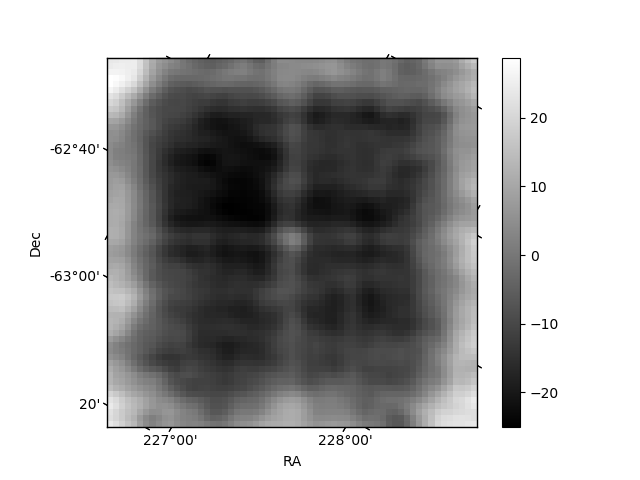
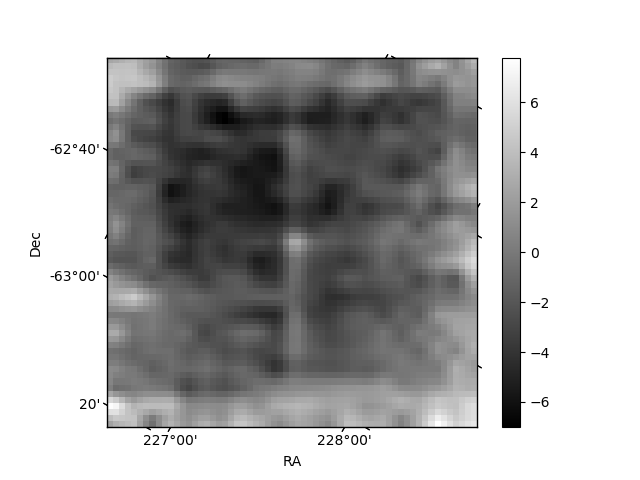
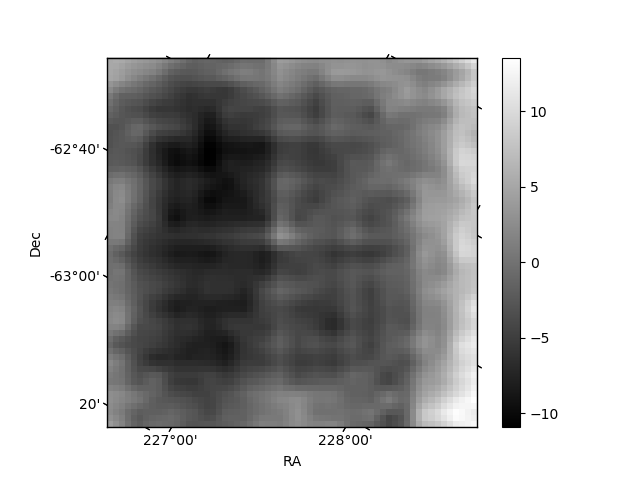
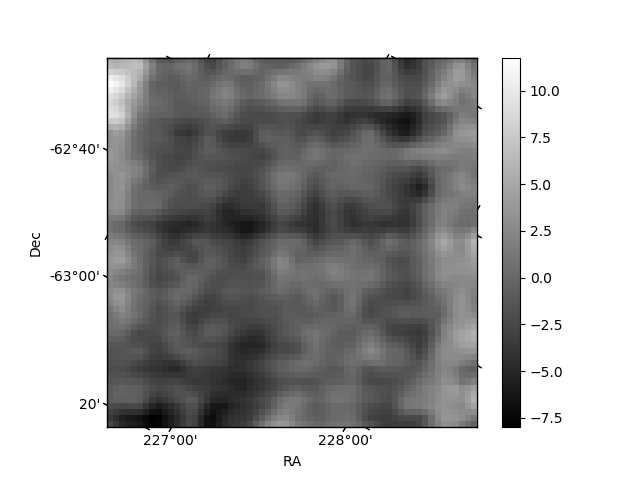
Histogram calculated using DETX and DETY for each event in the final _common_clean file
| Quadrant A | 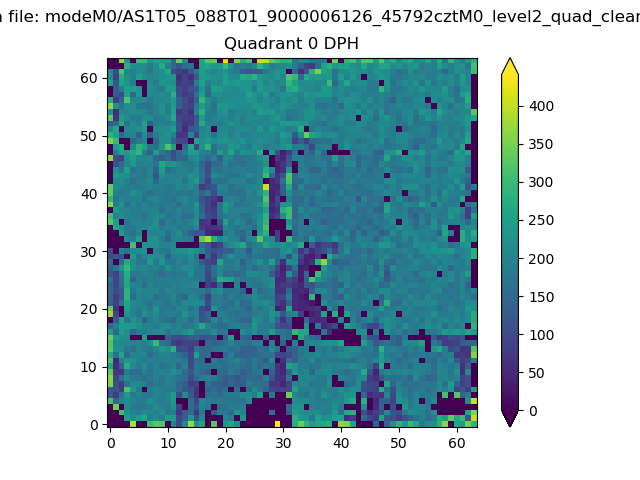 |
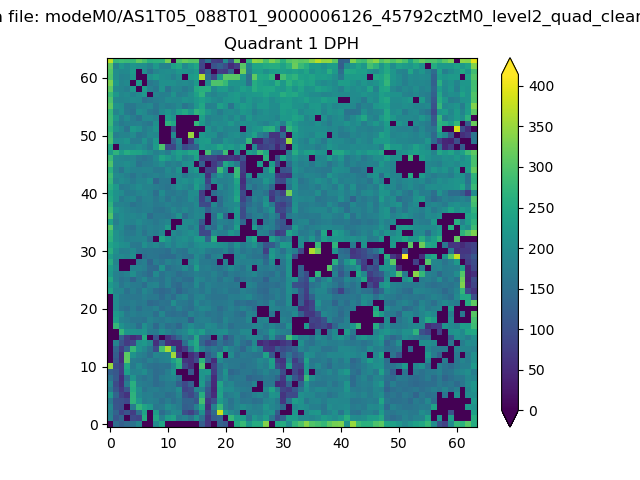 |
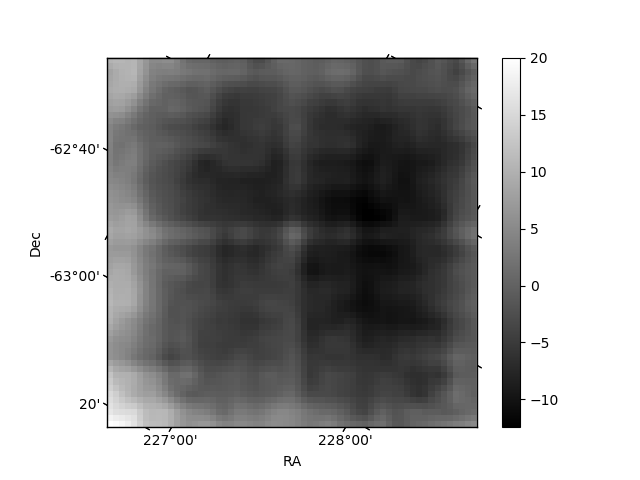
Quadrant B |
|---|---|---|---|
| Quadrant D | 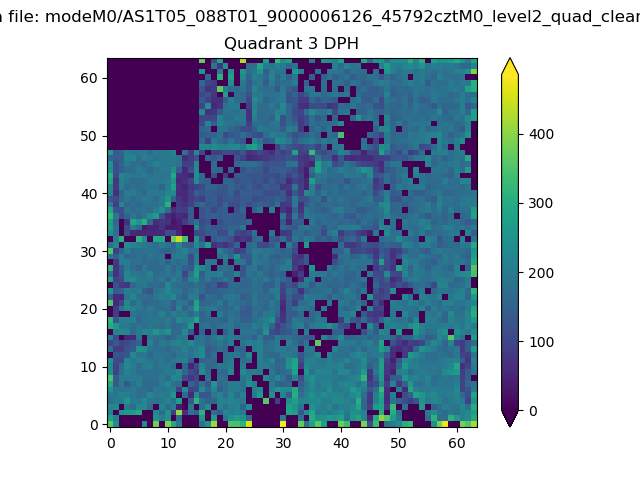 |
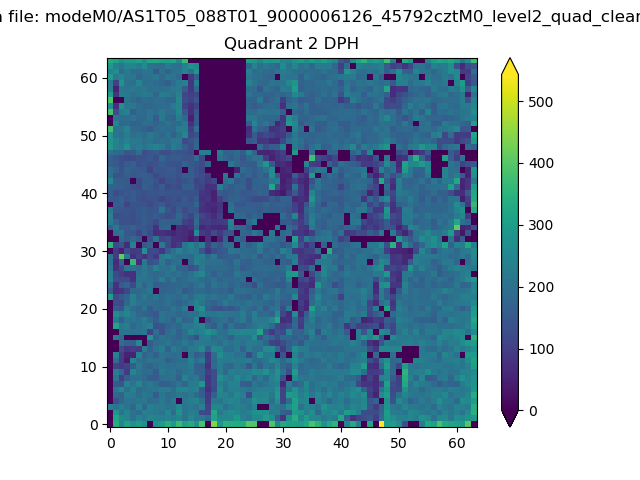 |
Quadrant C |
| Plot type | Count rate plots | Images |
|---|---|---|
| Comparison with Poisson distribution Blue bars denote a histogram of data divided into 1 sec bins. Red curve is a Poisson curve with rate = median count rate of data. |
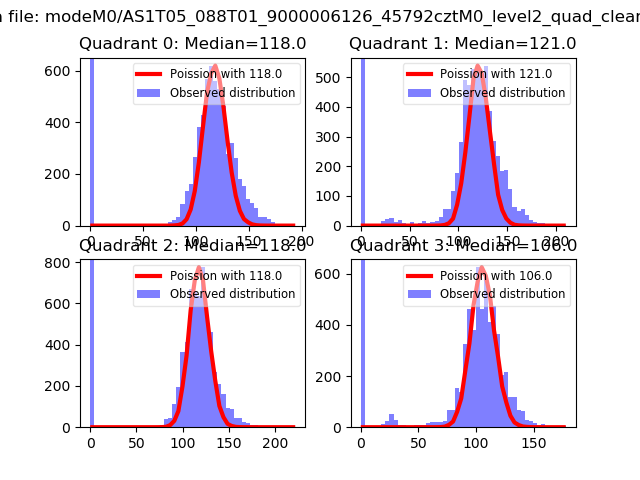 |
 |
| Quadrant-wise count rates Data is divided into 100 sec bins |
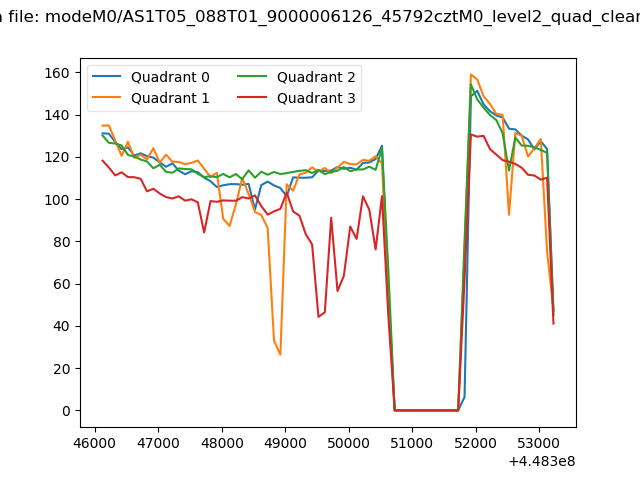 |
|
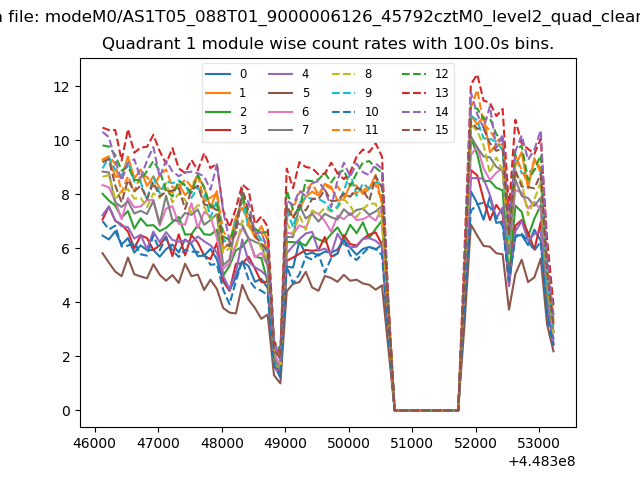
| Module-wise count rates for Quadrant A Data is divided into 100 sec bins |
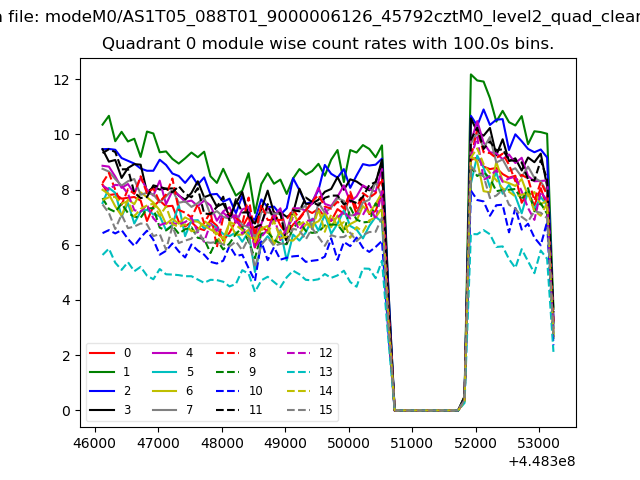 |
 |
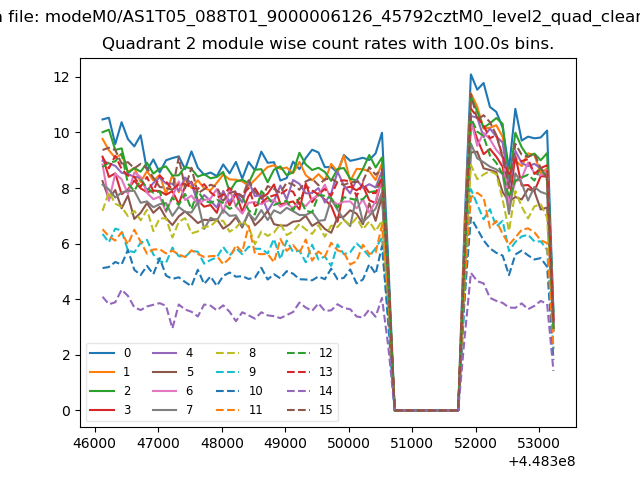
| Module-wise count rates for Quadrant B Data is divided into 100 sec bins |
 |
 |
| Module-wise count rates for Quadrant C Data is divided into 100 sec bins |
 |
 |
| Module-wise count rates for Quadrant D Data is divided into 100 sec bins |
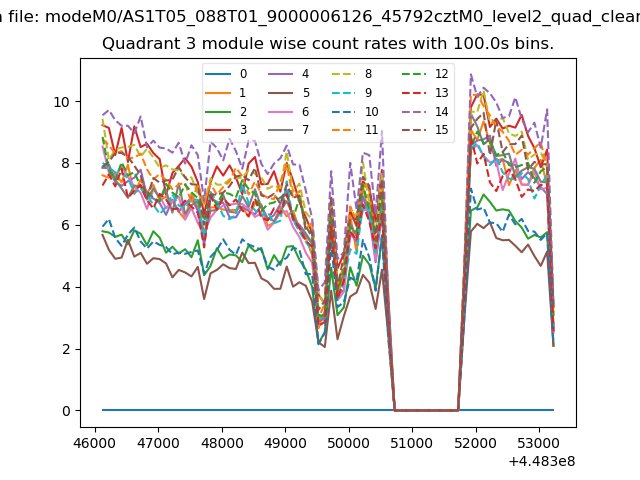 |
 |
| Parameter | Plot |
|---|---|
| CZT HV Monitor | 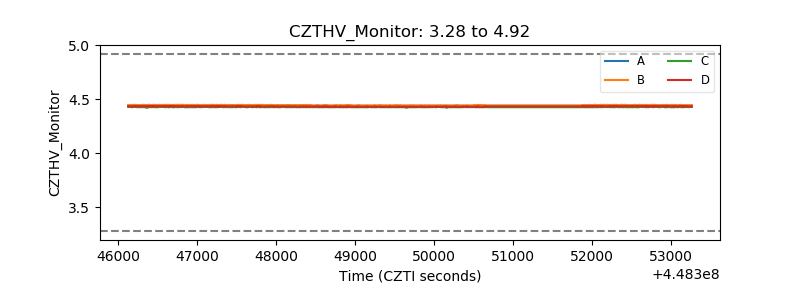 |
| D_VDD | 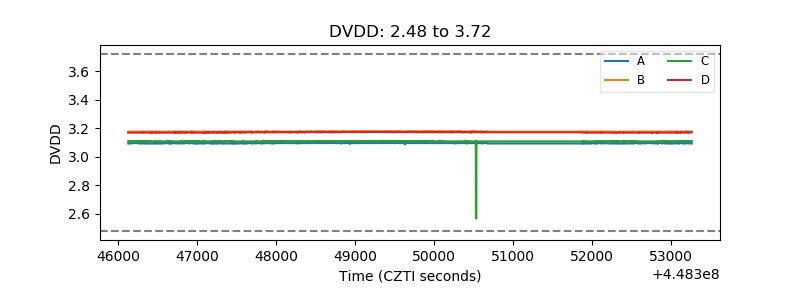 |
| Temperature 1 | 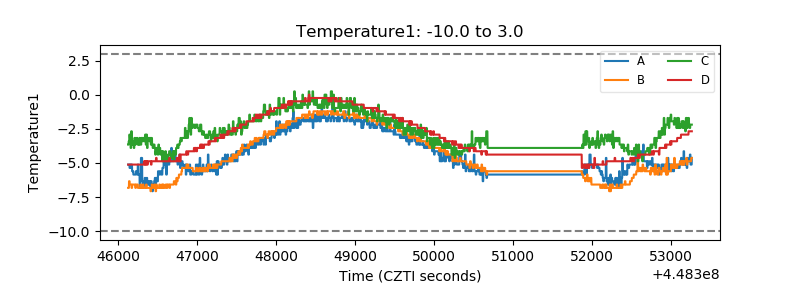 |
| Veto HV Monitor | 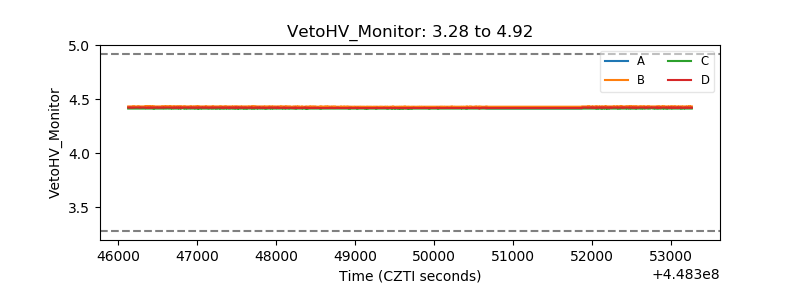 |
| Veto LLD | 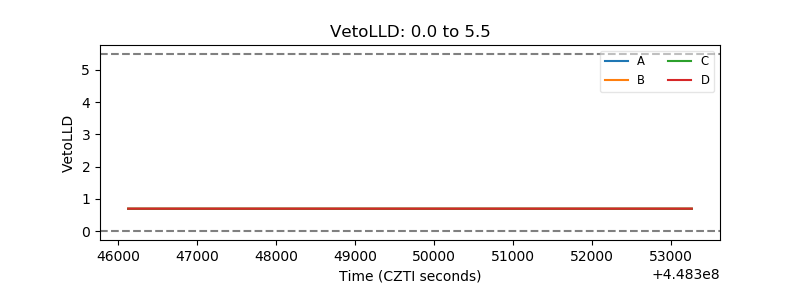 |
| Alpha Counter | 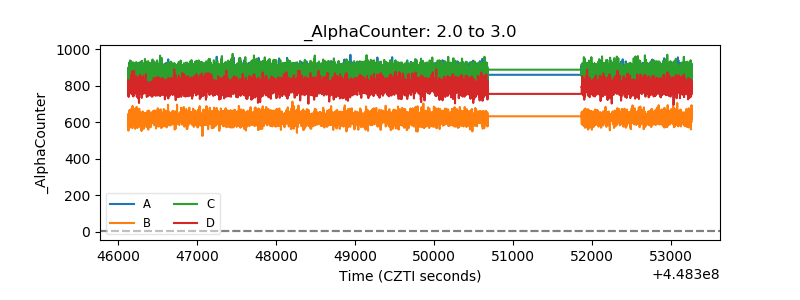 |
| _CPM_Rate | 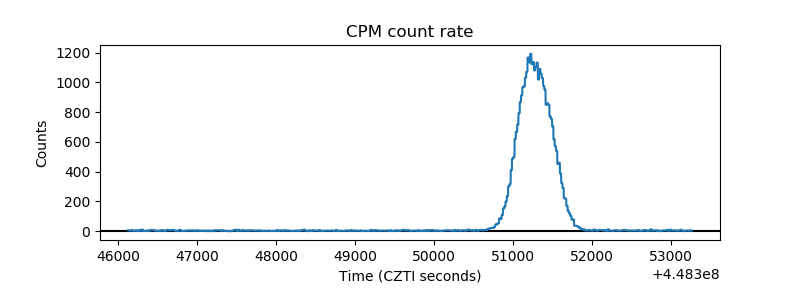 |
| CZT Counter | 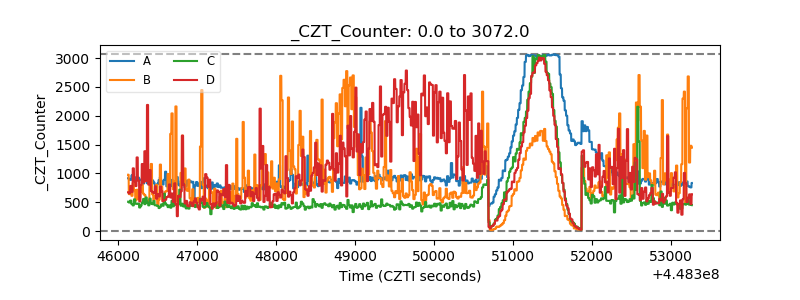 |
| +2.5 Volts monitor | 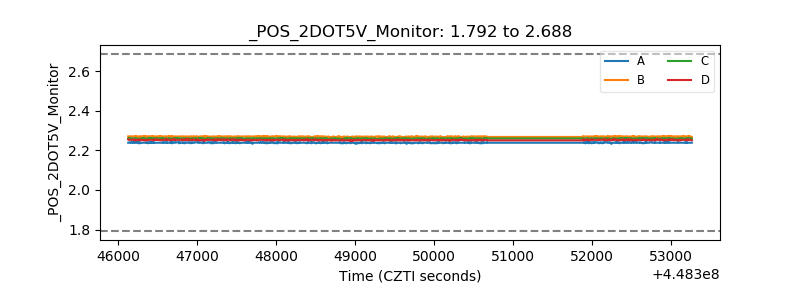 |
| +5 Volts monitor | 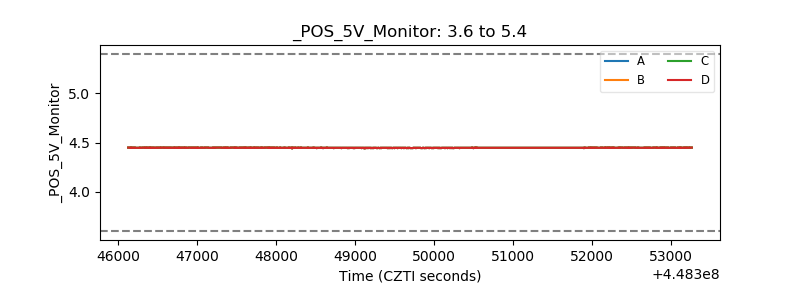 |
| _ROLL_ROT | 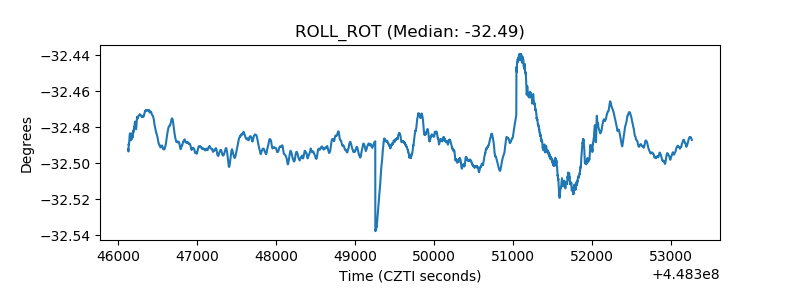 |
| _Roll_DEC | 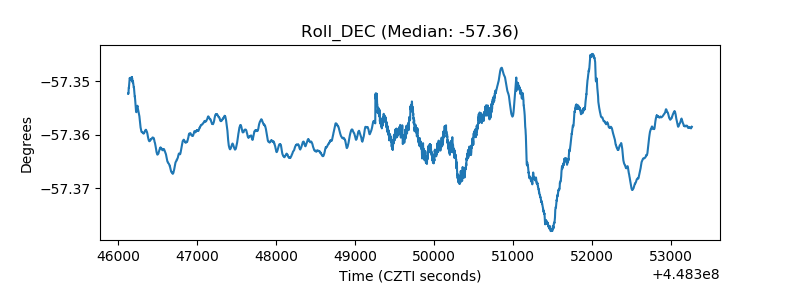 |
| _Roll_RA | 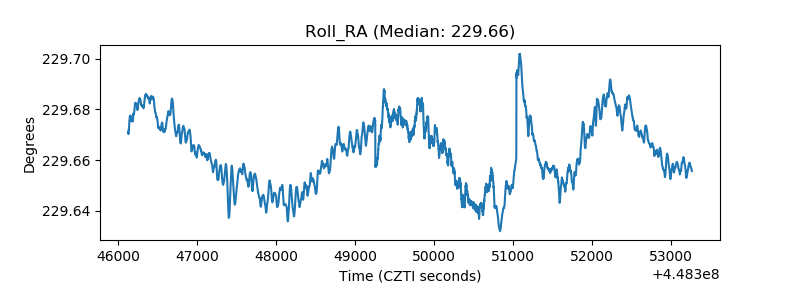 |
| Veto Counter | 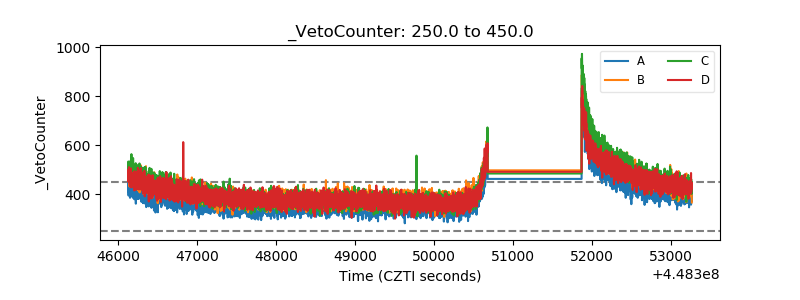 |