| Param | Original file | Final file |
|---|---|---|
| Filename | modeM0/AS1T05_088T01_9000006126_45793cztM0_level2.fits | modeM0/AS1T05_088T01_9000006126_45793cztM0_level2_quad_clean.evt |
| Size (bytes) | 621,777,600 | 102,516,480 |
| Size | 593.0 MB | 97.8 MB |
| Events in quadrant A | 5,541,092 | 713,414 |
| Events in quadrant B | 5,851,270 | 712,522 |
| Events in quadrant C | 4,160,088 | 668,716 |
| Events in quadrant D | 7,003,650 | 593,894 |
| Mode M9 | |||
|---|---|---|---|
| Quadrant | BADHDUFLAG | Total packets | Discarded packets |
| A | 0 | 12 | 0 |
| B | 0 | 12 | 0 |
| C | 0 | 12 | 0 |
| D | 0 | 12 | 0 |
| Mode M0 | |||
|---|---|---|---|
| Quadrant | BADHDUFLAG | Total packets | Discarded packets |
| A | 0 | 20155 | 22 |
| B | 0 | 21750 | 24 |
| C | 0 | 16186 | 14 |
| D | 0 | 24984 | 12 |
| Mode SS | |||
|---|---|---|---|
| Quadrant | BADHDUFLAG | Total packets | Discarded packets |
| A | 0 | 120 | 0 |
| B | 0 | 120 | 0 |
| C | 0 | 120 | 0 |
| D | 0 | 120 | 0 |
| Quadrant | Total seconds | Saturated seconds | Saturation percentage |
|---|---|---|---|
| A | 5952 | 184 | 3.091398% |
| B | 5952 | 502 | 8.434140% |
| C | 5952 | 549 | 9.223790% |
| D | 5954 | 854 | 14.343299% |
Noise dominated data is calculated using 1-second bins in cleaned event files. If a bin has >2000 counts, and if more than 50% of those come from <1% of pixels, then it is considered to be noise-dominated and hence unusable.
| Quadrant | # 1 sec bins | Bins with >0 counts | Bins with >2000 counts | High rate bins dominated by noise | Noise dominated (total time) | Noise dominated (detector-on time) | Marked lightcurve |
|---|---|---|---|---|---|---|---|
| A | 7398 | 5954 | 18 | 18 | 0.24% | 0.30% | 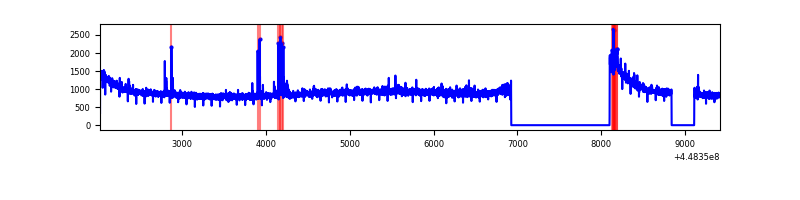 |
| B | 7399 | 5955 | 288 | 288 | 3.89% | 4.84% | 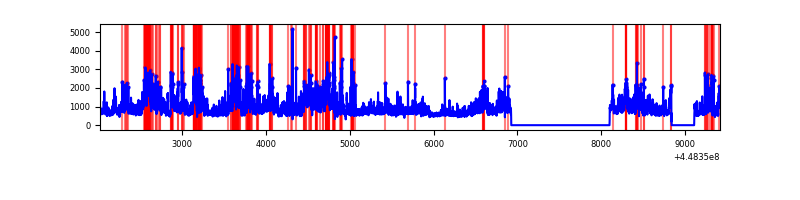 |
| C | 7399 | 5954 | 389 | 389 | 5.26% | 6.53% | 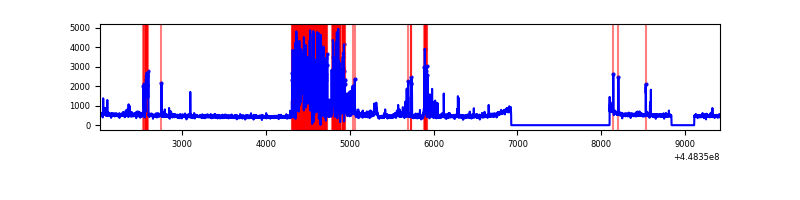 |
| D | 7399 | 5956 | 812 | 812 | 10.97% | 13.63% | 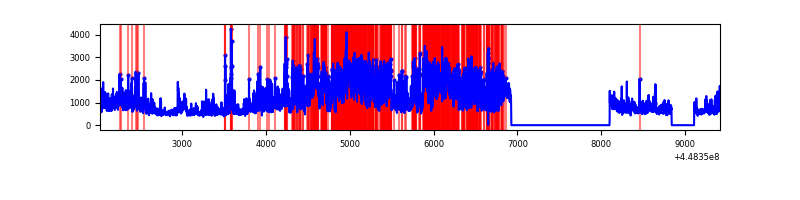 |
Top three noisy pixels from each quadrant. If the there are fewer than three noisy pixels in the level2.evt file, extra rows are filled as -1
| Pixel properties | Quadrant properties | ||||||
|---|---|---|---|---|---|---|---|
| Quadrant | DetID | PixID | Counts | Sigma | Mean | Median | Sigma |
| A | 10 | 83 | 2677257 | 18462.09 | 710 | 696 | 145.0 |
| A | 13 | 248 | 77031 | 526.54 | 710 | 696 | 145.0 |
| A | 2 | 79 | 12219 | 79.48 | 710 | 696 | 145.0 |
| B | 3 | 112 | 2604244 | 19538.0 | 698 | 676 | 133.3 |
| B | 15 | 201 | 168311 | 1257.99 | 698 | 676 | 133.3 |
| B | 4 | 171 | 82031 | 610.51 | 698 | 676 | 133.3 |
| C | 9 | 54 | 1350314 | 8458.94 | 682 | 687 | 159.6 |
| C | 14 | 254 | 86250 | 536.28 | 682 | 687 | 159.6 |
| C | 12 | 2 | 32157 | 197.24 | 682 | 687 | 159.6 |
| D | 11 | 241 | 3646305 | 21090.25 | 683 | 663 | 172.9 |
| D | 1 | 52 | 173355 | 999.03 | 683 | 663 | 172.9 |
| D | 8 | 48 | 155782 | 897.37 | 683 | 663 | 172.9 |
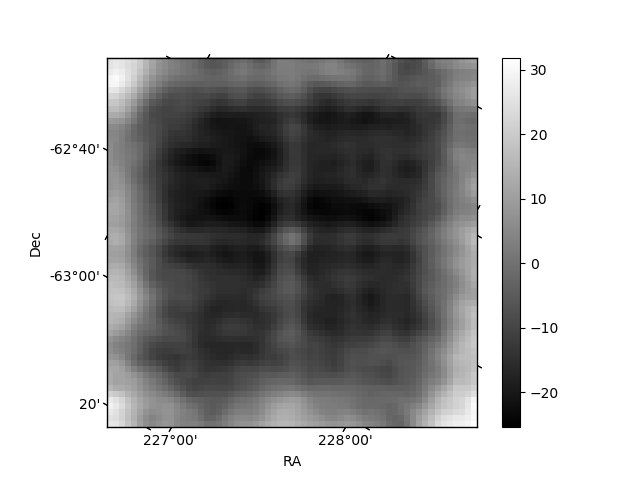
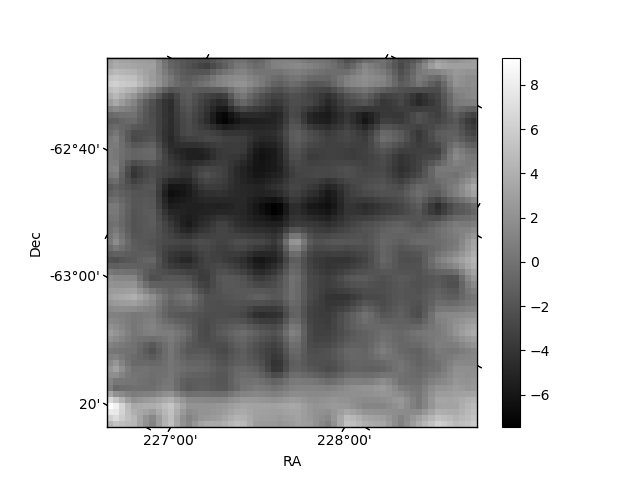
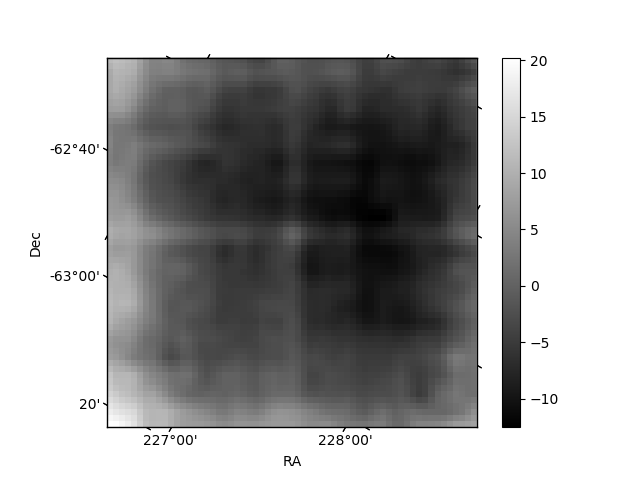
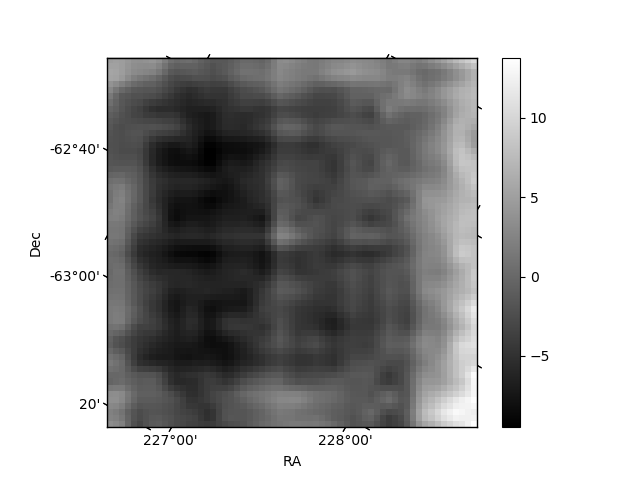
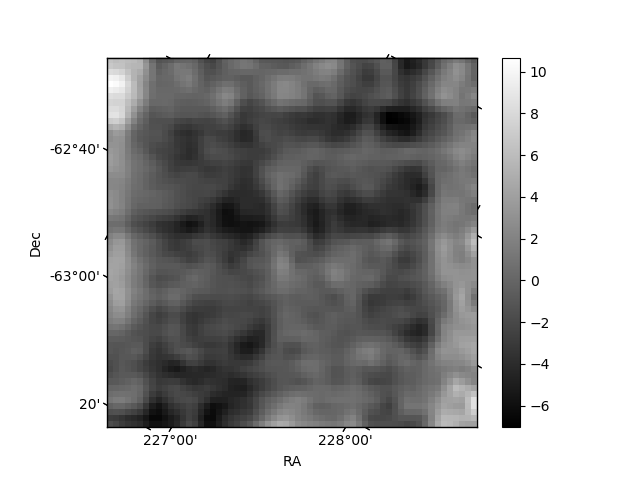
Histogram calculated using DETX and DETY for each event in the final _common_clean file
| Quadrant A | 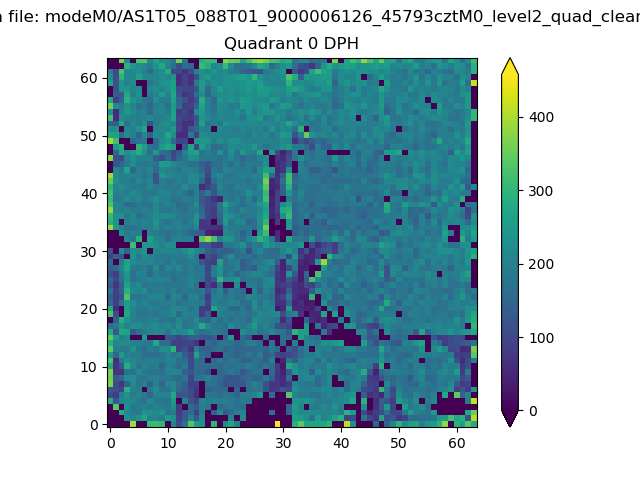 |
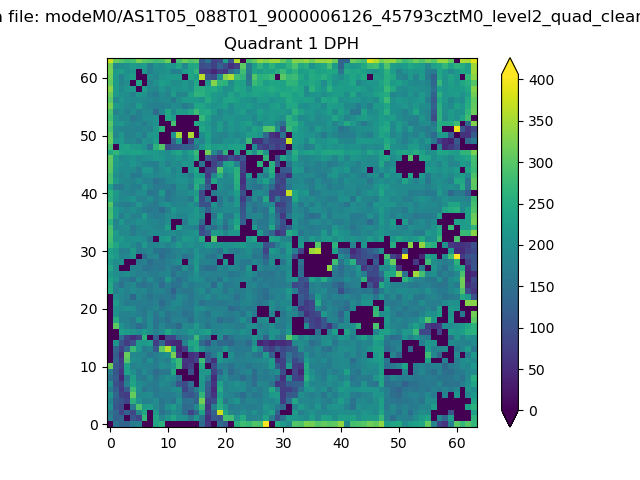 |
Quadrant B |
|---|---|---|---|
| Quadrant D | 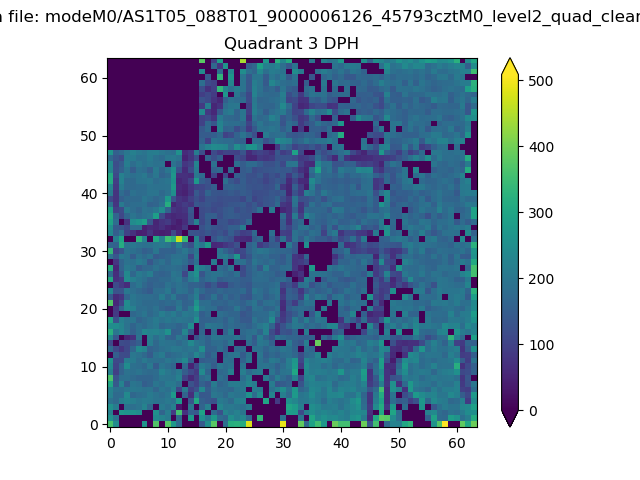 |
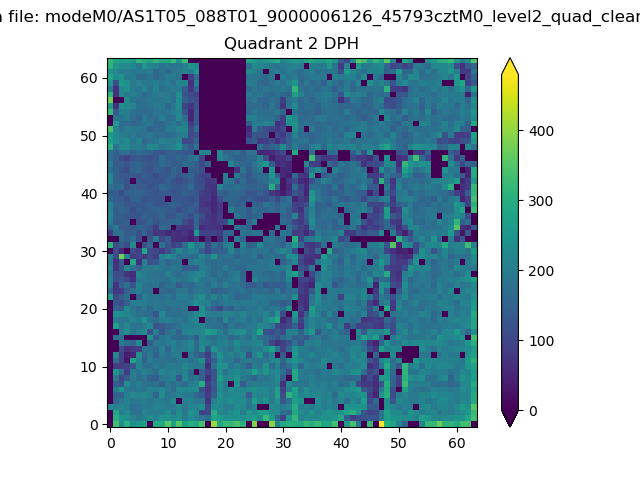 |
Quadrant C |
| Plot type | Count rate plots | Images |
|---|---|---|
| Comparison with Poisson distribution Blue bars denote a histogram of data divided into 1 sec bins. Red curve is a Poisson curve with rate = median count rate of data. |
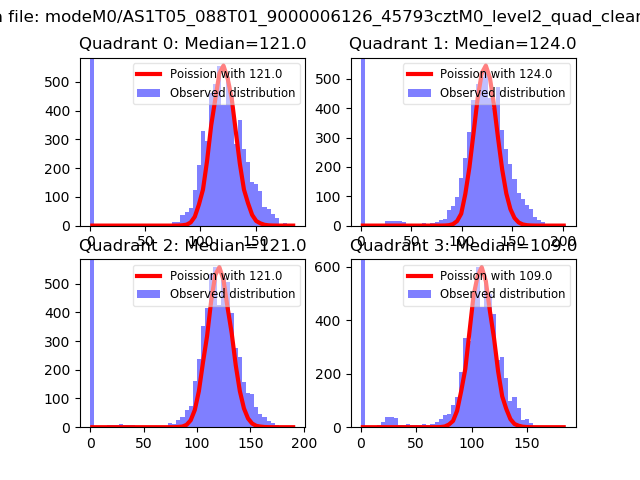 |
 |
| Quadrant-wise count rates Data is divided into 100 sec bins |
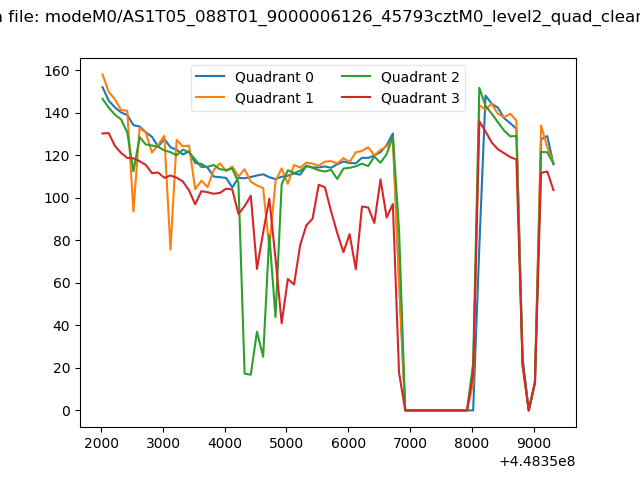 |
|
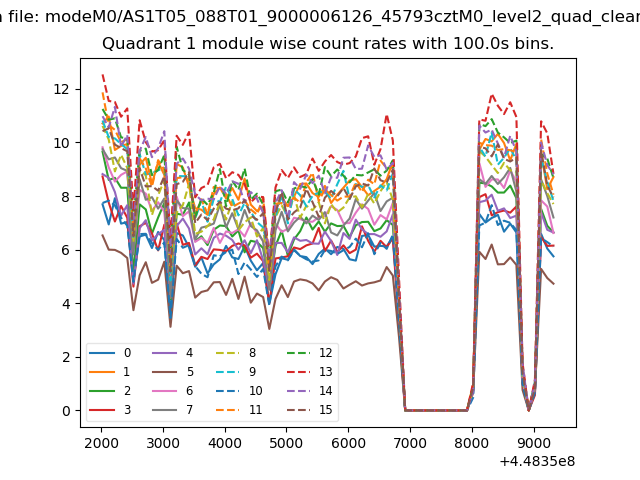
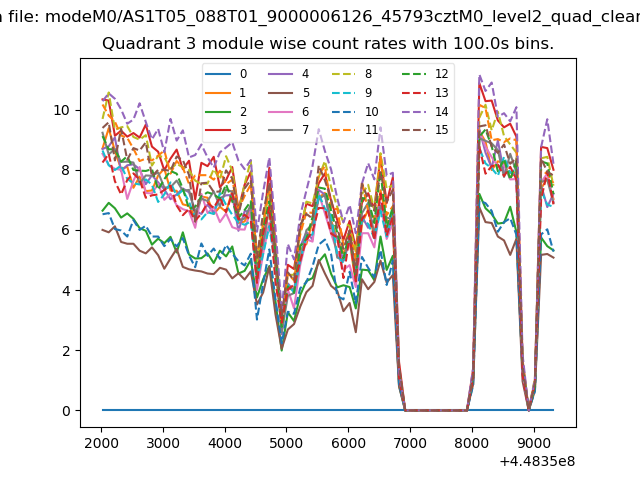
| Module-wise count rates for Quadrant A Data is divided into 100 sec bins |
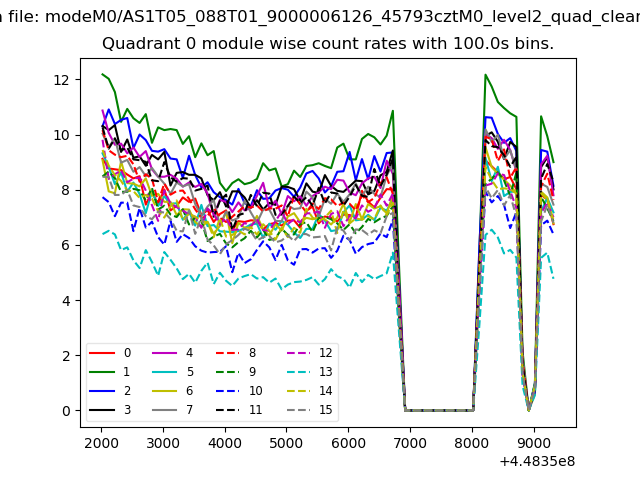 |
 |
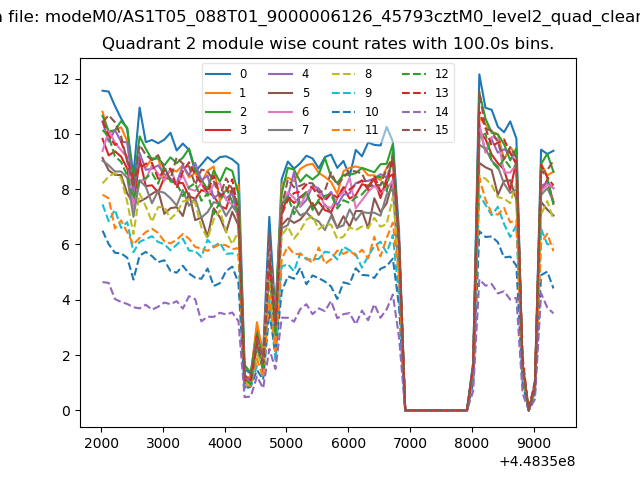
| Module-wise count rates for Quadrant B Data is divided into 100 sec bins |
 |
 |
| Module-wise count rates for Quadrant C Data is divided into 100 sec bins |
 |
 |
| Module-wise count rates for Quadrant D Data is divided into 100 sec bins |
 |
 |
| Parameter | Plot |
|---|---|
| CZT HV Monitor | 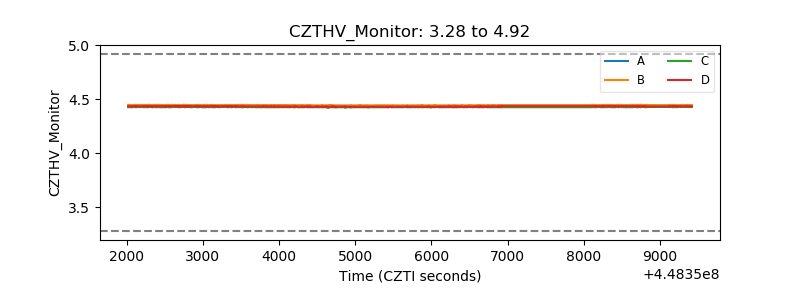 |
| D_VDD | 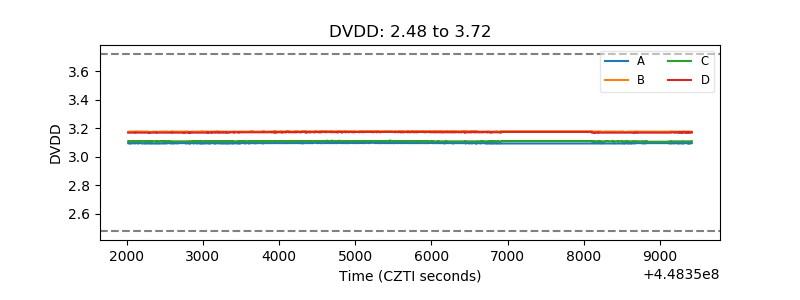 |
| Temperature 1 | 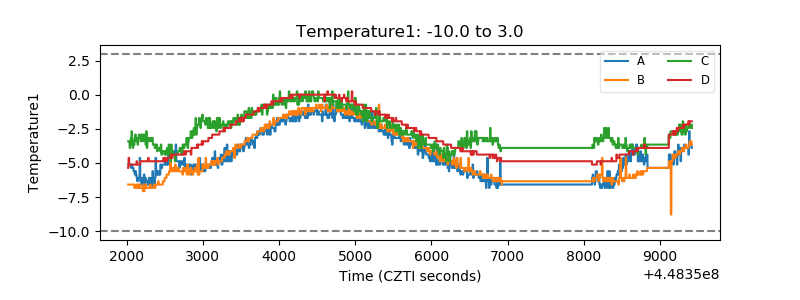 |
| Veto HV Monitor | 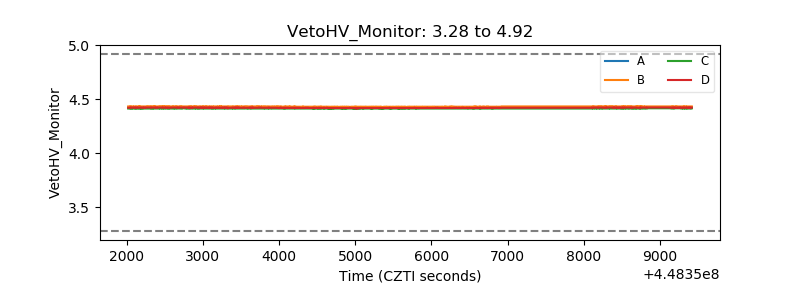 |
| Veto LLD | 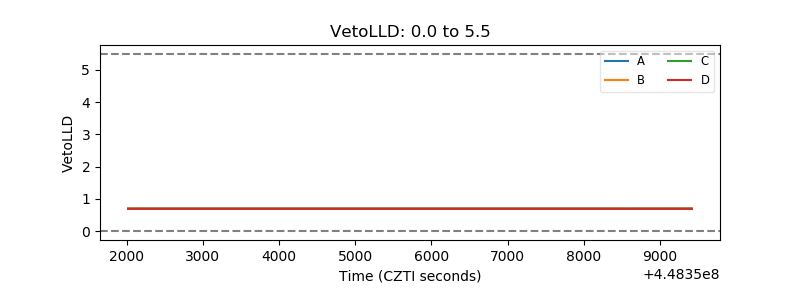 |
| Alpha Counter | 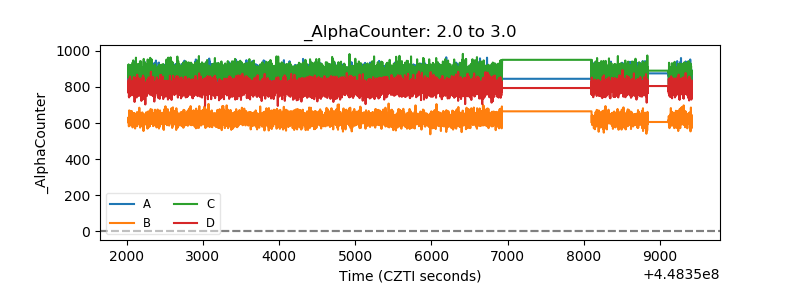 |
| _CPM_Rate | 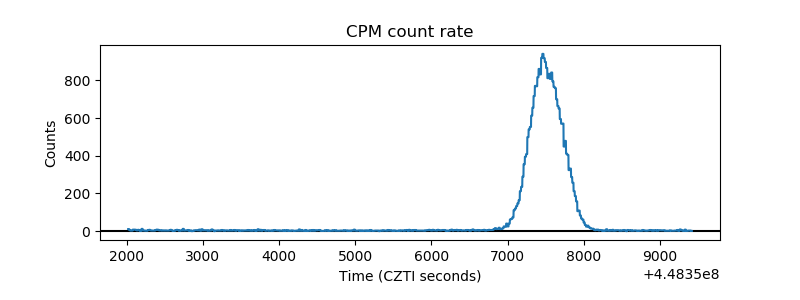 |
| CZT Counter | 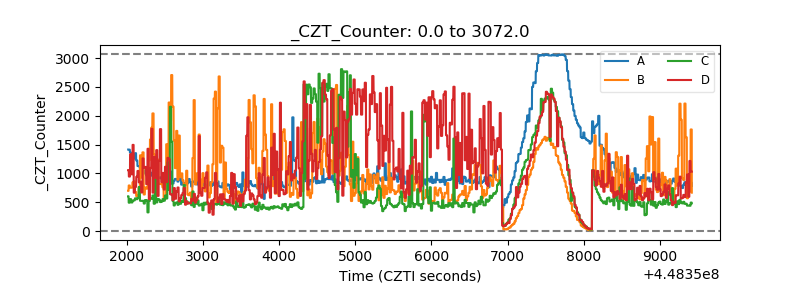 |
| +2.5 Volts monitor | 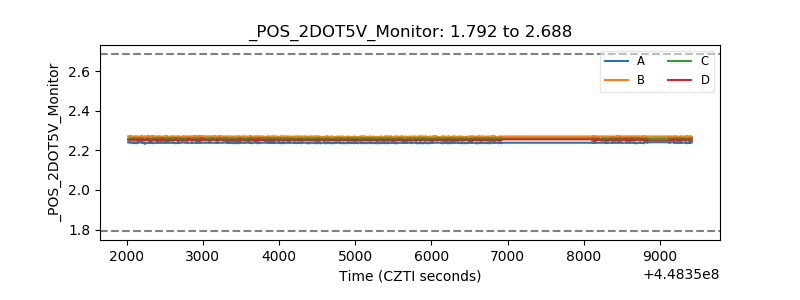 |
| +5 Volts monitor | 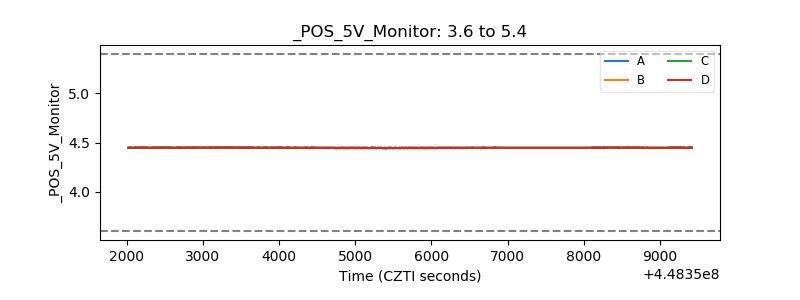 |
| _ROLL_ROT | 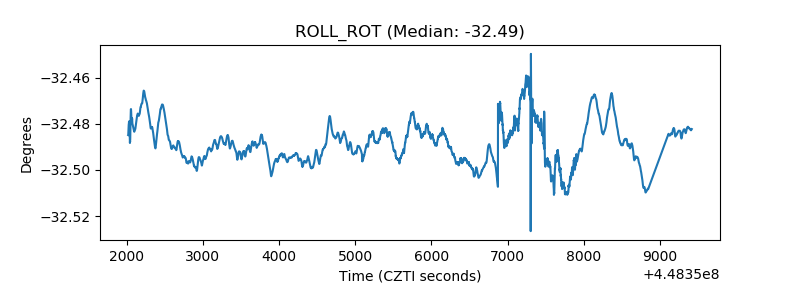 |
| _Roll_DEC | 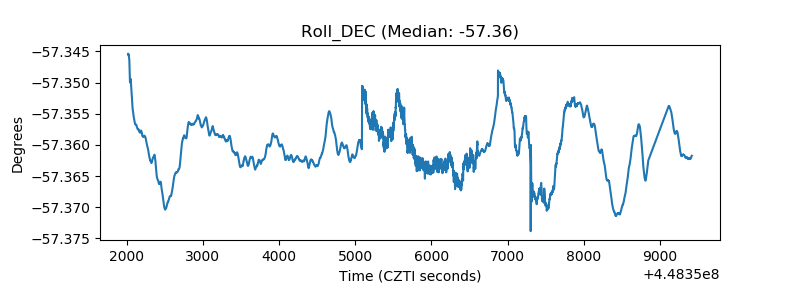 |
| _Roll_RA | 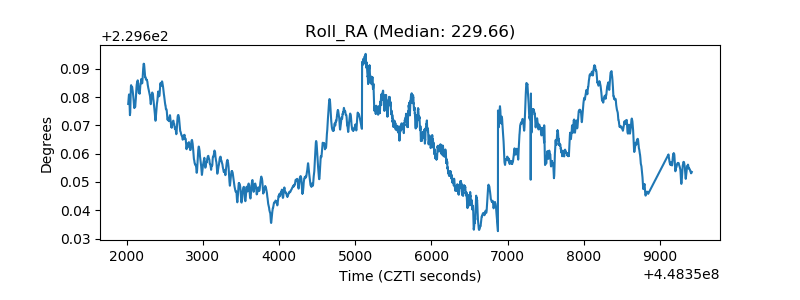 |
| Veto Counter | 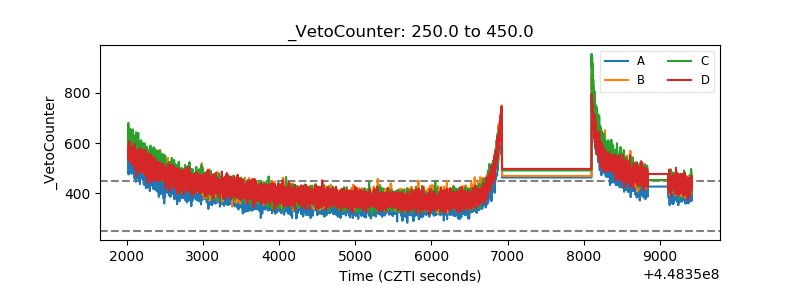 |