| Param | Original file | Final file |
|---|---|---|
| Filename | modeM0/AS1T05_088T01_9000006126_45794cztM0_level2.fits | modeM0/AS1T05_088T01_9000006126_45794cztM0_level2_quad_clean.evt |
| Size (bytes) | 542,419,200 | 105,269,760 |
| Size | 517.3 MB | 100.4 MB |
| Events in quadrant A | 5,489,590 | 707,357 |
| Events in quadrant B | 5,666,211 | 705,415 |
| Events in quadrant C | 2,928,677 | 713,230 |
| Events in quadrant D | 5,524,735 | 637,828 |
| Mode M9 | |||
|---|---|---|---|
| Quadrant | BADHDUFLAG | Total packets | Discarded packets |
| A | 0 | 11 | 0 |
| B | 0 | 11 | 0 |
| C | 0 | 11 | 0 |
| D | 0 | 11 | 0 |
| Mode M0 | |||
|---|---|---|---|
| Quadrant | BADHDUFLAG | Total packets | Discarded packets |
| A | 0 | 19858 | 1 |
| B | 0 | 21136 | 1 |
| C | 0 | 12784 | 2 |
| D | 0 | 20804 | 1 |
| Mode SS | |||
|---|---|---|---|
| Quadrant | BADHDUFLAG | Total packets | Discarded packets |
| A | 0 | 124 | 0 |
| B | 0 | 124 | 0 |
| C | 0 | 124 | 0 |
| D | 0 | 124 | 0 |
| Quadrant | Total seconds | Saturated seconds | Saturation percentage |
|---|---|---|---|
| A | 6067 | 208 | 3.428383% |
| B | 6067 | 508 | 8.373166% |
| C | 6067 | 78 | 1.285644% |
| D | 6067 | 236 | 3.889896% |
Noise dominated data is calculated using 1-second bins in cleaned event files. If a bin has >2000 counts, and if more than 50% of those come from <1% of pixels, then it is considered to be noise-dominated and hence unusable.
| Quadrant | # 1 sec bins | Bins with >0 counts | Bins with >2000 counts | High rate bins dominated by noise | Noise dominated (total time) | Noise dominated (detector-on time) | Marked lightcurve |
|---|---|---|---|---|---|---|---|
| A | 7197 | 6068 | 2 | 2 | 0.03% | 0.03% | 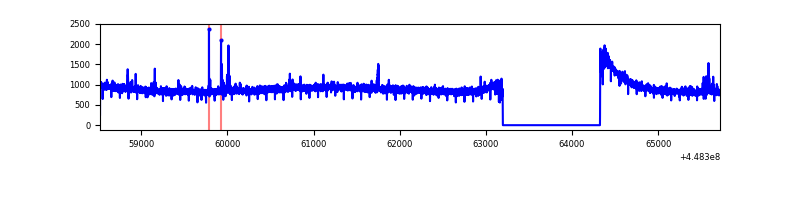 |
| B | 7197 | 6068 | 231 | 231 | 3.21% | 3.81% | 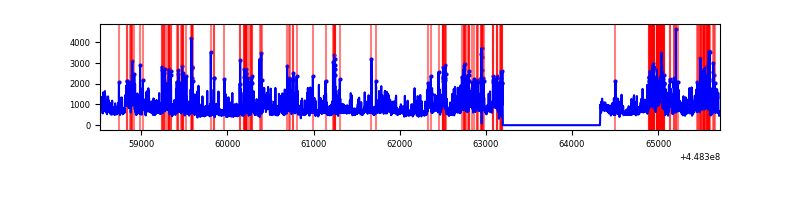 |
| C | 7197 | 6068 | 4 | 4 | 0.06% | 0.07% | 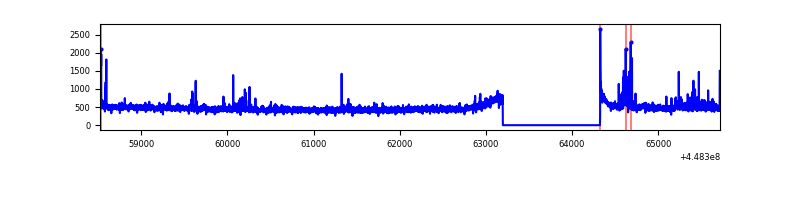 |
| D | 7197 | 6068 | 134 | 134 | 1.86% | 2.21% | 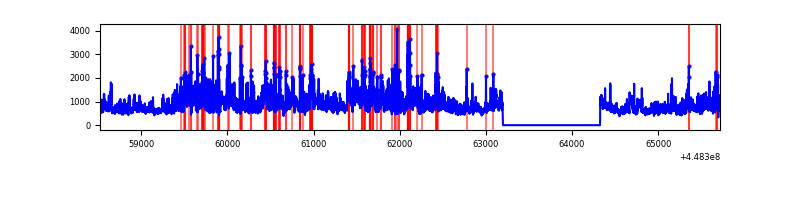 |
Top three noisy pixels from each quadrant. If the there are fewer than three noisy pixels in the level2.evt file, extra rows are filled as -1
| Pixel properties | Quadrant properties | ||||||
|---|---|---|---|---|---|---|---|
| Quadrant | DetID | PixID | Counts | Sigma | Mean | Median | Sigma |
| A | 10 | 83 | 2653509 | 17947.92 | 713 | 699 | 147.8 |
| A | 13 | 248 | 23182 | 152.11 | 713 | 699 | 147.8 |
| A | 7 | 3 | 20495 | 133.93 | 713 | 699 | 147.8 |
| B | 3 | 112 | 2382796 | 17830.87 | 695 | 675 | 133.6 |
| B | 0 | 171 | 153003 | 1140.22 | 695 | 675 | 133.6 |
| B | 5 | 172 | 115791 | 861.68 | 695 | 675 | 133.6 |
| C | 12 | 2 | 109072 | 654.7 | 711 | 714 | 165.5 |
| C | 3 | 233 | 28496 | 167.86 | 711 | 714 | 165.5 |
| C | 14 | 96 | 8719 | 48.37 | 711 | 714 | 165.5 |
| D | 11 | 241 | 1733774 | 9776.98 | 704 | 683 | 177.3 |
| D | 1 | 52 | 505617 | 2848.51 | 704 | 683 | 177.3 |
| D | 2 | 249 | 212140 | 1192.9 | 704 | 683 | 177.3 |
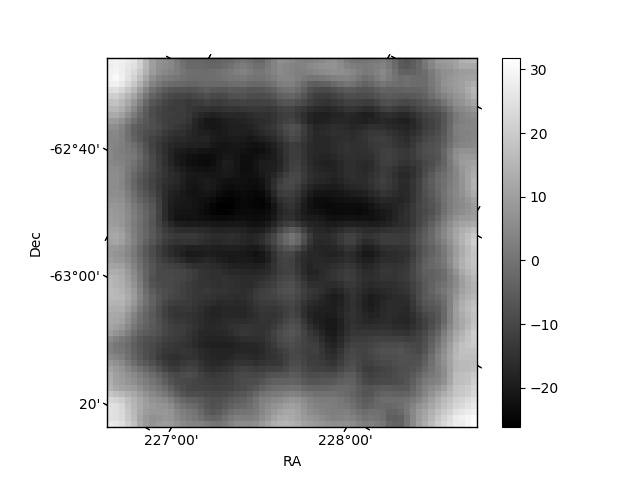
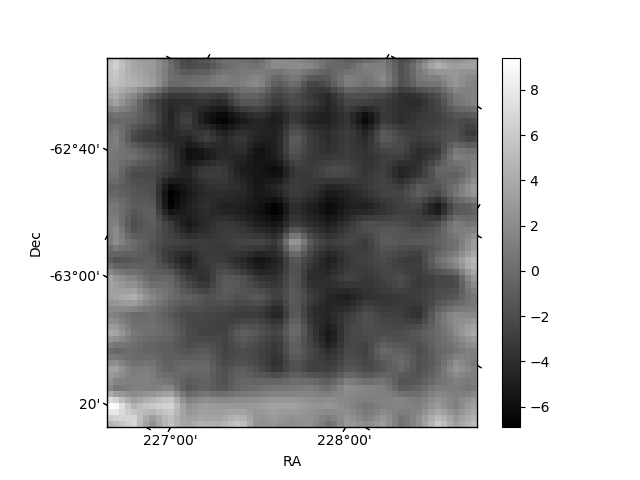
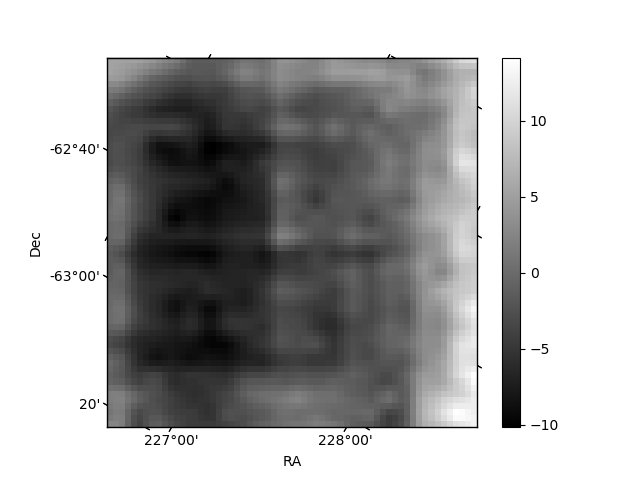
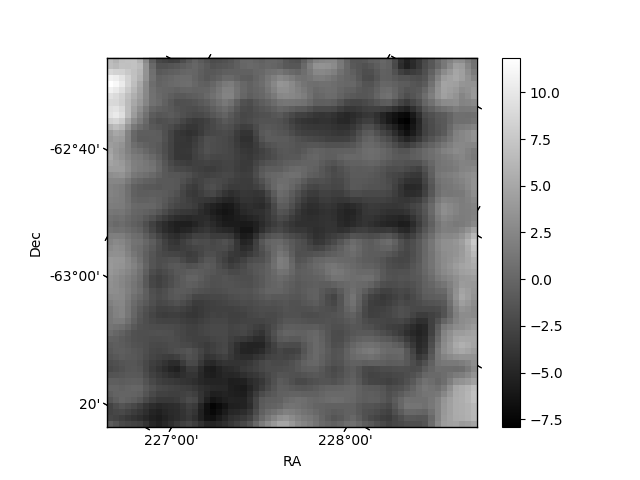
Histogram calculated using DETX and DETY for each event in the final _common_clean file
| Quadrant A | 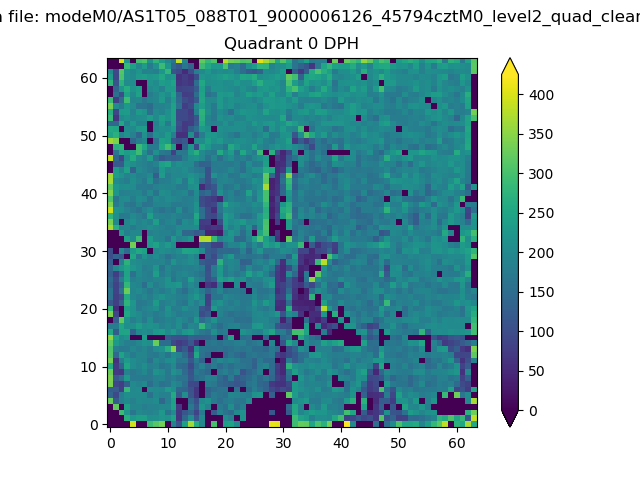 |
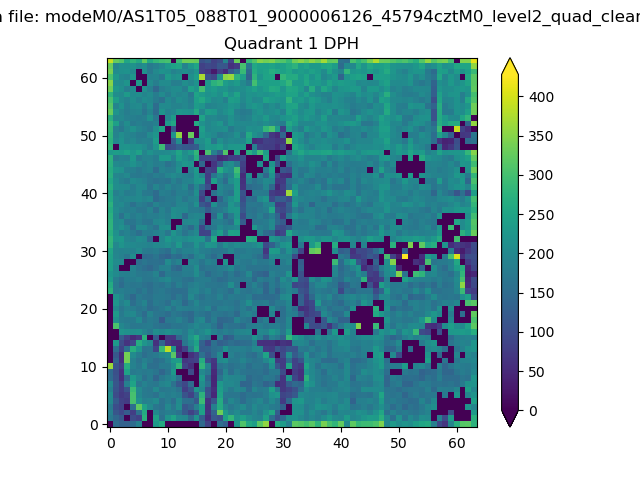 |
Quadrant B |
|---|---|---|---|
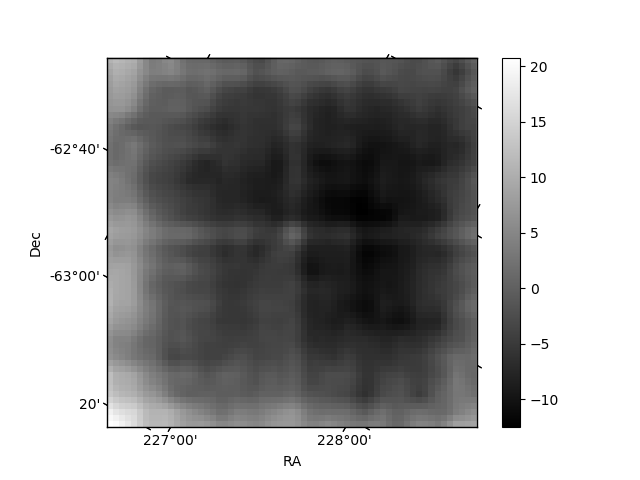
| Quadrant D | 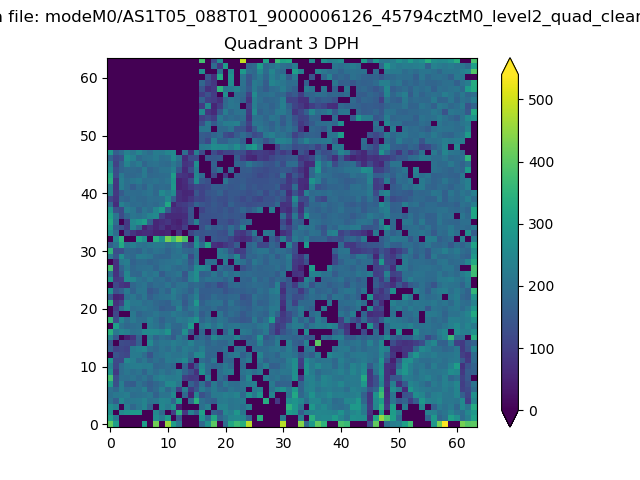 |
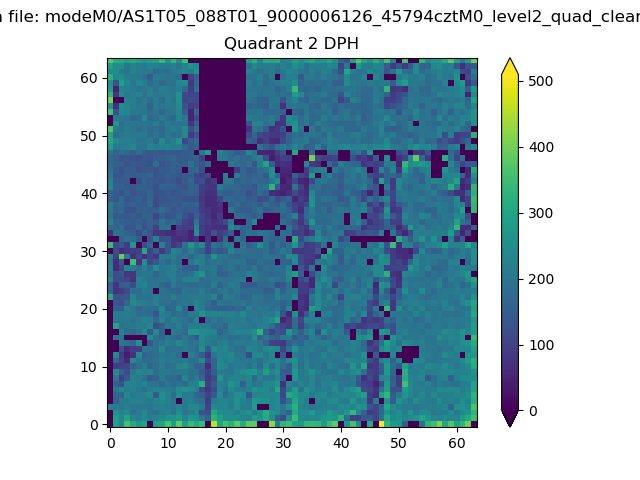 |
Quadrant C |
| Plot type | Count rate plots | Images |
|---|---|---|
| Comparison with Poisson distribution Blue bars denote a histogram of data divided into 1 sec bins. Red curve is a Poisson curve with rate = median count rate of data. |
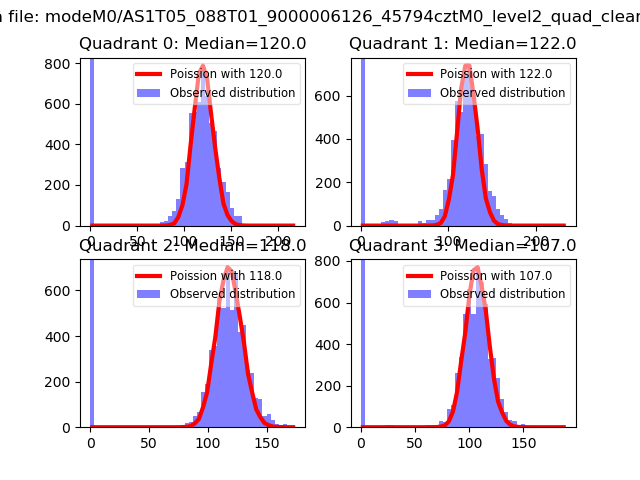 |
 |
| Quadrant-wise count rates Data is divided into 100 sec bins |
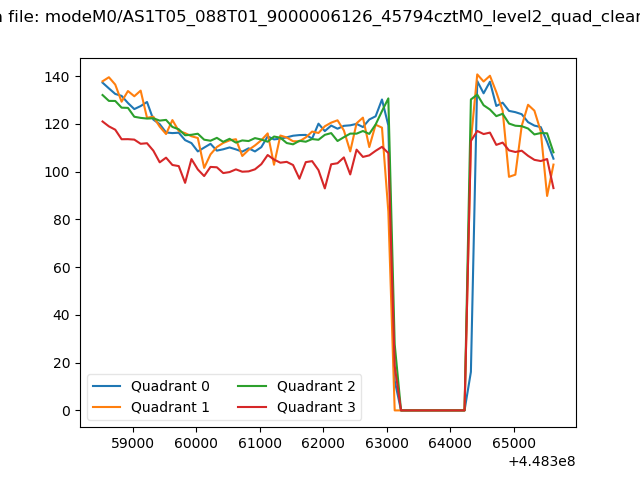 |
|
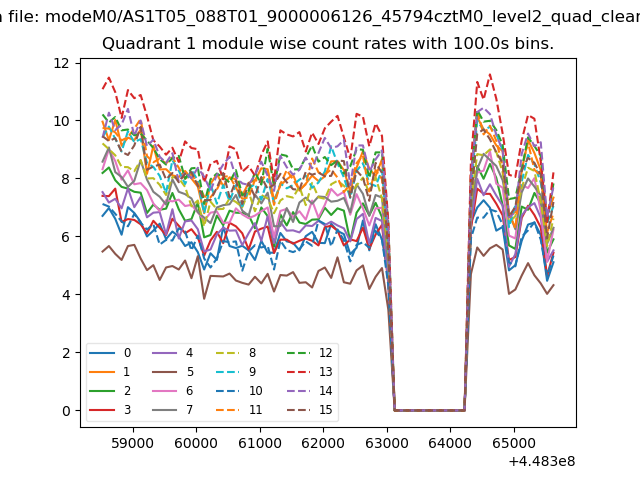
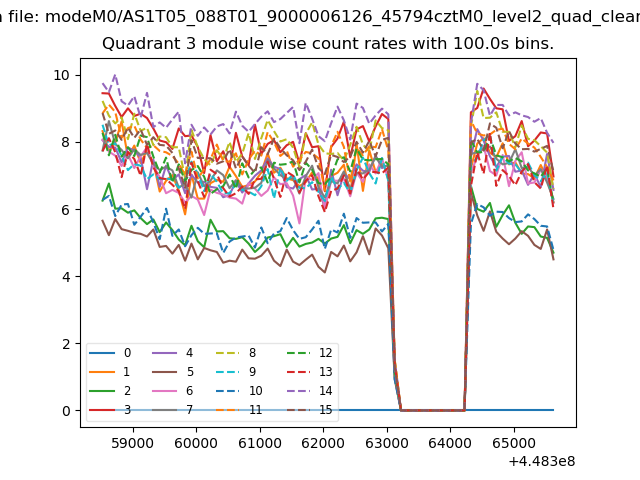
| Module-wise count rates for Quadrant A Data is divided into 100 sec bins |
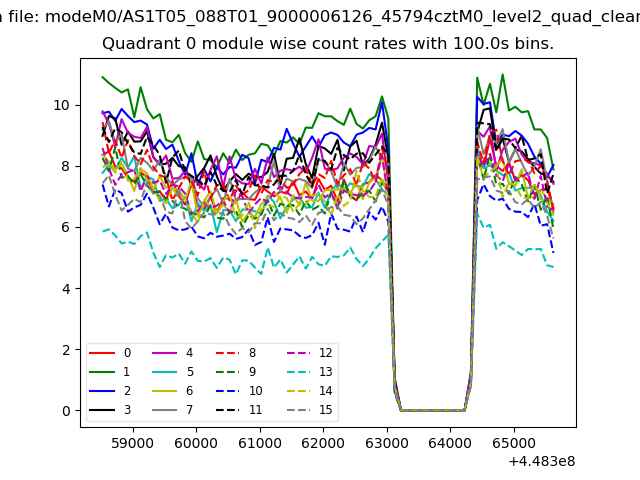 |
 |
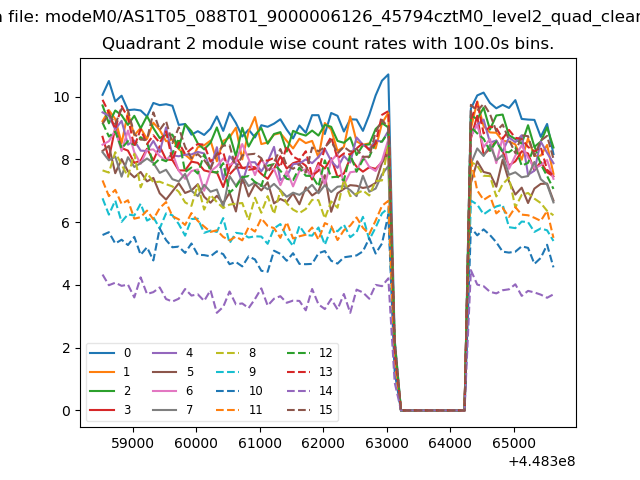
| Module-wise count rates for Quadrant B Data is divided into 100 sec bins |
 |
 |
| Module-wise count rates for Quadrant C Data is divided into 100 sec bins |
 |
 |
| Module-wise count rates for Quadrant D Data is divided into 100 sec bins |
 |
 |
| Parameter | Plot |
|---|---|
| CZT HV Monitor | 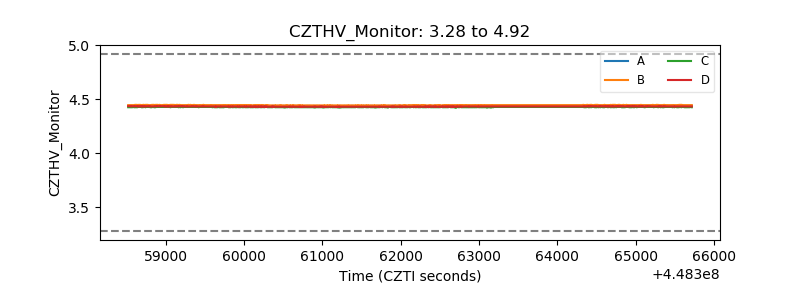 |
| D_VDD | 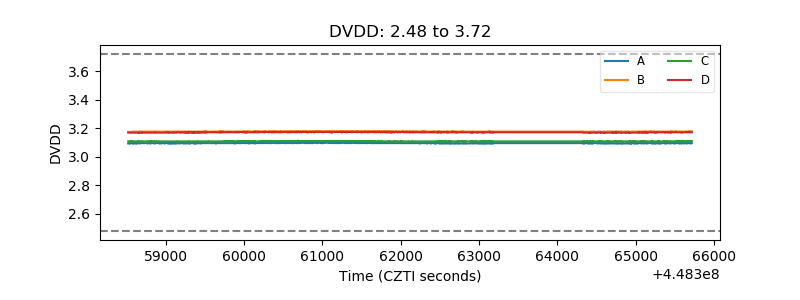 |
| Temperature 1 | 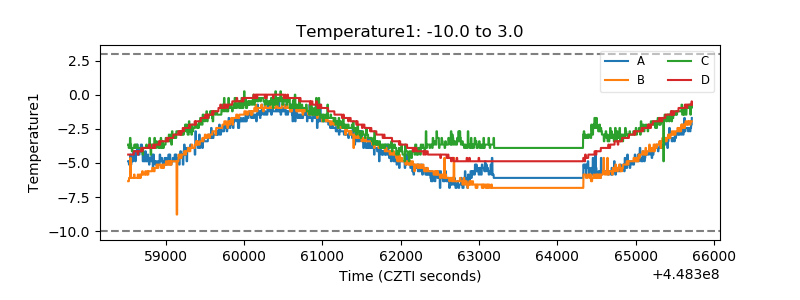 |
| Veto HV Monitor |  |
| Veto LLD | 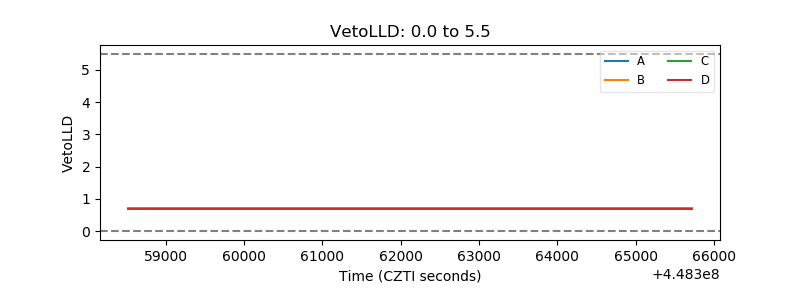 |
| Alpha Counter | 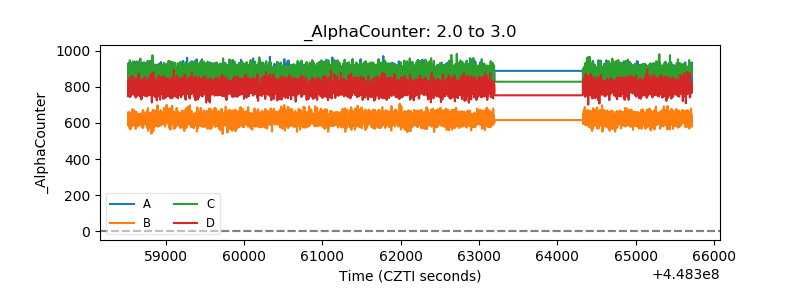 |
| _CPM_Rate | 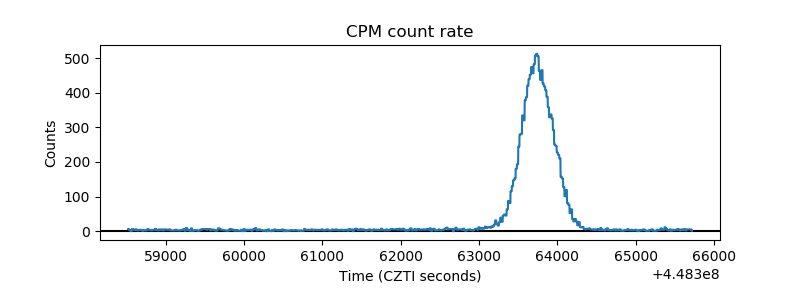 |
| CZT Counter | 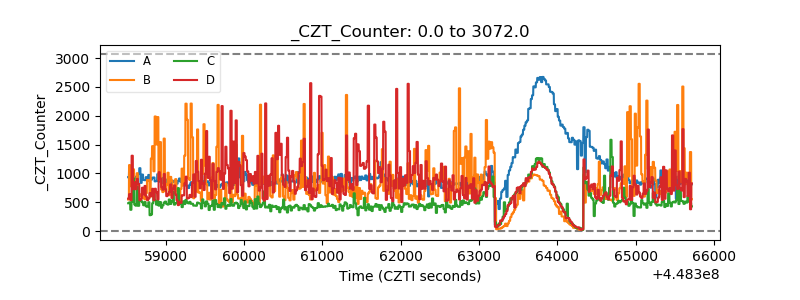 |
| +2.5 Volts monitor | 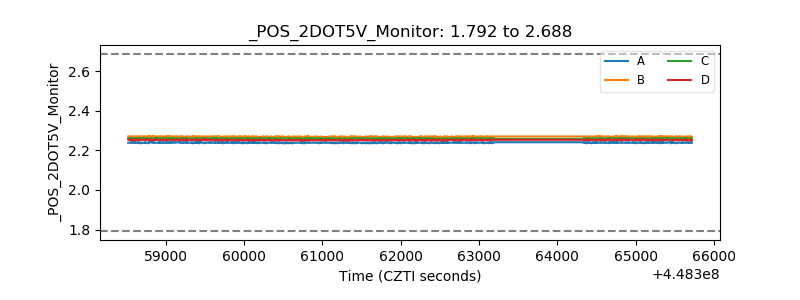 |
| +5 Volts monitor | 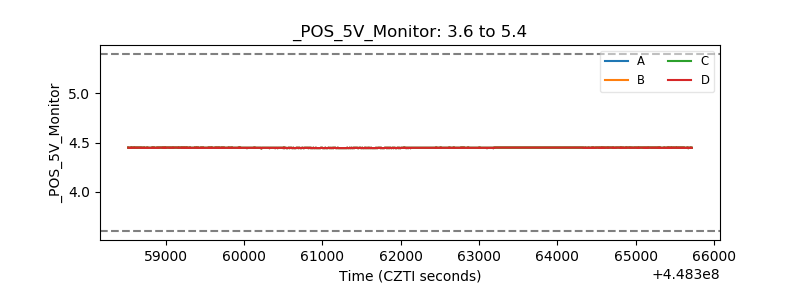 |
| _ROLL_ROT | 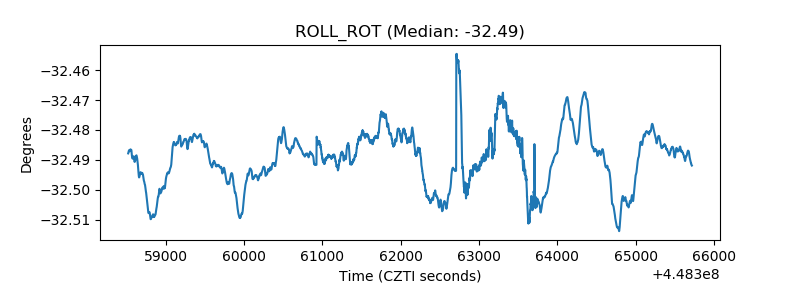 |
| _Roll_DEC | 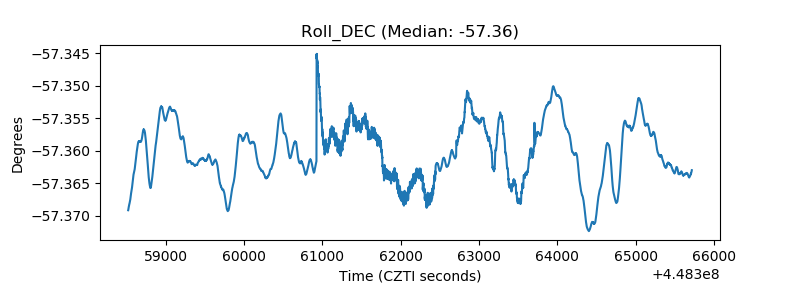 |
| _Roll_RA | 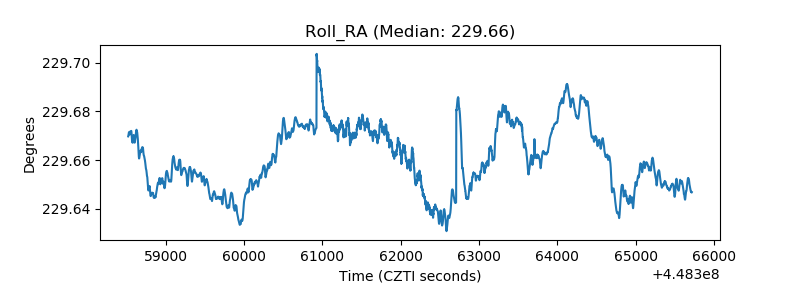 |
| Veto Counter | 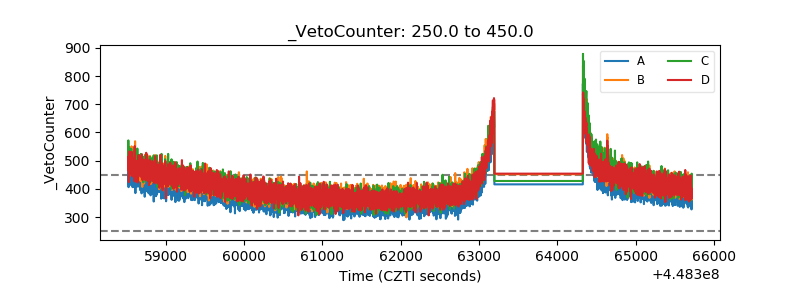 |