| Param | Original file | Final file |
|---|---|---|
| Filename | modeM0/AS1T05_088T01_9000006126_45795cztM0_level2.fits | modeM0/AS1T05_088T01_9000006126_45795cztM0_level2_quad_clean.evt |
| Size (bytes) | 623,482,560 | 109,552,320 |
| Size | 594.6 MB | 104.5 MB |
| Events in quadrant A | 5,919,490 | 737,054 |
| Events in quadrant B | 6,479,598 | 721,539 |
| Events in quadrant C | 3,125,413 | 751,385 |
| Events in quadrant D | 7,039,777 | 642,489 |
| Mode M9 | |||
|---|---|---|---|
| Quadrant | BADHDUFLAG | Total packets | Discarded packets |
| A | 0 | 10 | 0 |
| B | 0 | 10 | 0 |
| C | 0 | 10 | 0 |
| D | 0 | 10 | 0 |
| Mode M0 | |||
|---|---|---|---|
| Quadrant | BADHDUFLAG | Total packets | Discarded packets |
| A | 0 | 21418 | 1 |
| B | 0 | 24048 | 1 |
| C | 0 | 13949 | 1 |
| D | 0 | 25720 | 3 |
| Mode SS | |||
|---|---|---|---|
| Quadrant | BADHDUFLAG | Total packets | Discarded packets |
| A | 0 | 136 | 0 |
| B | 0 | 136 | 0 |
| C | 0 | 136 | 0 |
| D | 0 | 136 | 0 |
| Quadrant | Total seconds | Saturated seconds | Saturation percentage |
|---|---|---|---|
| A | 6661 | 211 | 3.167693% |
| B | 6662 | 687 | 10.312219% |
| C | 6662 | 85 | 1.275893% |
| D | 6661 | 614 | 9.217835% |
Noise dominated data is calculated using 1-second bins in cleaned event files. If a bin has >2000 counts, and if more than 50% of those come from <1% of pixels, then it is considered to be noise-dominated and hence unusable.
| Quadrant | # 1 sec bins | Bins with >0 counts | Bins with >2000 counts | High rate bins dominated by noise | Noise dominated (total time) | Noise dominated (detector-on time) | Marked lightcurve |
|---|---|---|---|---|---|---|---|
| A | 7641 | 6662 | 2 | 2 | 0.03% | 0.03% | 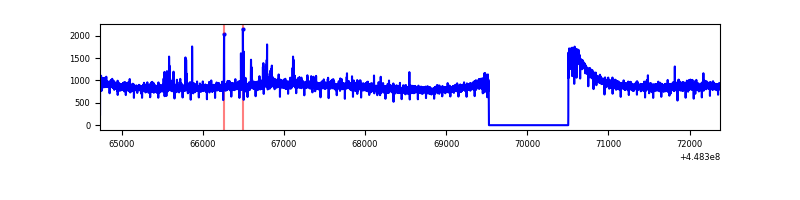 |
| B | 7642 | 6663 | 343 | 343 | 4.49% | 5.15% | 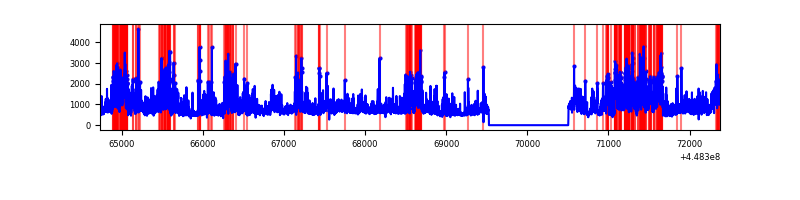 |
| C | 7642 | 6663 | 1 | 1 | 0.01% | 0.02% | 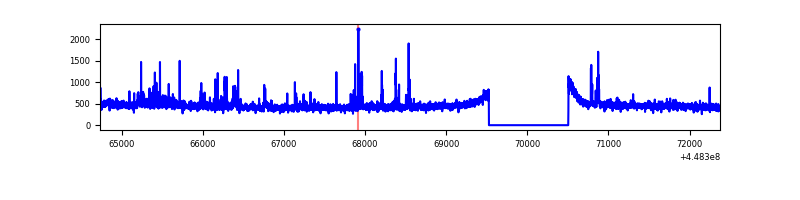 |
| D | 7641 | 6662 | 452 | 452 | 5.92% | 6.78% | 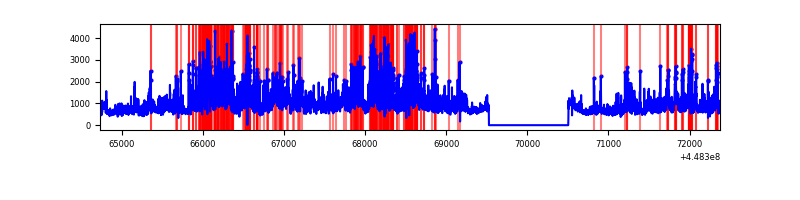 |
Top three noisy pixels from each quadrant. If the there are fewer than three noisy pixels in the level2.evt file, extra rows are filled as -1
| Pixel properties | Quadrant properties | ||||||
|---|---|---|---|---|---|---|---|
| Quadrant | DetID | PixID | Counts | Sigma | Mean | Median | Sigma |
| A | 10 | 83 | 2879894 | 18057.06 | 763 | 747 | 159.4 |
| A | 13 | 248 | 47586 | 293.76 | 763 | 747 | 159.4 |
| A | 15 | 14 | 23131 | 140.39 | 763 | 747 | 159.4 |
| B | 3 | 112 | 3014069 | 20837.16 | 748 | 726 | 144.6 |
| B | 0 | 171 | 113658 | 780.92 | 748 | 726 | 144.6 |
| B | 4 | 171 | 109201 | 750.1 | 748 | 726 | 144.6 |
| C | 12 | 2 | 96064 | 539.42 | 761 | 764 | 176.7 |
| C | 2 | 14 | 29353 | 161.82 | 761 | 764 | 176.7 |
| C | 12 | 16 | 13417 | 71.62 | 761 | 764 | 176.7 |
| D | 11 | 241 | 2073919 | 11176.93 | 739 | 717 | 185.5 |
| D | 13 | 249 | 847095 | 4562.95 | 739 | 717 | 185.5 |
| D | 1 | 52 | 676427 | 3642.85 | 739 | 717 | 185.5 |
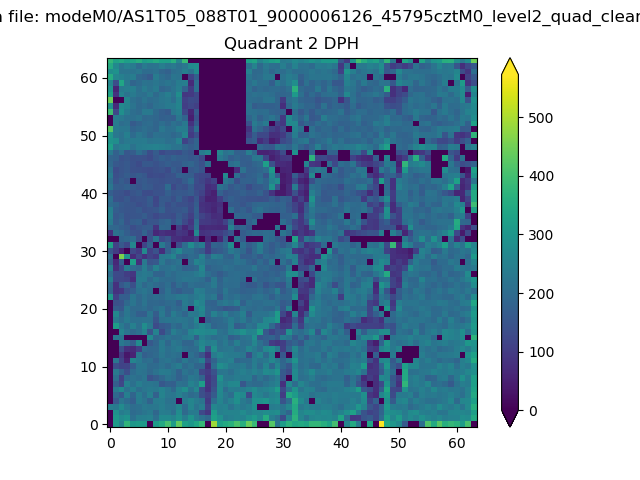
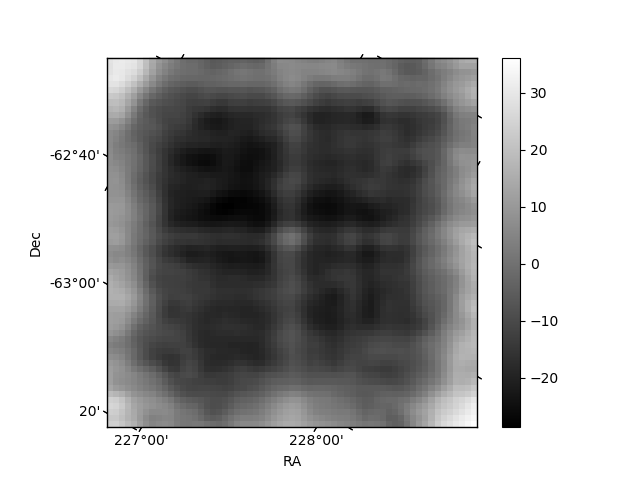
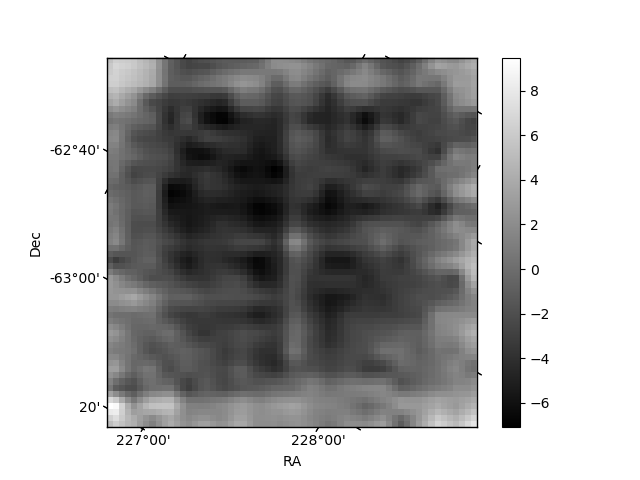
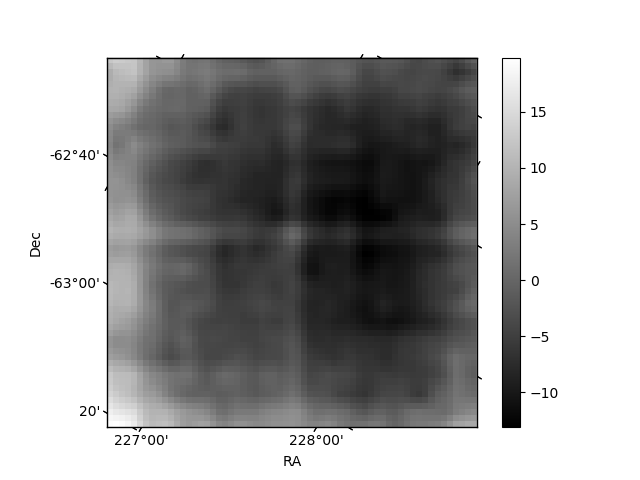
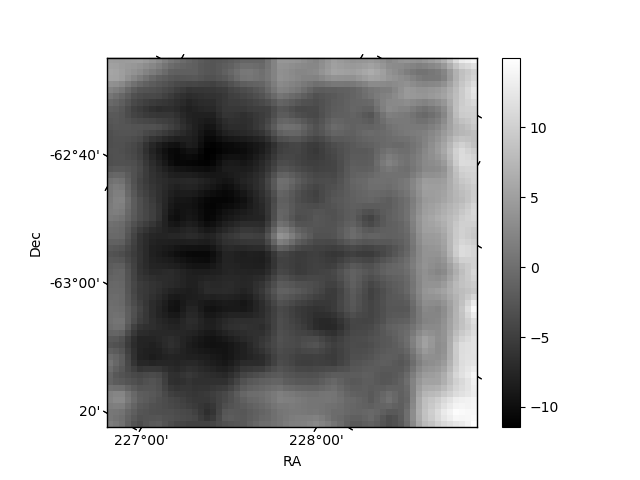
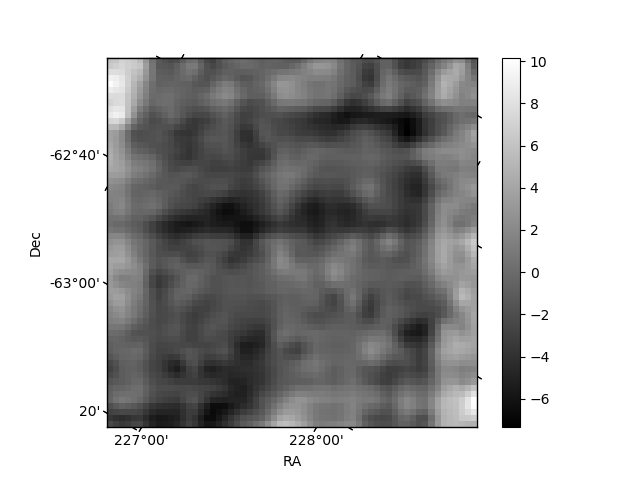
Histogram calculated using DETX and DETY for each event in the final _common_clean file
| Quadrant A | 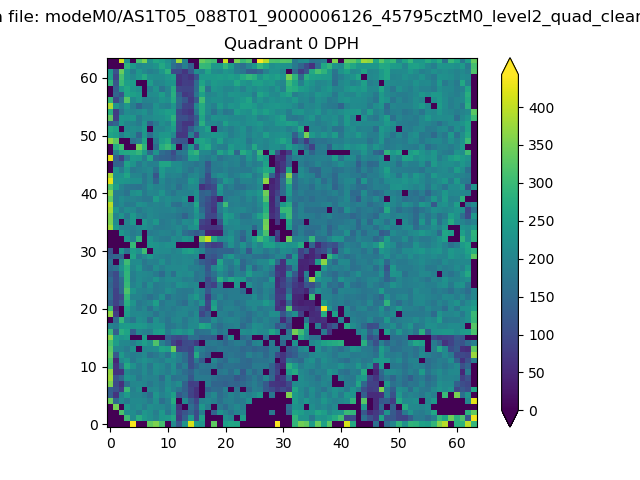 |
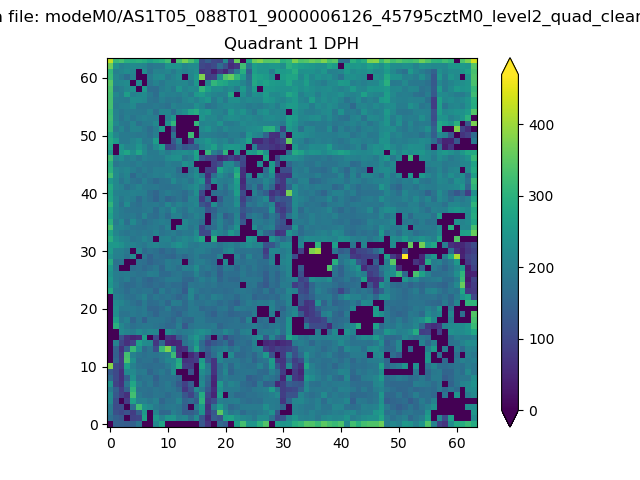 |
Quadrant B |
|---|---|---|---|
| Quadrant D | 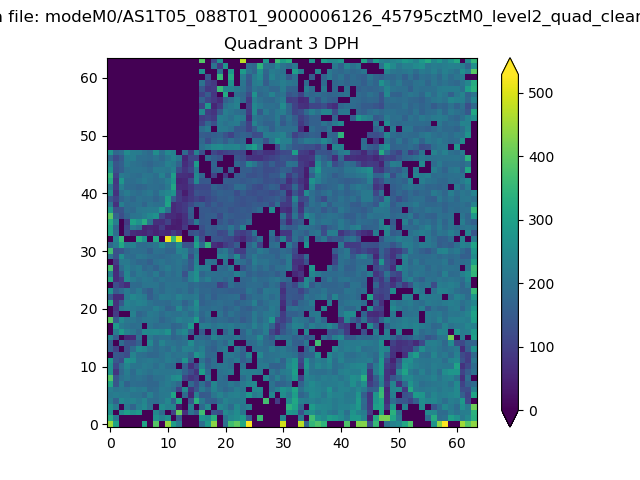 |
 |
Quadrant C |
| Plot type | Count rate plots | Images |
|---|---|---|
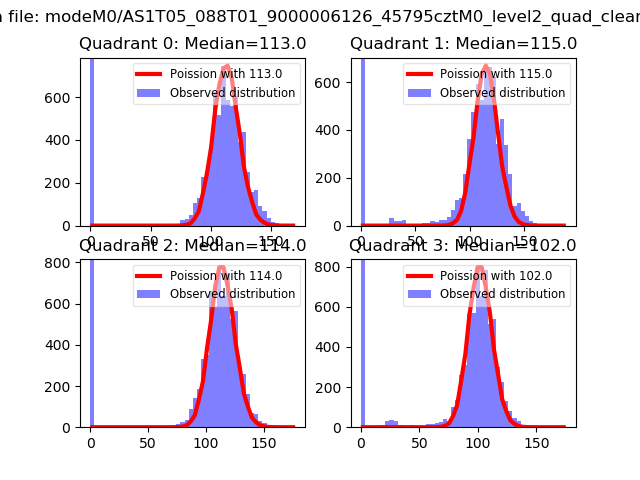
| Comparison with Poisson distribution Blue bars denote a histogram of data divided into 1 sec bins. Red curve is a Poisson curve with rate = median count rate of data. |
 |
 |
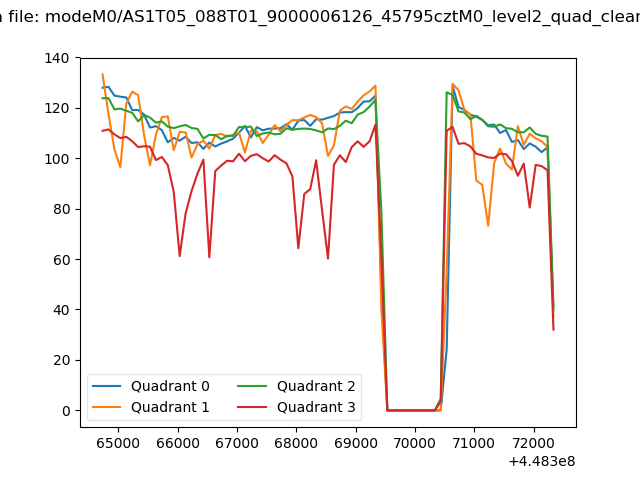
| Quadrant-wise count rates Data is divided into 100 sec bins |
 |
|
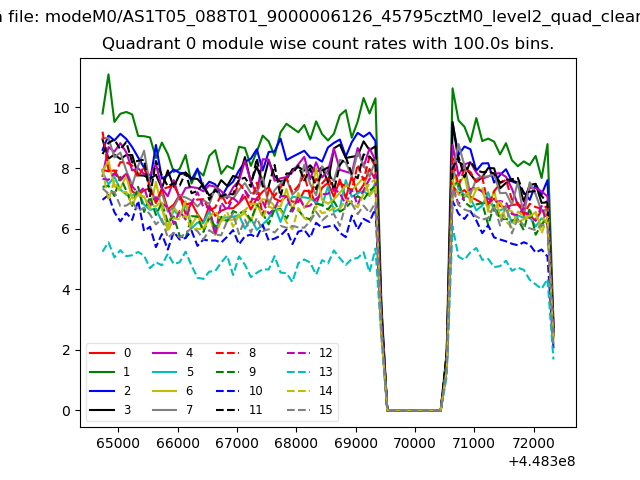
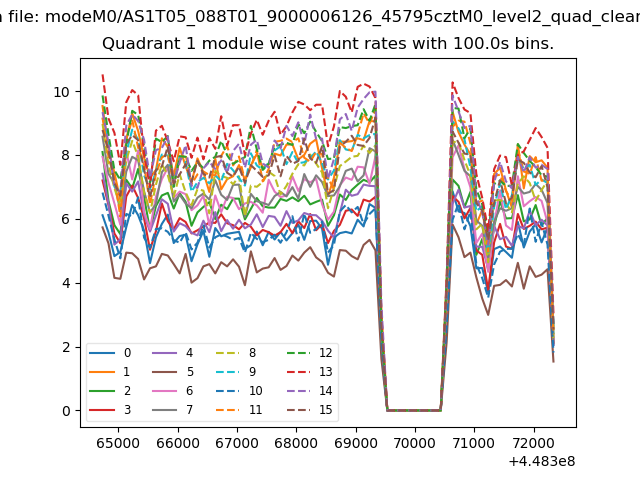
| Module-wise count rates for Quadrant A Data is divided into 100 sec bins |
 |
 |
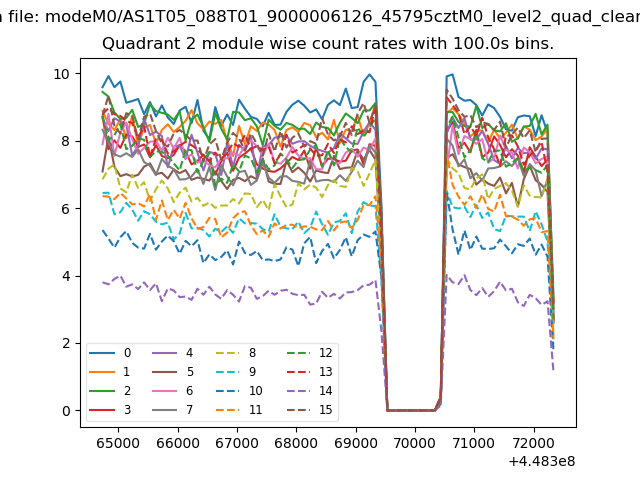
| Module-wise count rates for Quadrant B Data is divided into 100 sec bins |
 |
 |
| Module-wise count rates for Quadrant C Data is divided into 100 sec bins |
 |
 |
| Module-wise count rates for Quadrant D Data is divided into 100 sec bins |
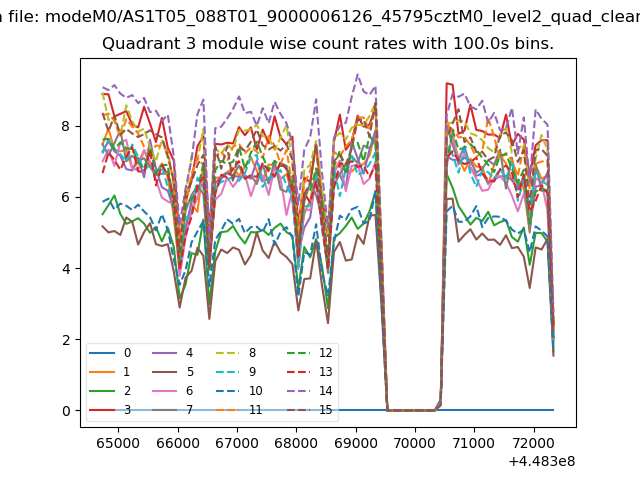 |
 |
| Parameter | Plot |
|---|---|
| CZT HV Monitor |  |
| D_VDD | 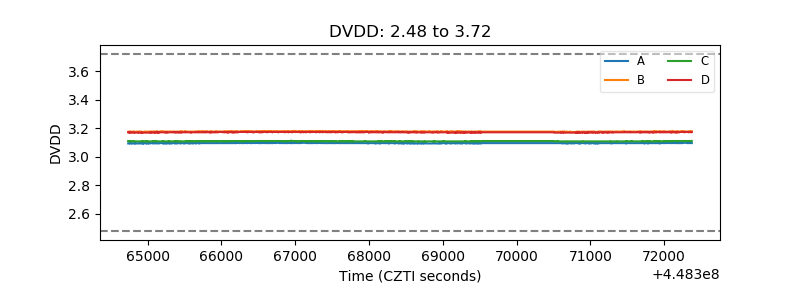 |
| Temperature 1 | 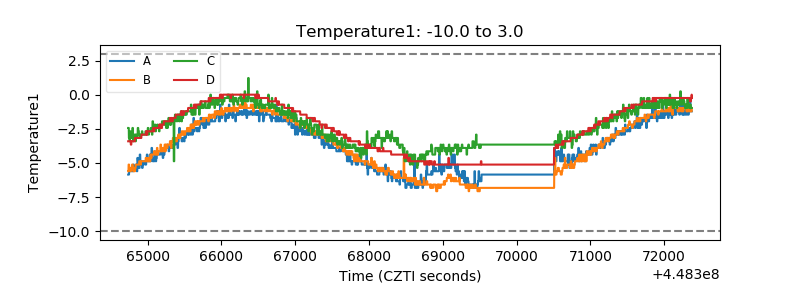 |
| Veto HV Monitor | 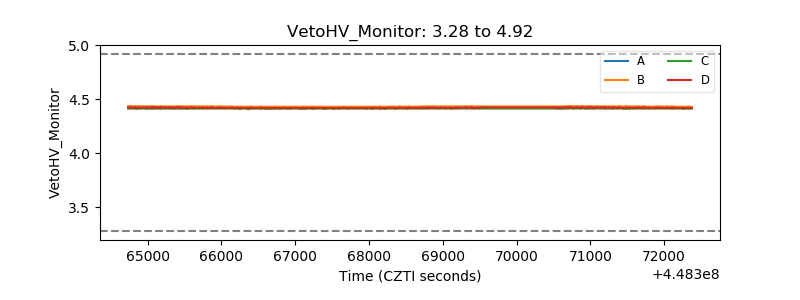 |
| Veto LLD | 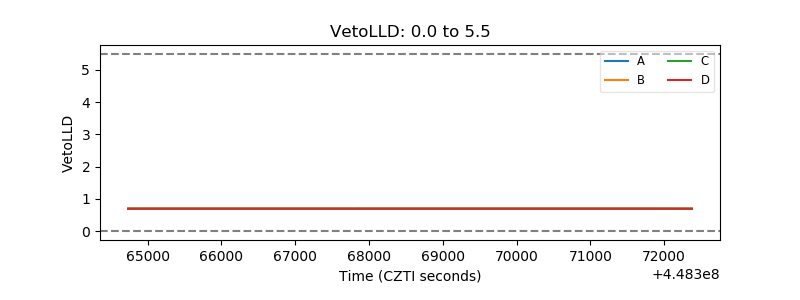 |
| Alpha Counter | 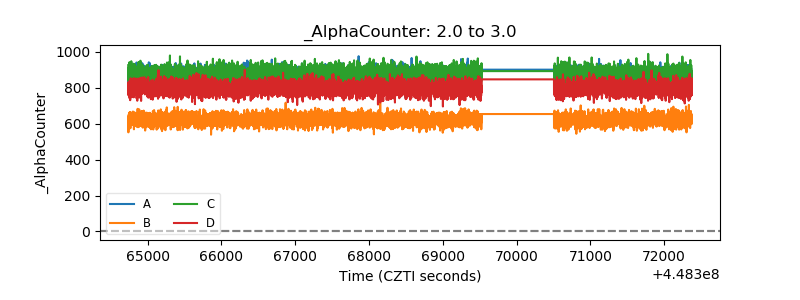 |
| _CPM_Rate | 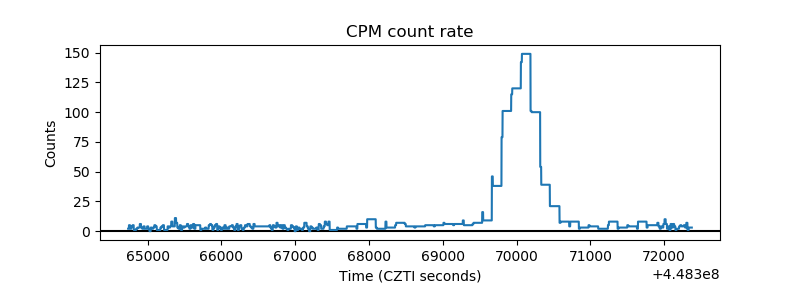 |
| CZT Counter | 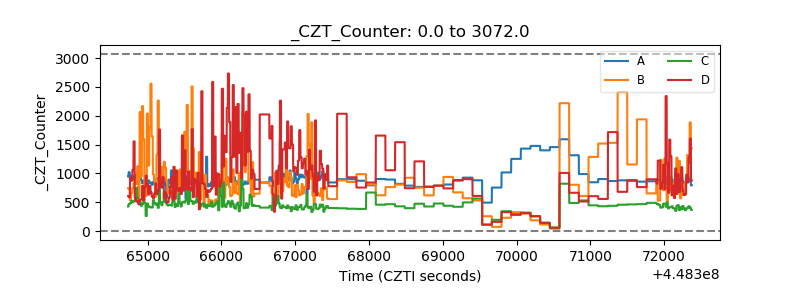 |
| +2.5 Volts monitor |  |
| +5 Volts monitor | 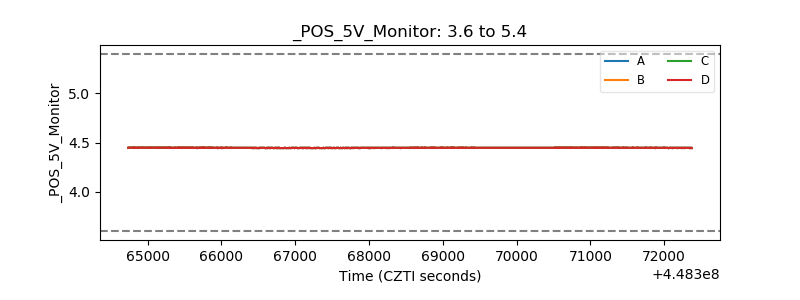 |
| _ROLL_ROT | 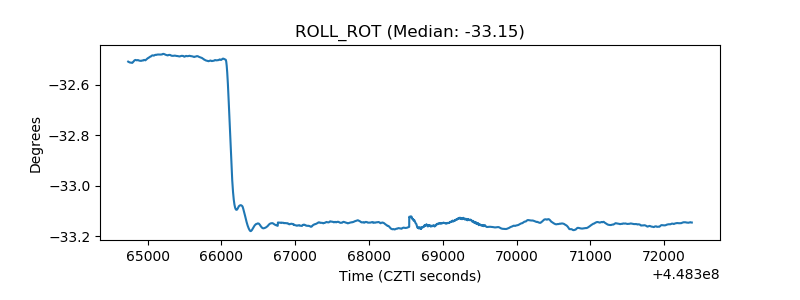 |
| _Roll_DEC | 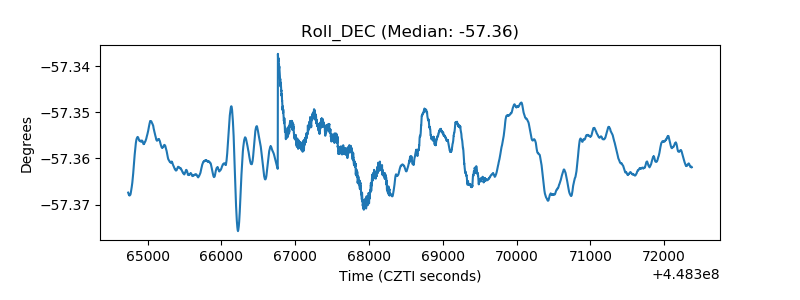 |
| _Roll_RA | 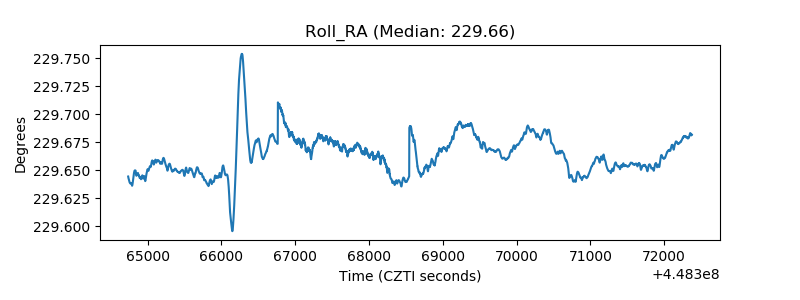 |
| Veto Counter | 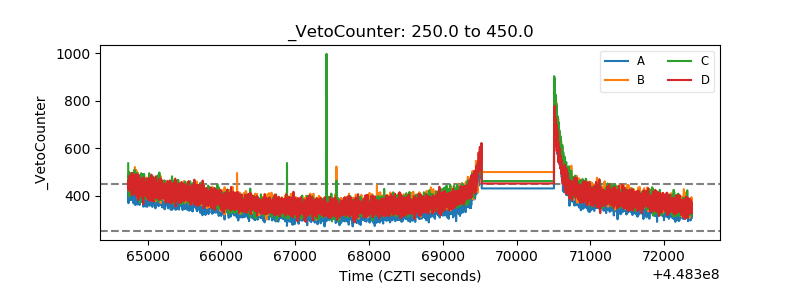 |