| Param | Original file | Final file |
|---|---|---|
| Filename | modeM0/AS1T05_088T01_9000006126_45796cztM0_level2.fits | modeM0/AS1T05_088T01_9000006126_45796cztM0_level2_quad_clean.evt |
| Size (bytes) | 669,864,960 | 111,188,160 |
| Size | 638.8 MB | 106.0 MB |
| Events in quadrant A | 6,142,719 | 743,393 |
| Events in quadrant B | 6,730,851 | 731,613 |
| Events in quadrant C | 3,222,425 | 761,451 |
| Events in quadrant D | 8,157,477 | 640,920 |
| Mode M9 | |||
|---|---|---|---|
| Quadrant | BADHDUFLAG | Total packets | Discarded packets |
| A | 0 | 6 | 0 |
| B | 0 | 6 | 0 |
| C | 0 | 6 | 0 |
| D | 0 | 6 | 0 |
| Mode M0 | |||
|---|---|---|---|
| Quadrant | BADHDUFLAG | Total packets | Discarded packets |
| A | 0 | 22292 | 1 |
| B | 0 | 24947 | 3 |
| C | 0 | 14712 | 1 |
| D | 0 | 29229 | 1 |
| Mode SS | |||
|---|---|---|---|
| Quadrant | BADHDUFLAG | Total packets | Discarded packets |
| A | 0 | 142 | 0 |
| B | 0 | 142 | 0 |
| C | 0 | 142 | 0 |
| D | 0 | 142 | 0 |
| Quadrant | Total seconds | Saturated seconds | Saturation percentage |
|---|---|---|---|
| A | 7023 | 287 | 4.086573% |
| B | 7023 | 749 | 10.664958% |
| C | 7023 | 129 | 1.836822% |
| D | 7023 | 865 | 12.316674% |
Noise dominated data is calculated using 1-second bins in cleaned event files. If a bin has >2000 counts, and if more than 50% of those come from <1% of pixels, then it is considered to be noise-dominated and hence unusable.
| Quadrant | # 1 sec bins | Bins with >0 counts | Bins with >2000 counts | High rate bins dominated by noise | Noise dominated (total time) | Noise dominated (detector-on time) | Marked lightcurve |
|---|---|---|---|---|---|---|---|
| A | 7618 | 7024 | 4 | 4 | 0.05% | 0.06% | 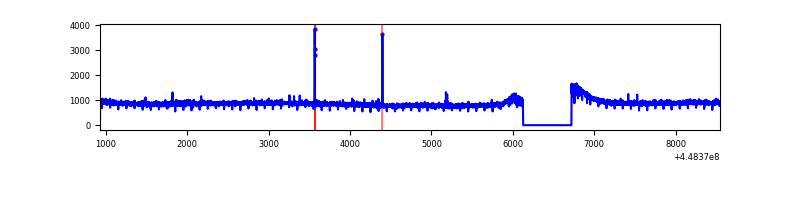 |
| B | 7618 | 7024 | 340 | 340 | 4.46% | 4.84% | 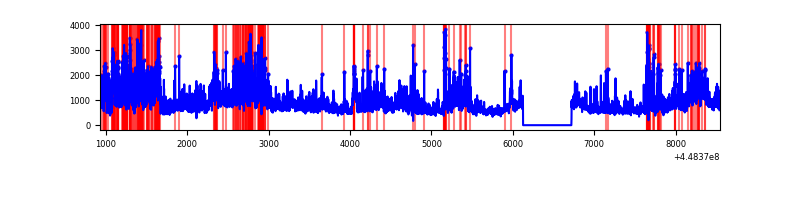 |
| C | 7618 | 7024 | 10 | 10 | 0.13% | 0.14% | 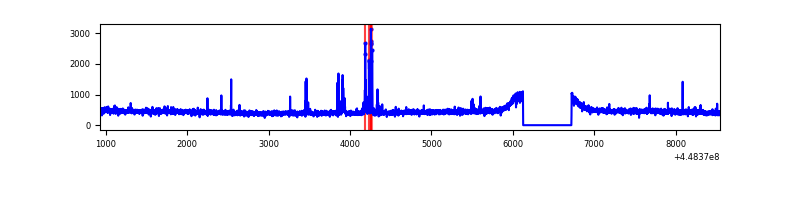 |
| D | 7618 | 7024 | 733 | 733 | 9.62% | 10.44% | 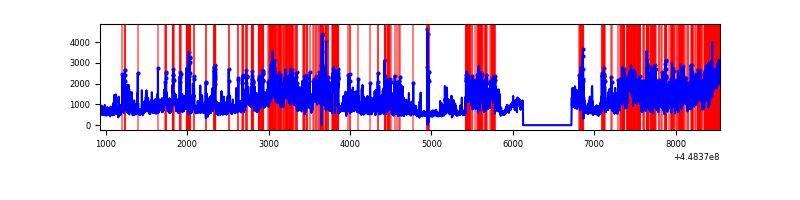 |
Top three noisy pixels from each quadrant. If the there are fewer than three noisy pixels in the level2.evt file, extra rows are filled as -1
| Pixel properties | Quadrant properties | ||||||
|---|---|---|---|---|---|---|---|
| Quadrant | DetID | PixID | Counts | Sigma | Mean | Median | Sigma |
| A | 10 | 83 | 3008401 | 17919.73 | 800 | 779 | 167.8 |
| A | 14 | 248 | 13408 | 75.24 | 800 | 779 | 167.8 |
| A | 13 | 254 | 12829 | 71.79 | 800 | 779 | 167.8 |
| B | 3 | 112 | 2883103 | 18655.53 | 781 | 755 | 154.5 |
| B | 8 | 234 | 171950 | 1108.03 | 781 | 755 | 154.5 |
| B | 0 | 171 | 137521 | 885.19 | 781 | 755 | 154.5 |
| C | 2 | 14 | 88548 | 470.82 | 797 | 801 | 186.4 |
| C | 14 | 96 | 18250 | 93.62 | 797 | 801 | 186.4 |
| C | 12 | 2 | 7071 | 33.64 | 797 | 801 | 186.4 |
| D | 11 | 241 | 2741096 | 13987.55 | 773 | 747 | 195.9 |
| D | 1 | 52 | 952271 | 4856.86 | 773 | 747 | 195.9 |
| D | 8 | 48 | 550974 | 2808.52 | 773 | 747 | 195.9 |
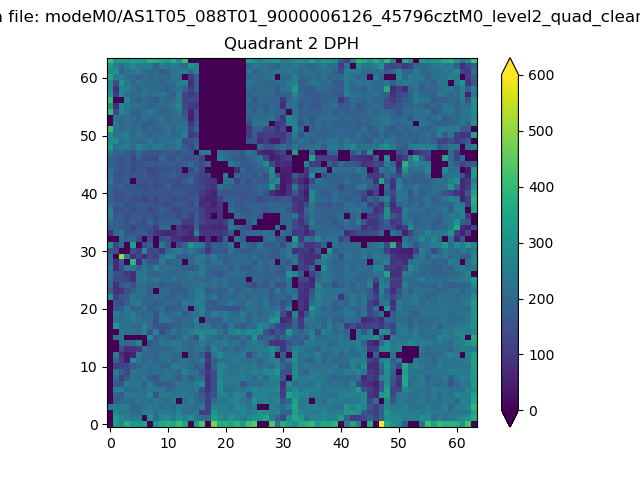
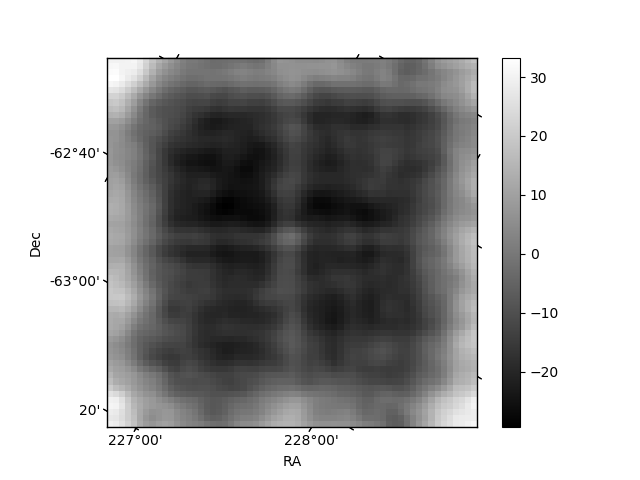
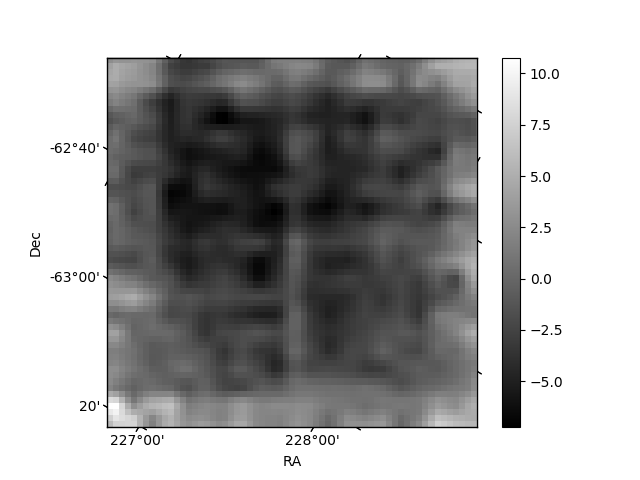
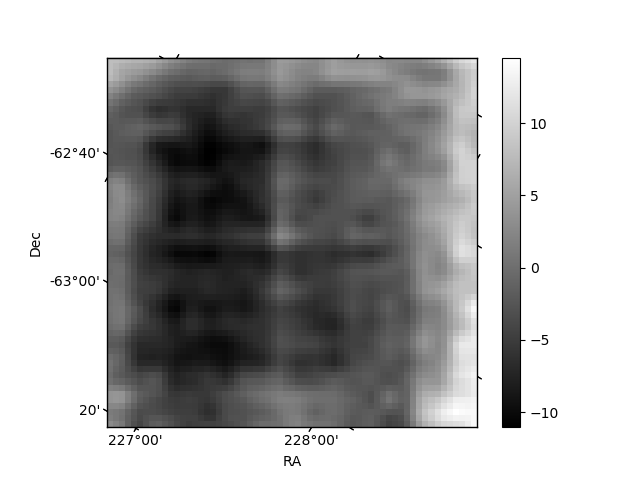
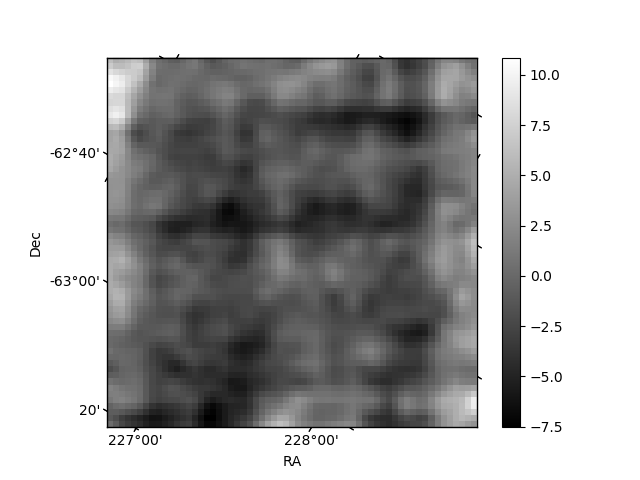
Histogram calculated using DETX and DETY for each event in the final _common_clean file
| Quadrant A | 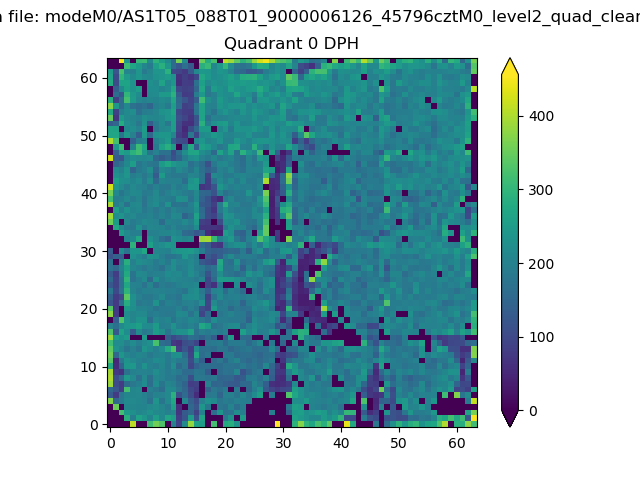 |
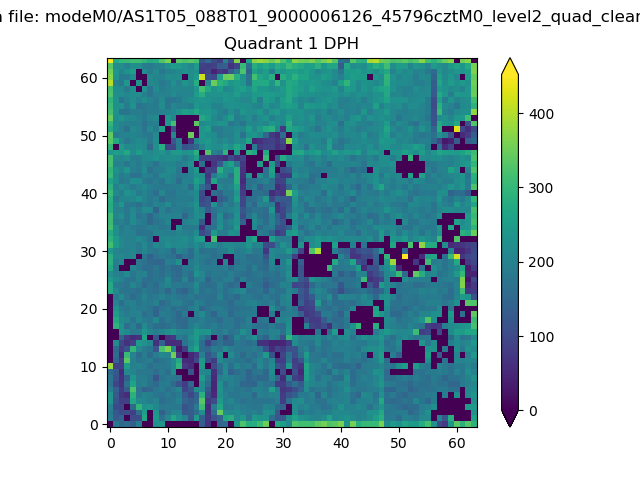 |
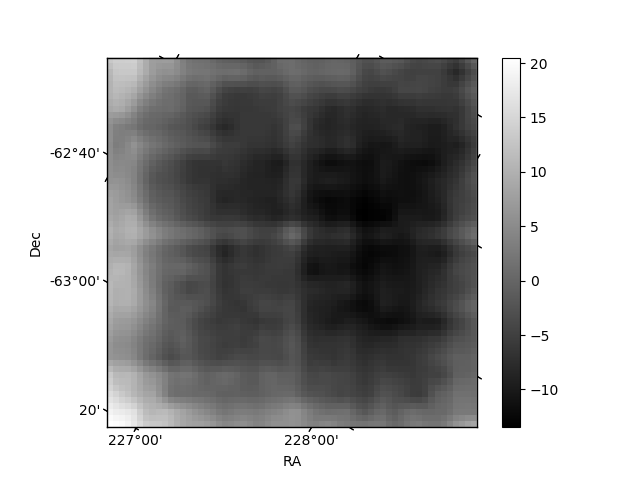
Quadrant B |
|---|---|---|---|
| Quadrant D | 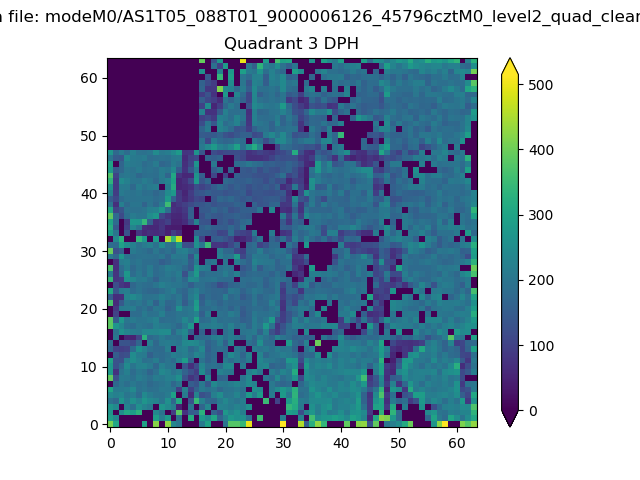 |
 |
Quadrant C |
| Plot type | Count rate plots | Images |
|---|---|---|
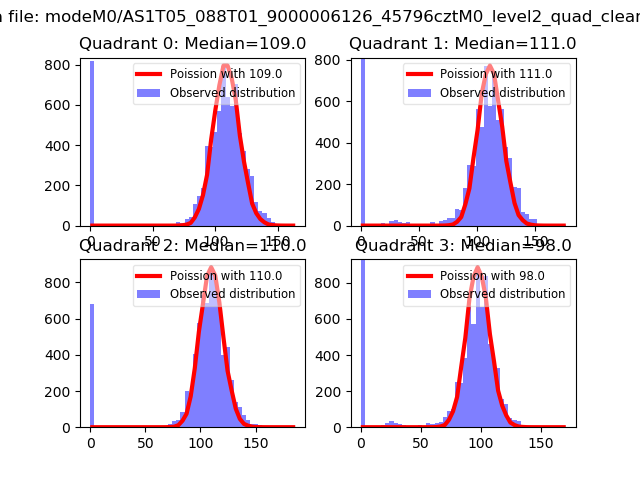
| Comparison with Poisson distribution Blue bars denote a histogram of data divided into 1 sec bins. Red curve is a Poisson curve with rate = median count rate of data. |
 |
 |
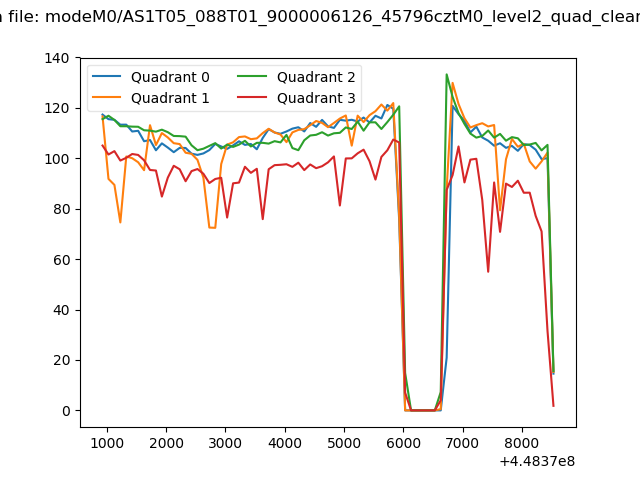
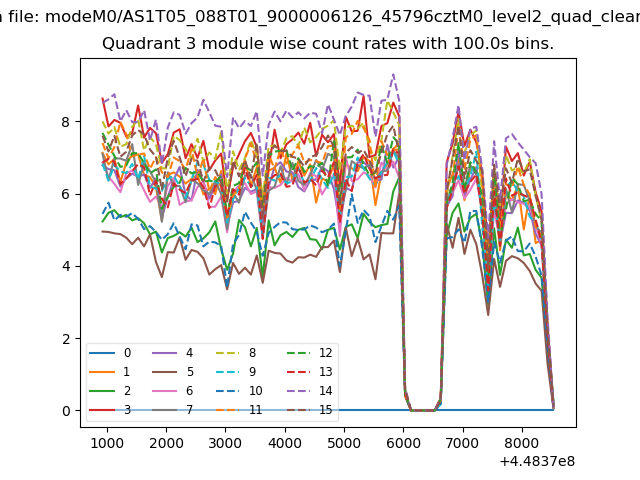
| Quadrant-wise count rates Data is divided into 100 sec bins |
 |
|
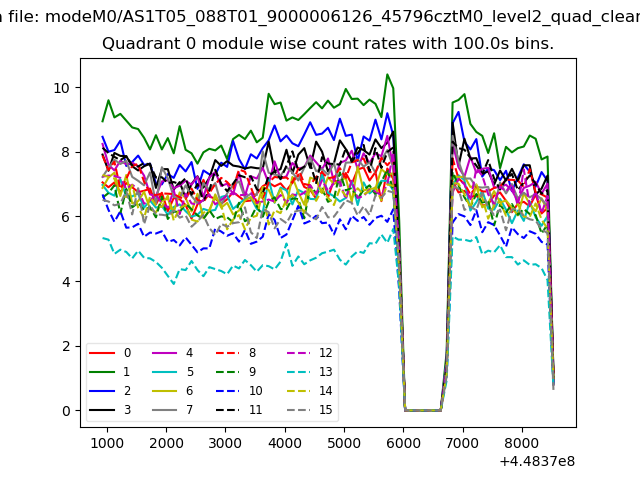
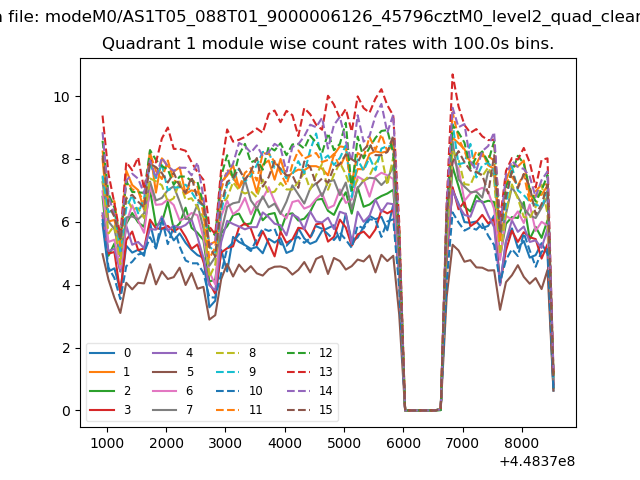
| Module-wise count rates for Quadrant A Data is divided into 100 sec bins |
 |
 |
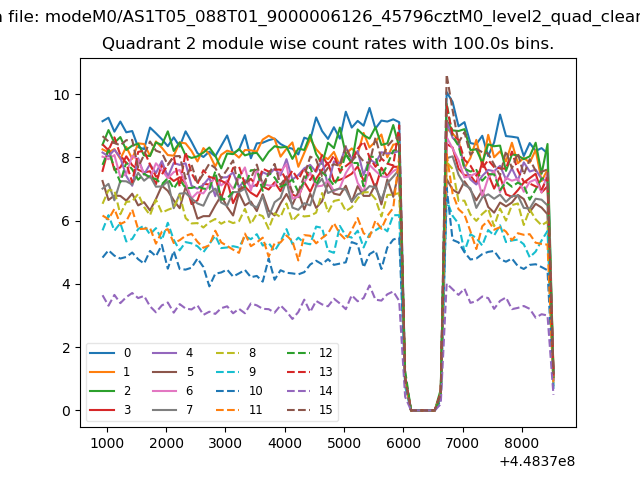
| Module-wise count rates for Quadrant B Data is divided into 100 sec bins |
 |
 |
| Module-wise count rates for Quadrant C Data is divided into 100 sec bins |
 |
 |
| Module-wise count rates for Quadrant D Data is divided into 100 sec bins |
 |
 |
| Parameter | Plot |
|---|---|
| CZT HV Monitor | 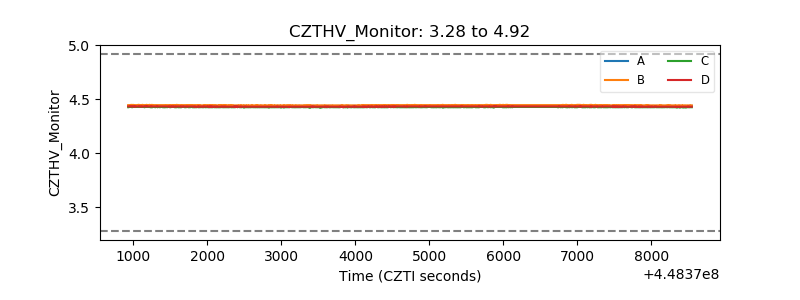 |
| D_VDD | 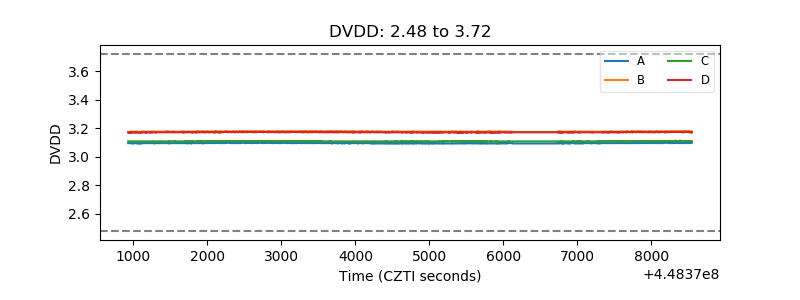 |
| Temperature 1 | 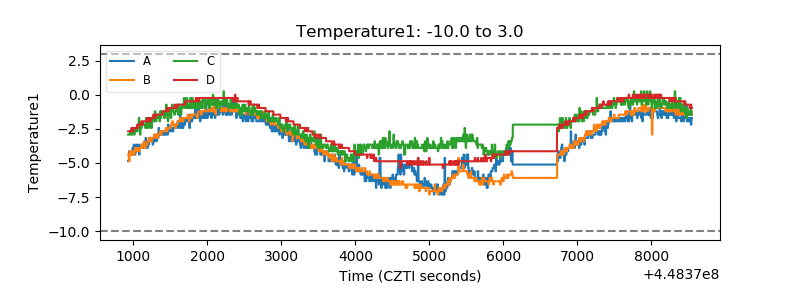 |
| Veto HV Monitor | 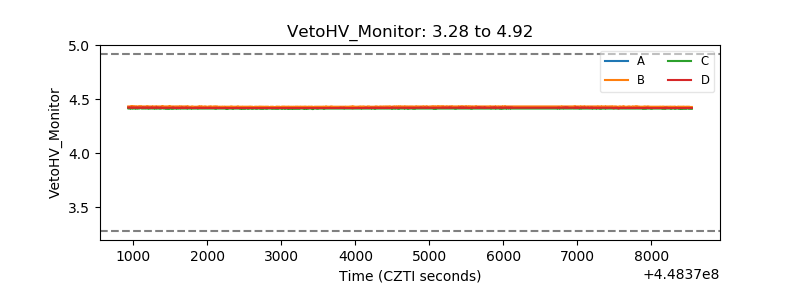 |
| Veto LLD |  |
| Alpha Counter | 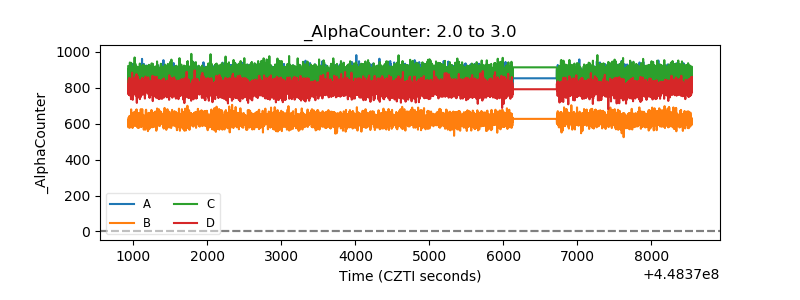 |
| _CPM_Rate | 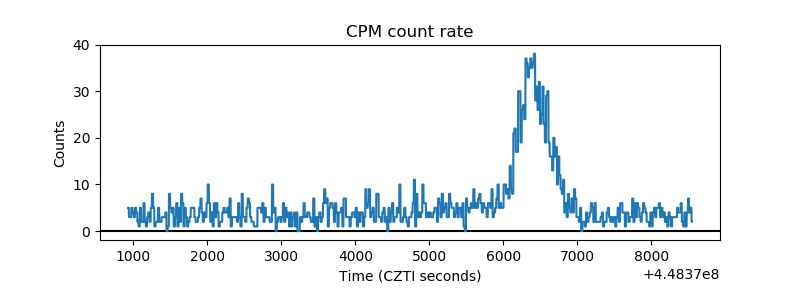 |
| CZT Counter | 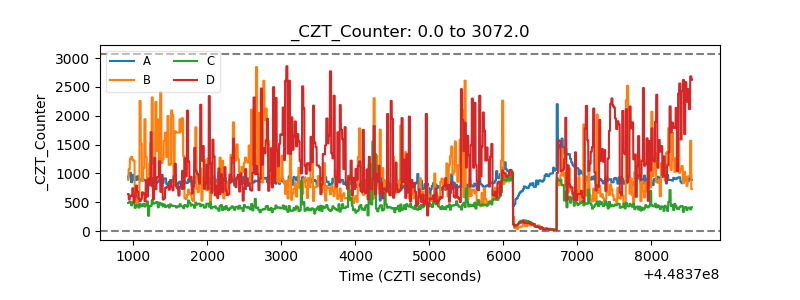 |
| +2.5 Volts monitor | 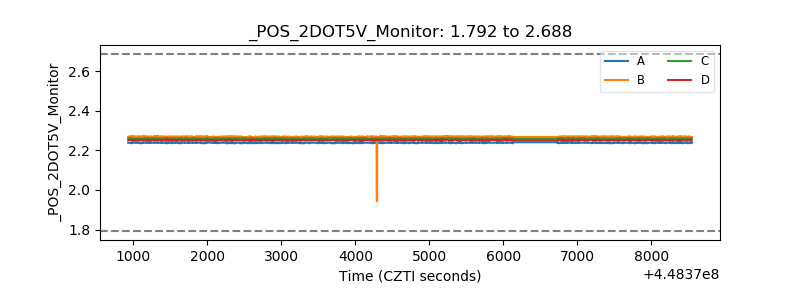 |
| +5 Volts monitor | 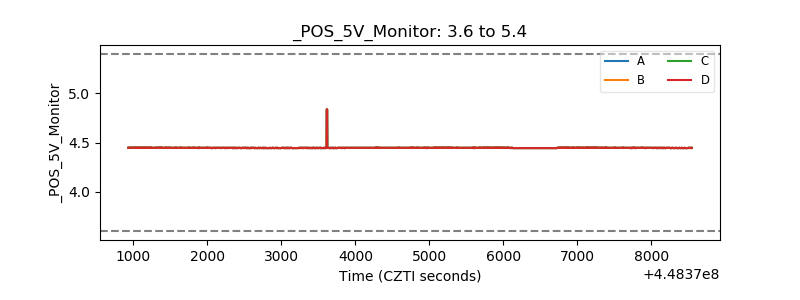 |
| _ROLL_ROT | 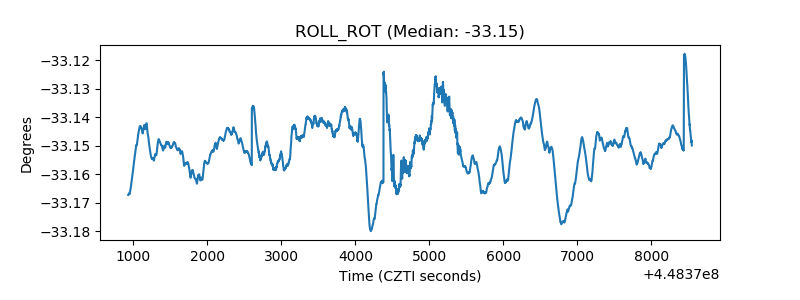 |
| _Roll_DEC | 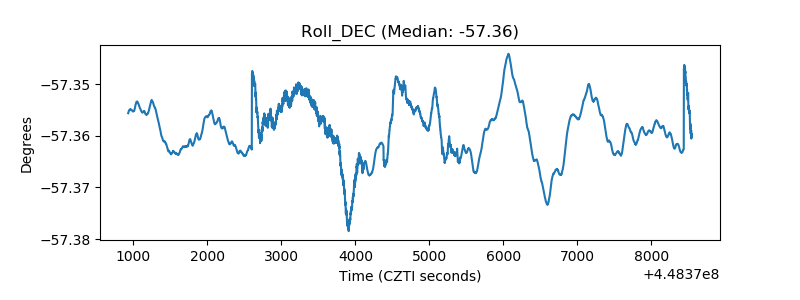 |
| _Roll_RA | 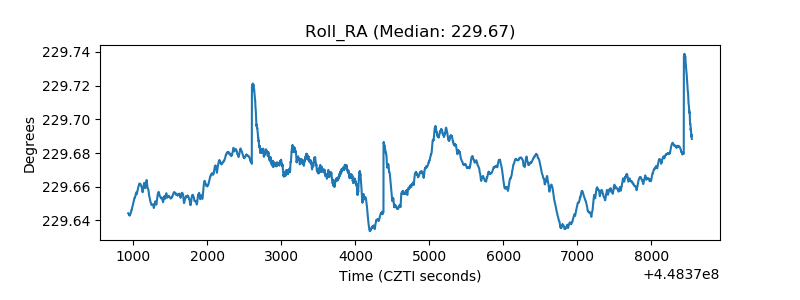 |
| Veto Counter | 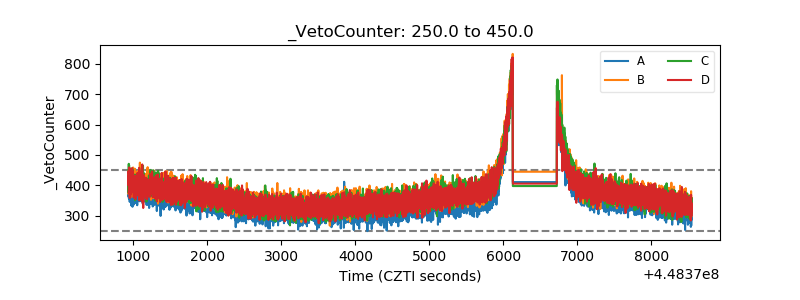 |