| Param | Original file | Final file |
|---|---|---|
| Filename | modeM0/AS1T05_088T01_9000006126_45797cztM0_level2.fits | modeM0/AS1T05_088T01_9000006126_45797cztM0_level2_quad_clean.evt |
| Size (bytes) | 712,195,200 | 118,039,680 |
| Size | 679.2 MB | 112.6 MB |
| Events in quadrant A | 6,552,156 | 786,396 |
| Events in quadrant B | 7,208,443 | 747,205 |
| Events in quadrant C | 3,461,491 | 822,920 |
| Events in quadrant D | 8,556,319 | 691,351 |
| Mode M0 | |||
|---|---|---|---|
| Quadrant | BADHDUFLAG | Total packets | Discarded packets |
| A | 0 | 23967 | 2 |
| B | 0 | 26731 | 0 |
| C | 0 | 15865 | 0 |
| D | 0 | 30761 | 0 |
| Mode SS | |||
|---|---|---|---|
| Quadrant | BADHDUFLAG | Total packets | Discarded packets |
| A | 0 | 150 | 0 |
| B | 0 | 150 | 0 |
| C | 0 | 150 | 0 |
| D | 0 | 150 | 0 |
| Quadrant | Total seconds | Saturated seconds | Saturation percentage |
|---|---|---|---|
| A | 7562 | 392 | 5.183814% |
| B | 7562 | 1016 | 13.435599% |
| C | 7563 | 105 | 1.388338% |
| D | 7563 | 900 | 11.900040% |
Noise dominated data is calculated using 1-second bins in cleaned event files. If a bin has >2000 counts, and if more than 50% of those come from <1% of pixels, then it is considered to be noise-dominated and hence unusable.
| Quadrant | # 1 sec bins | Bins with >0 counts | Bins with >2000 counts | High rate bins dominated by noise | Noise dominated (total time) | Noise dominated (detector-on time) | Marked lightcurve |
|---|---|---|---|---|---|---|---|
| A | 7562 | 7562 | 3 | 3 | 0.04% | 0.04% | 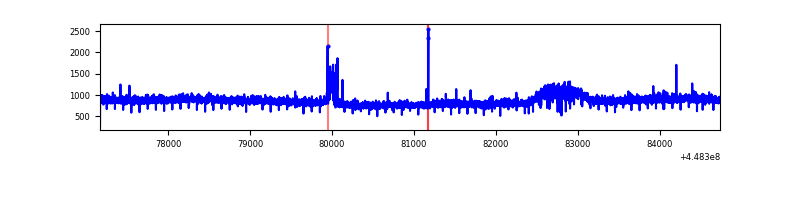 |
| B | 7562 | 7562 | 325 | 325 | 4.30% | 4.30% | 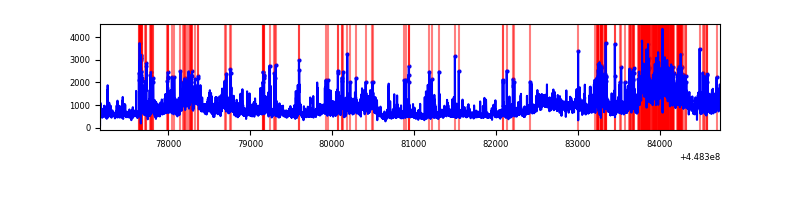 |
| C | 7563 | 7563 | 3 | 3 | 0.04% | 0.04% | 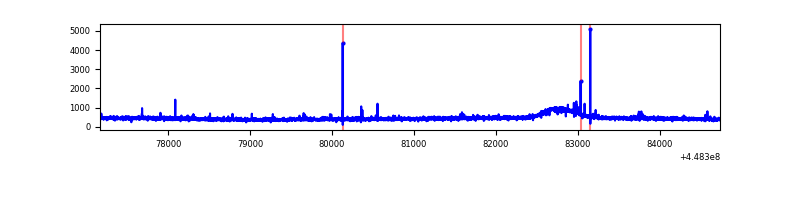 |
| D | 7563 | 7563 | 763 | 763 | 10.09% | 10.09% | 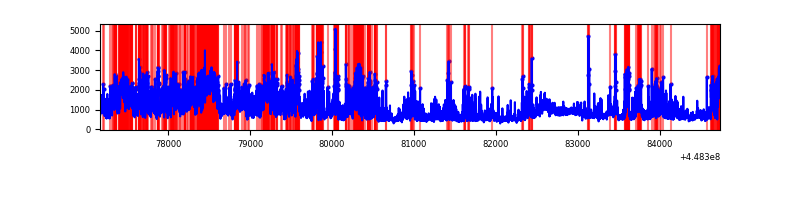 |
Top three noisy pixels from each quadrant. If the there are fewer than three noisy pixels in the level2.evt file, extra rows are filled as -1
| Pixel properties | Quadrant properties | ||||||
|---|---|---|---|---|---|---|---|
| Quadrant | DetID | PixID | Counts | Sigma | Mean | Median | Sigma |
| A | 10 | 83 | 3069428 | 16658.28 | 875 | 854 | 184.2 |
| A | 10 | 223 | 57166 | 305.7 | 875 | 854 | 184.2 |
| A | 2 | 79 | 18333 | 94.89 | 875 | 854 | 184.2 |
| B | 3 | 112 | 2856238 | 17102.73 | 850 | 824 | 167.0 |
| B | 4 | 171 | 267719 | 1598.59 | 850 | 824 | 167.0 |
| B | 0 | 171 | 161936 | 964.99 | 850 | 824 | 167.0 |
| C | 12 | 2 | 22891 | 107.26 | 873 | 876 | 205.2 |
| C | 2 | 14 | 20776 | 96.96 | 873 | 876 | 205.2 |
| C | 14 | 96 | 10294 | 45.89 | 873 | 876 | 205.2 |
| D | 11 | 241 | 2955796 | 13805.73 | 849 | 822 | 214.0 |
| D | 1 | 52 | 907392 | 4235.52 | 849 | 822 | 214.0 |
| D | 8 | 48 | 357586 | 1666.81 | 849 | 822 | 214.0 |
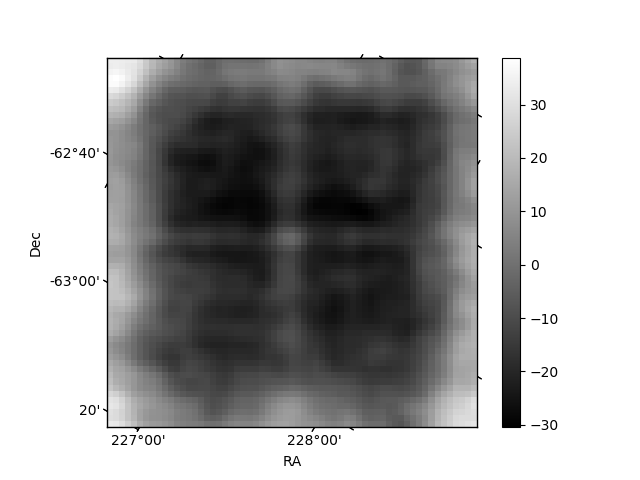
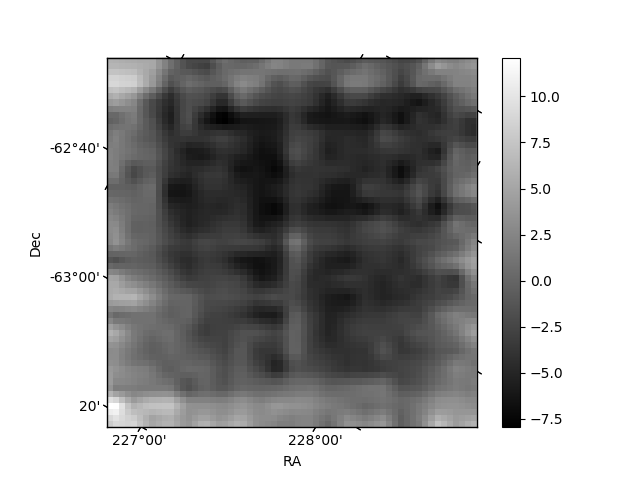
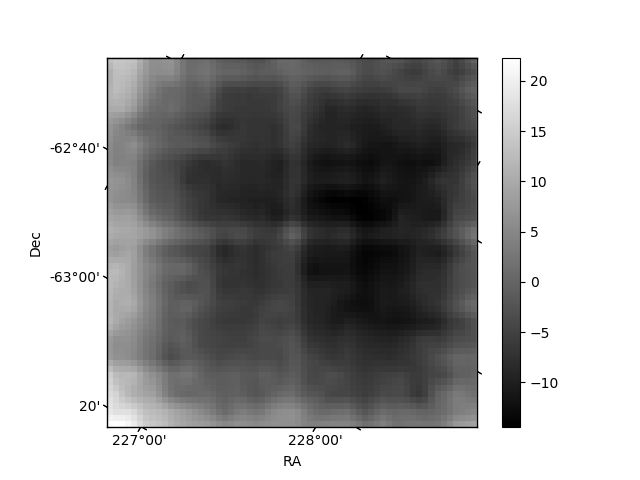
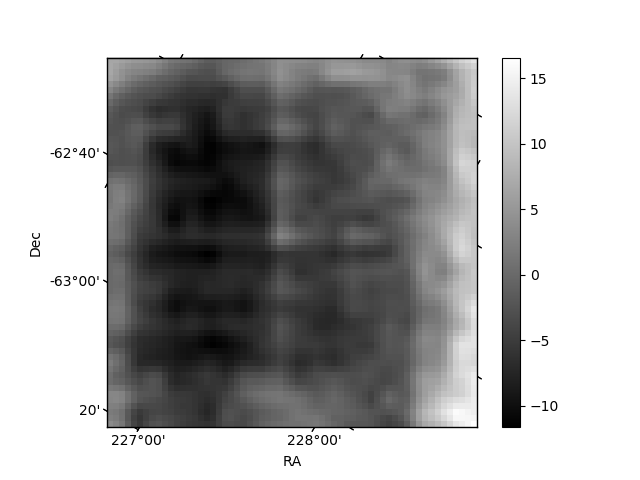
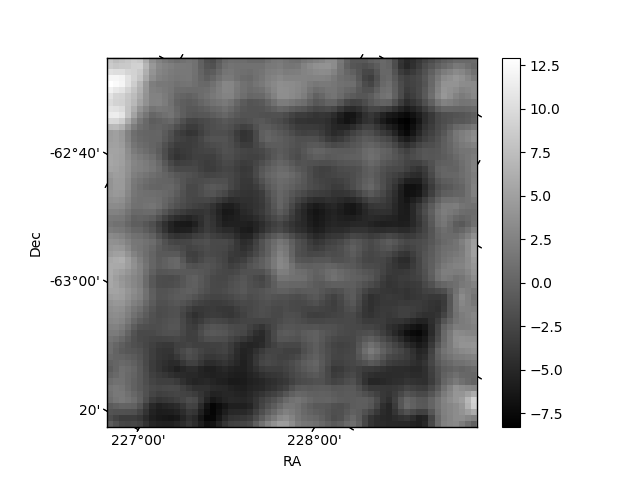
Histogram calculated using DETX and DETY for each event in the final _common_clean file
| Quadrant A | 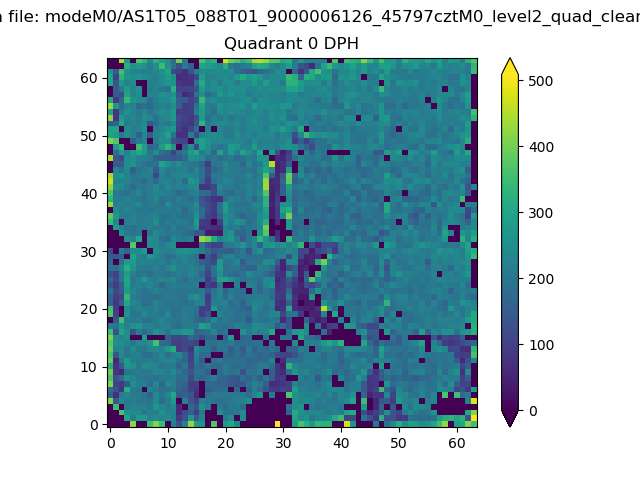 |
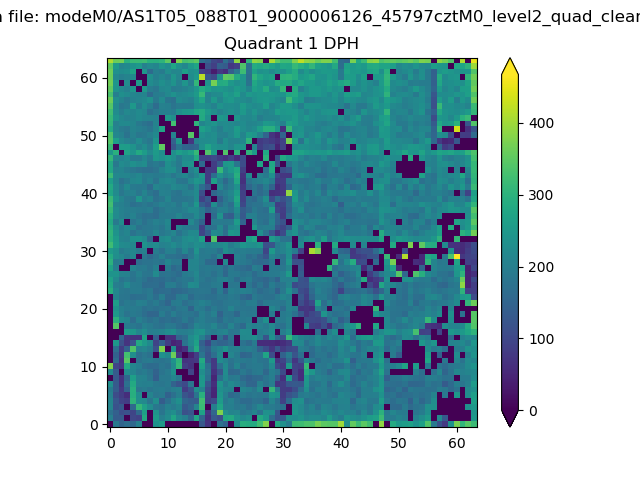 |
Quadrant B |
|---|---|---|---|
| Quadrant D | 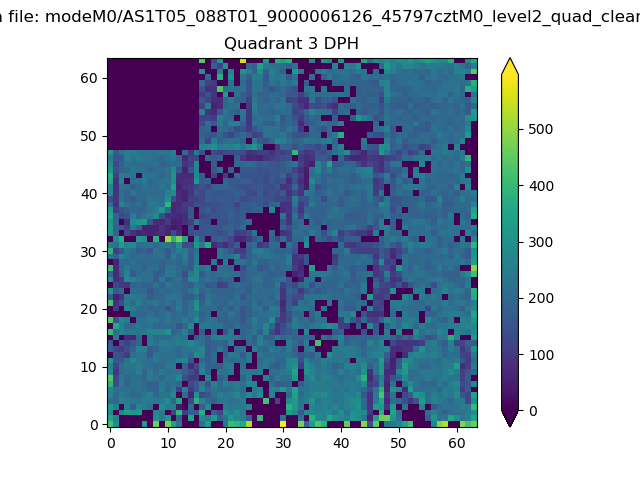 |
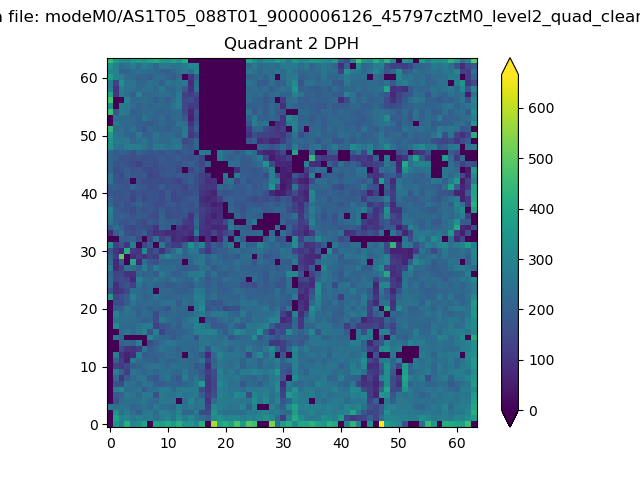 |
Quadrant C |
| Plot type | Count rate plots | Images |
|---|---|---|
| Comparison with Poisson distribution Blue bars denote a histogram of data divided into 1 sec bins. Red curve is a Poisson curve with rate = median count rate of data. |
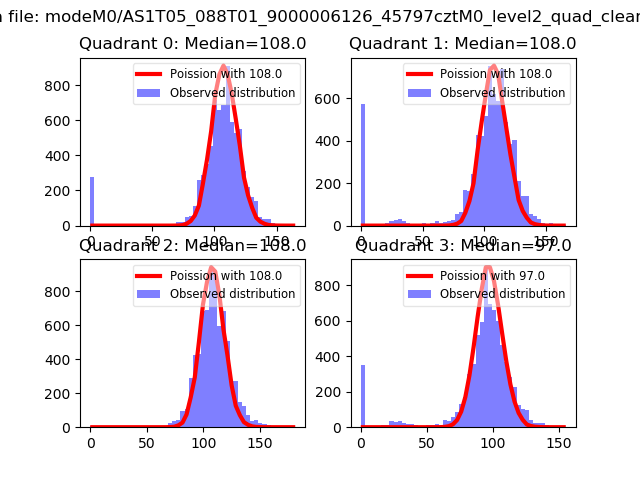 |
 |
| Quadrant-wise count rates Data is divided into 100 sec bins |
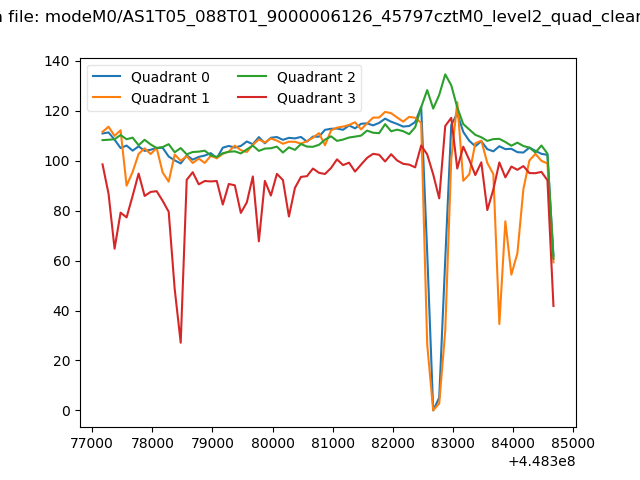 |
|
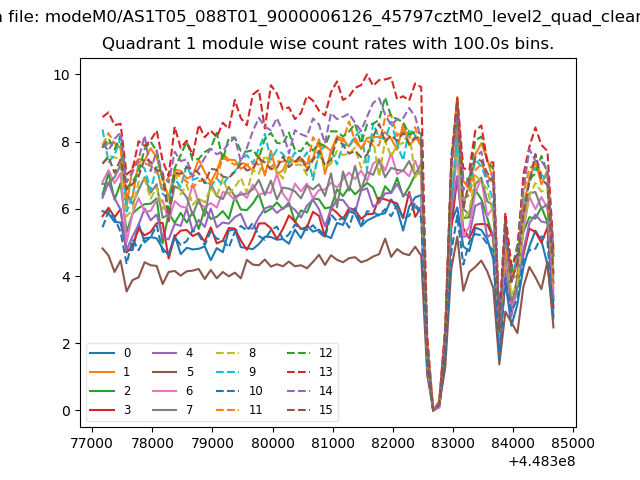
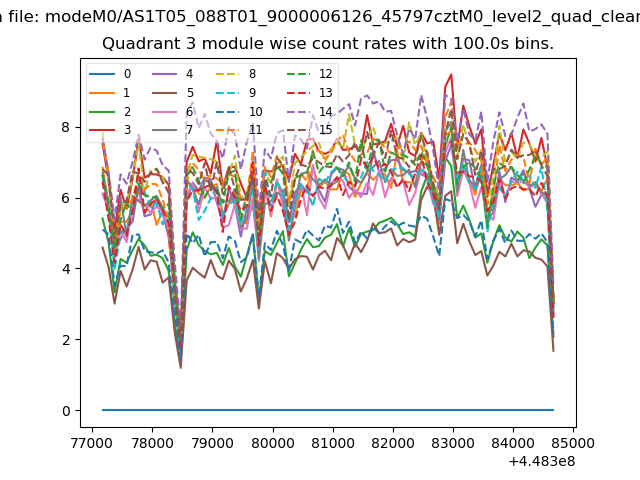
| Module-wise count rates for Quadrant A Data is divided into 100 sec bins |
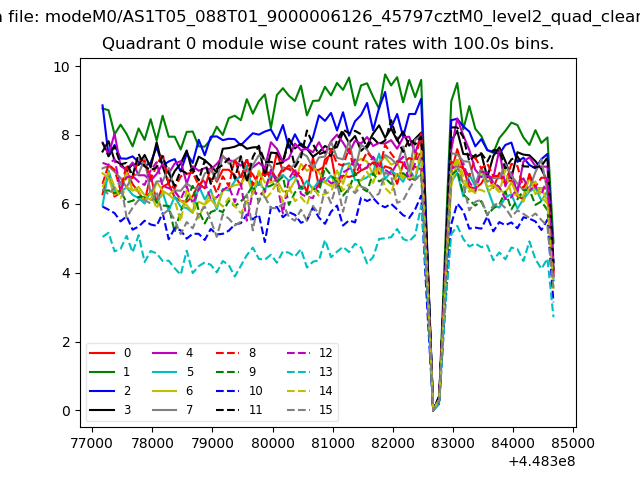 |
 |
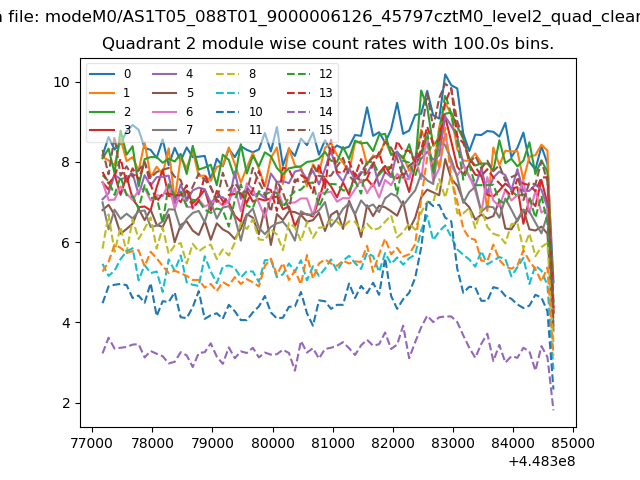
| Module-wise count rates for Quadrant B Data is divided into 100 sec bins |
 |
 |
| Module-wise count rates for Quadrant C Data is divided into 100 sec bins |
 |
 |
| Module-wise count rates for Quadrant D Data is divided into 100 sec bins |
 |
 |
| Parameter | Plot |
|---|---|
| CZT HV Monitor | 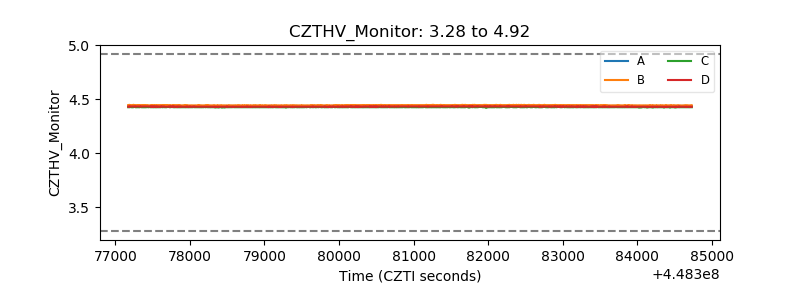 |
| D_VDD | 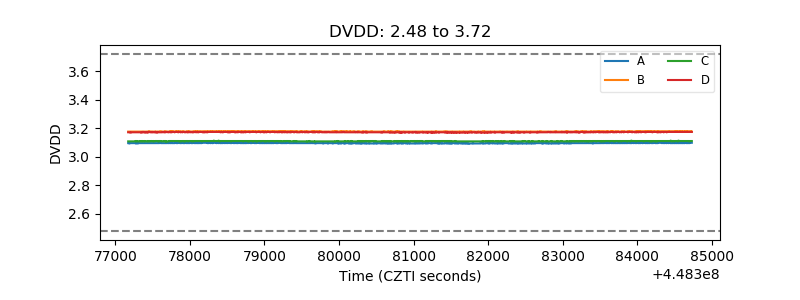 |
| Temperature 1 | 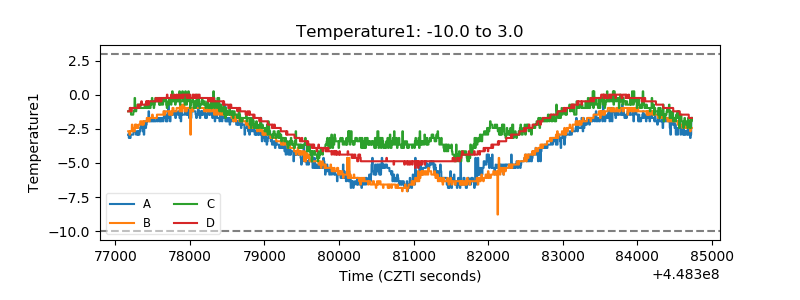 |
| Veto HV Monitor | 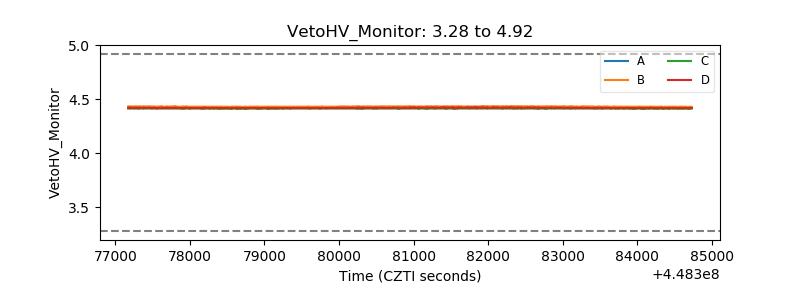 |
| Veto LLD | 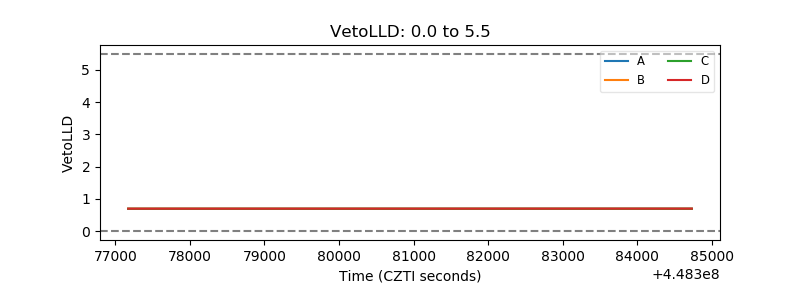 |
| Alpha Counter | 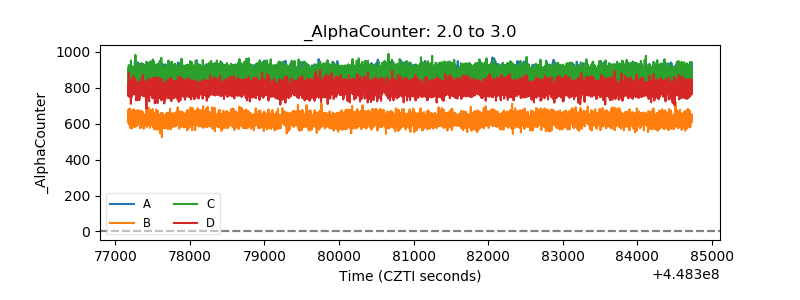 |
| _CPM_Rate | 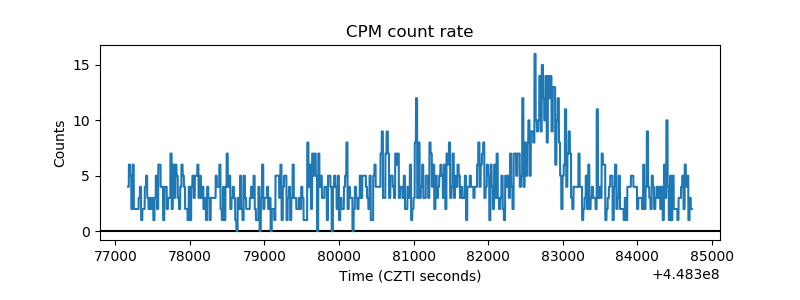 |
| CZT Counter | 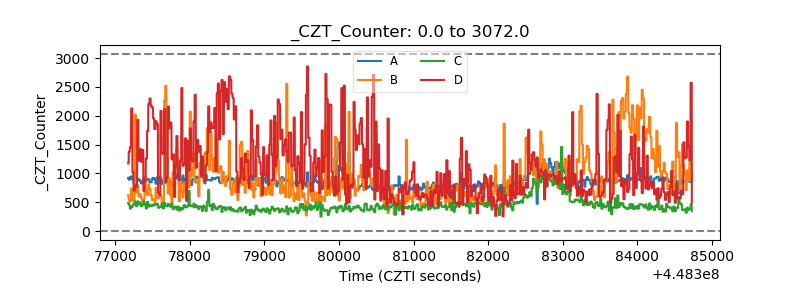 |
| +2.5 Volts monitor | 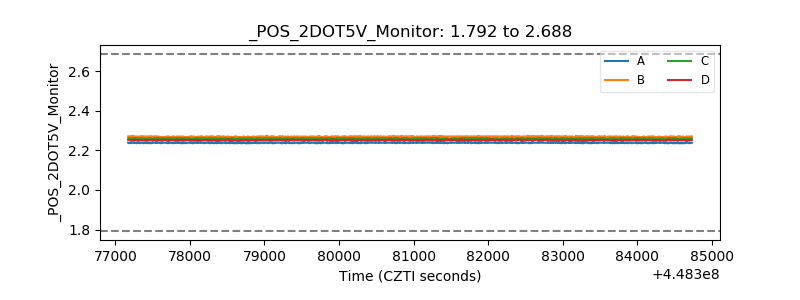 |
| +5 Volts monitor | 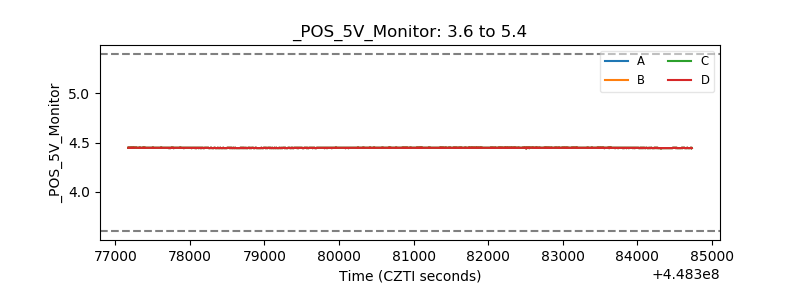 |
| _ROLL_ROT | 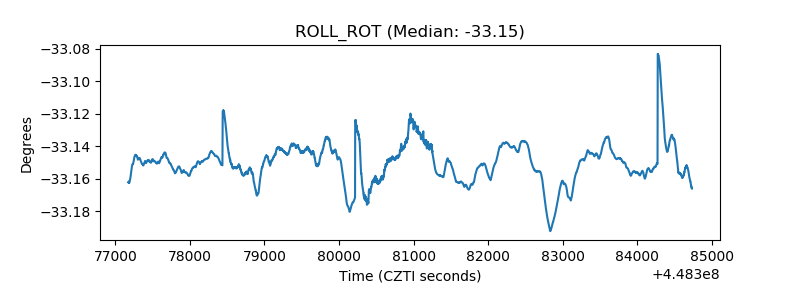 |
| _Roll_DEC | 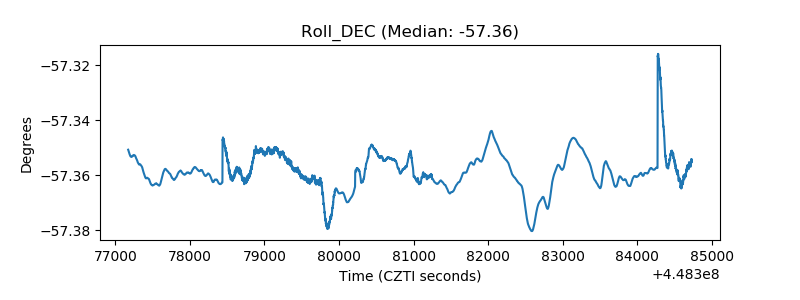 |
| _Roll_RA | 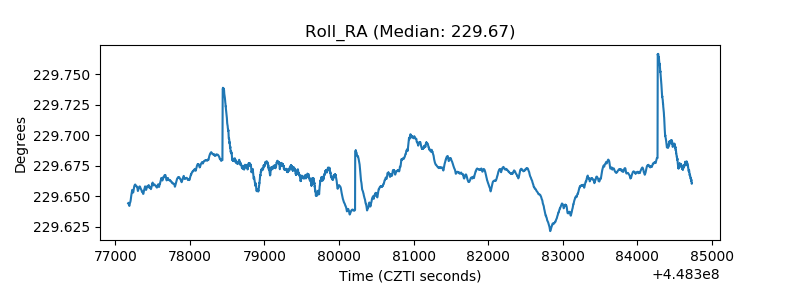 |
| Veto Counter | 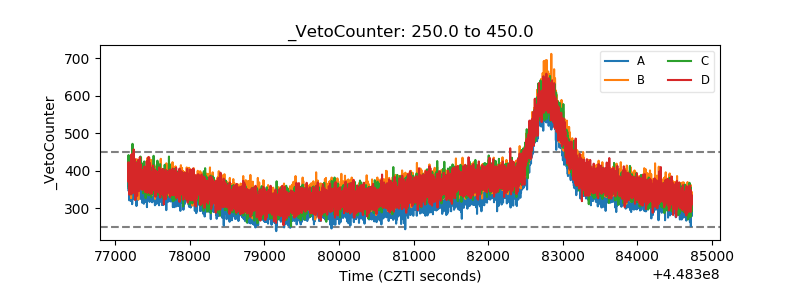 |