| Param | Original file | Final file |
|---|---|---|
| Filename | modeM0/AS1T05_088T01_9000006126_45798cztM0_level2.fits | modeM0/AS1T05_088T01_9000006126_45798cztM0_level2_quad_clean.evt |
| Size (bytes) | 697,432,320 | 122,068,800 |
| Size | 665.1 MB | 116.4 MB |
| Events in quadrant A | 6,665,190 | 838,050 |
| Events in quadrant B | 8,894,388 | 743,858 |
| Events in quadrant C | 3,379,230 | 834,528 |
| Events in quadrant D | 6,279,134 | 740,968 |
| Mode M0 | |||
|---|---|---|---|
| Quadrant | BADHDUFLAG | Total packets | Discarded packets |
| A | 0 | 24462 | 0 |
| B | 0 | 31960 | 0 |
| C | 0 | 15864 | 0 |
| D | 0 | 24078 | 0 |
| Mode SS | |||
|---|---|---|---|
| Quadrant | BADHDUFLAG | Total packets | Discarded packets |
| A | 0 | 154 | 0 |
| B | 0 | 154 | 0 |
| C | 0 | 154 | 0 |
| D | 0 | 154 | 0 |
| Quadrant | Total seconds | Saturated seconds | Saturation percentage |
|---|---|---|---|
| A | 7742 | 132 | 1.704986% |
| B | 7741 | 1411 | 18.227619% |
| C | 7742 | 14 | 0.180832% |
| D | 7742 | 314 | 4.055800% |
Noise dominated data is calculated using 1-second bins in cleaned event files. If a bin has >2000 counts, and if more than 50% of those come from <1% of pixels, then it is considered to be noise-dominated and hence unusable.
| Quadrant | # 1 sec bins | Bins with >0 counts | Bins with >2000 counts | High rate bins dominated by noise | Noise dominated (total time) | Noise dominated (detector-on time) | Marked lightcurve |
|---|---|---|---|---|---|---|---|
| A | 7742 | 7742 | 4 | 4 | 0.05% | 0.05% | 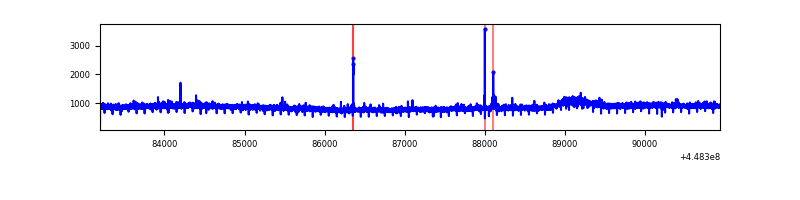 |
| B | 7741 | 7741 | 654 | 654 | 8.45% | 8.45% | 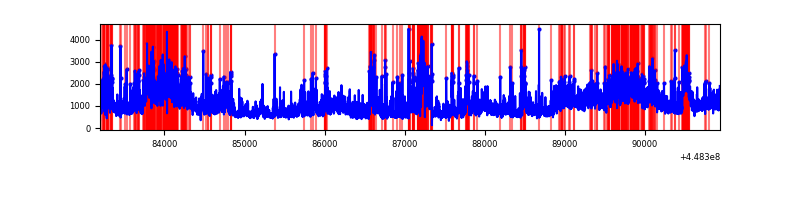 |
| C | 7742 | 7742 | 0 | 0 | 0.00% | 0.00% | 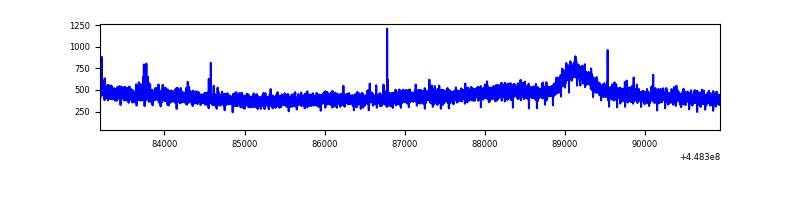 |
| D | 7742 | 7742 | 298 | 298 | 3.85% | 3.85% | 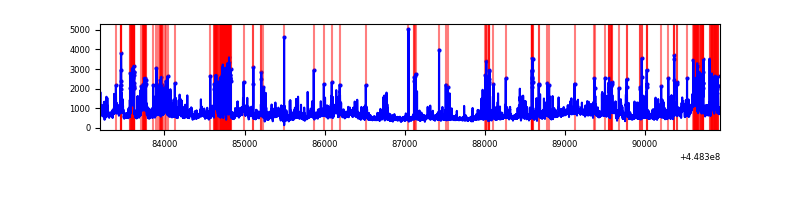 |
Top three noisy pixels from each quadrant. If the there are fewer than three noisy pixels in the level2.evt file, extra rows are filled as -1
| Pixel properties | Quadrant properties | ||||||
|---|---|---|---|---|---|---|---|
| Quadrant | DetID | PixID | Counts | Sigma | Mean | Median | Sigma |
| A | 10 | 83 | 3202449 | 17524.65 | 876 | 855 | 182.7 |
| A | 14 | 235 | 20863 | 109.52 | 876 | 855 | 182.7 |
| A | 13 | 254 | 15239 | 78.73 | 876 | 855 | 182.7 |
| B | 3 | 112 | 4508333 | 27773.74 | 832 | 807 | 162.3 |
| B | 4 | 171 | 246443 | 1513.52 | 832 | 807 | 162.3 |
| B | 0 | 189 | 176026 | 1079.64 | 832 | 807 | 162.3 |
| C | 3 | 233 | 12525 | 57.5 | 861 | 863 | 202.8 |
| C | 13 | 61 | 5905 | 24.86 | 861 | 863 | 202.8 |
| C | 12 | 2 | 4771 | 19.27 | 861 | 863 | 202.8 |
| D | 11 | 241 | 1251514 | 5891.41 | 850 | 825 | 212.3 |
| D | 8 | 48 | 495876 | 2331.95 | 850 | 825 | 212.3 |
| D | 12 | 2 | 340187 | 1598.58 | 850 | 825 | 212.3 |
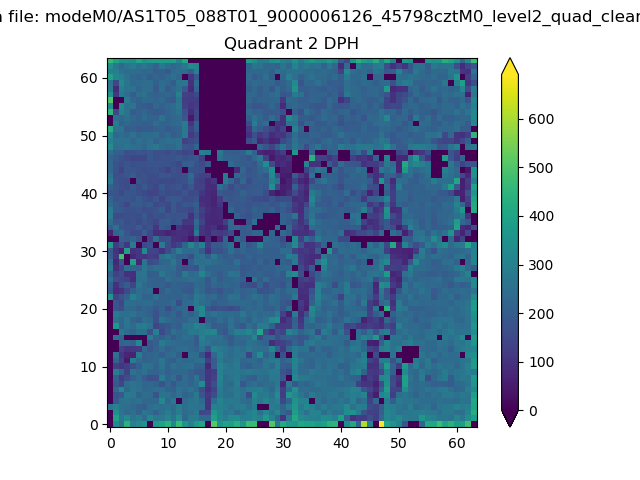
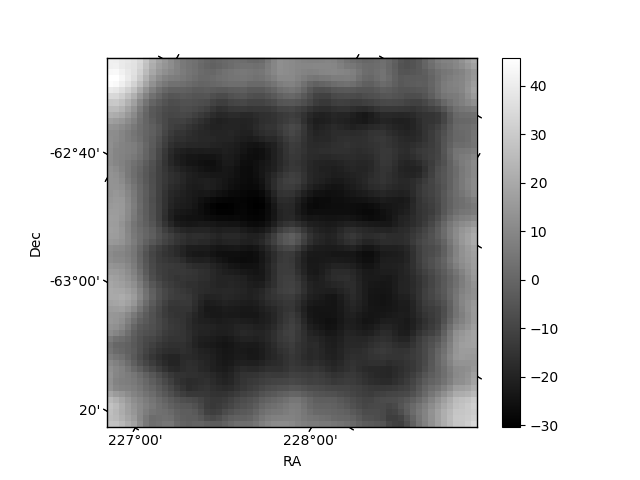
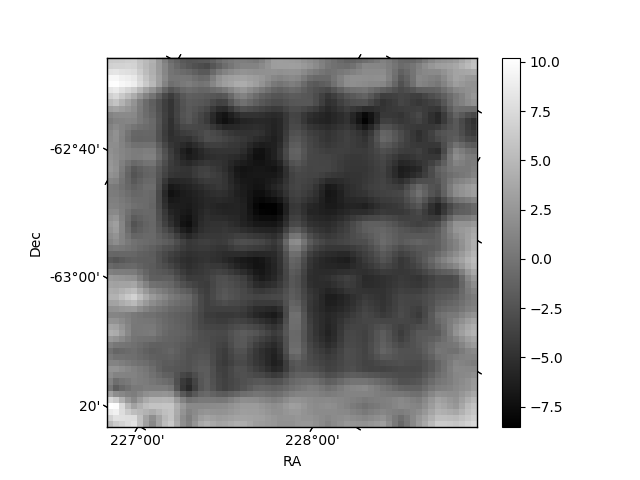
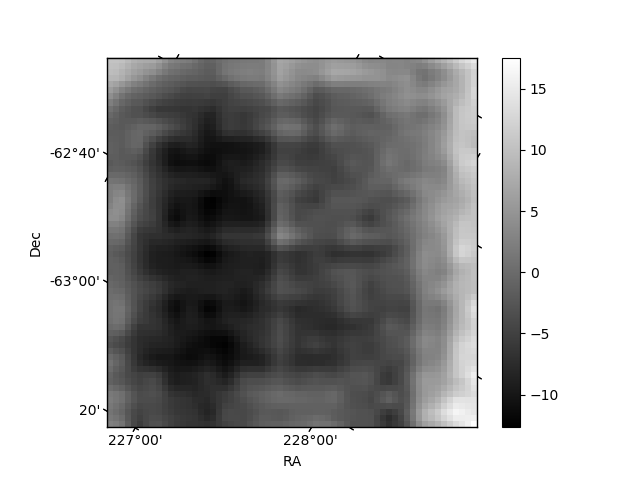
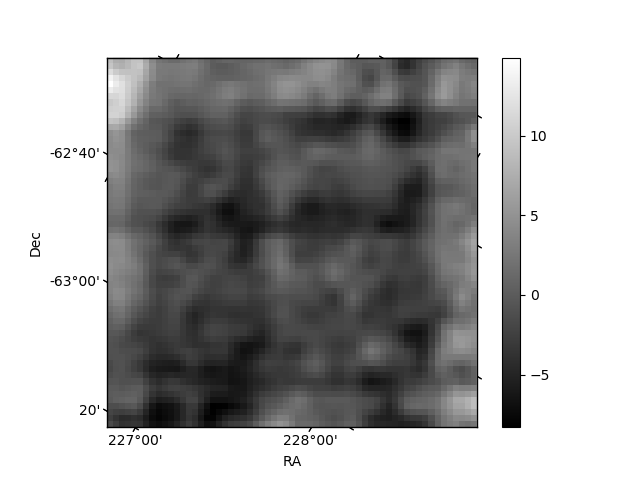
Histogram calculated using DETX and DETY for each event in the final _common_clean file
| Quadrant A | 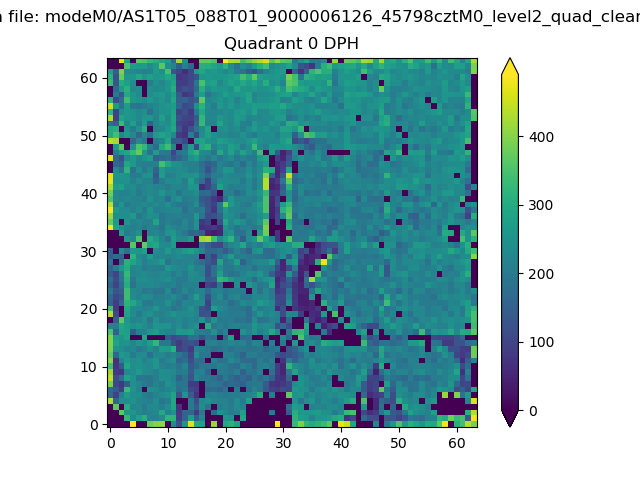 |
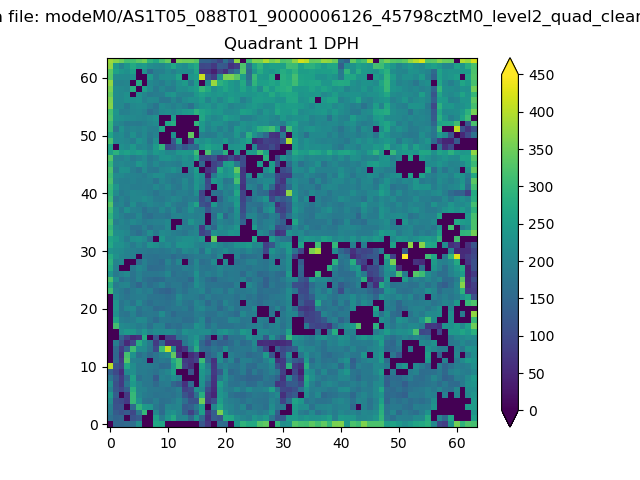 |
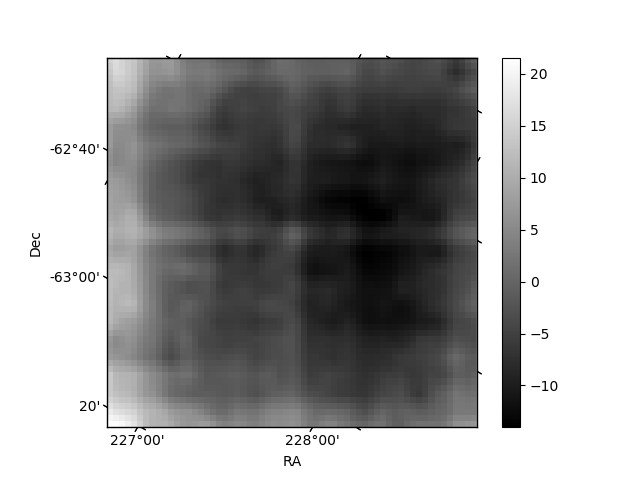
Quadrant B |
|---|---|---|---|
| Quadrant D | 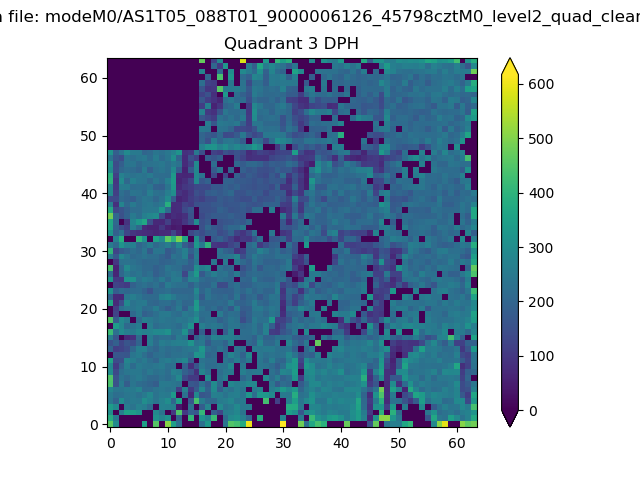 |
 |
Quadrant C |
| Plot type | Count rate plots | Images |
|---|---|---|
| Comparison with Poisson distribution Blue bars denote a histogram of data divided into 1 sec bins. Red curve is a Poisson curve with rate = median count rate of data. |
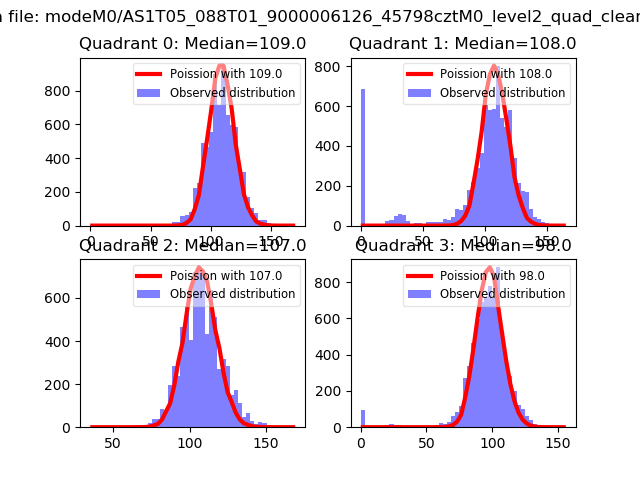 |
 |
| Quadrant-wise count rates Data is divided into 100 sec bins |
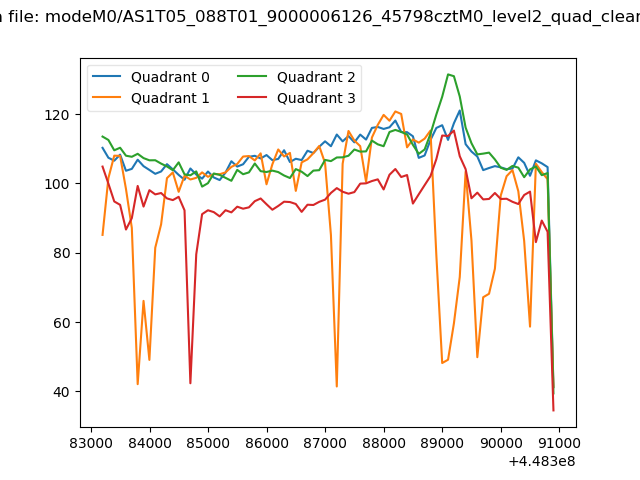 |
|
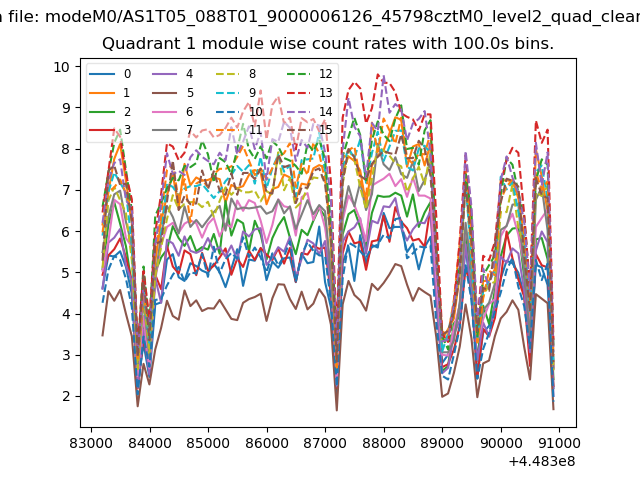
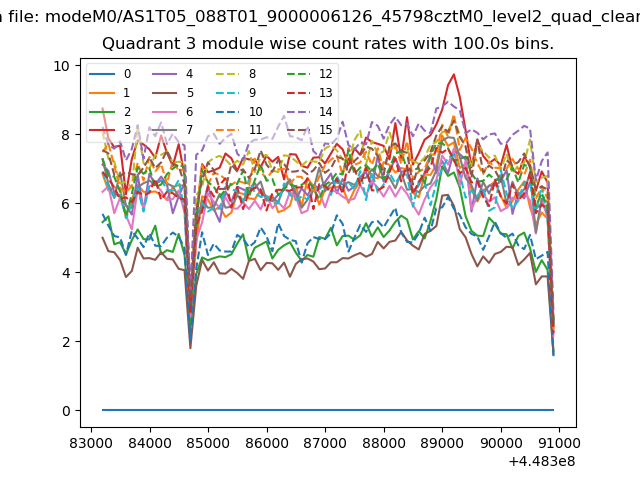
| Module-wise count rates for Quadrant A Data is divided into 100 sec bins |
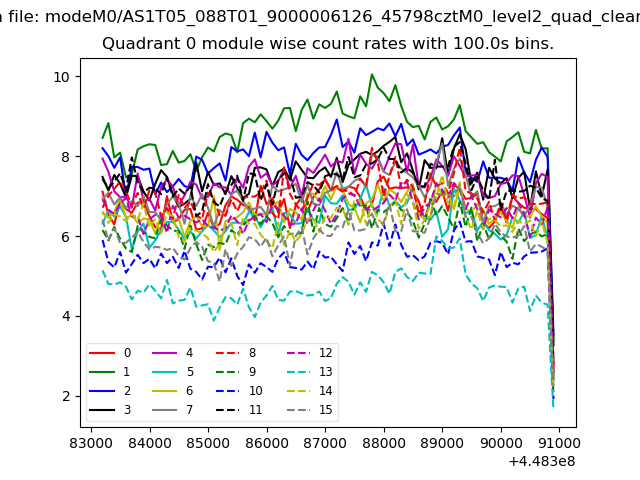 |
 |
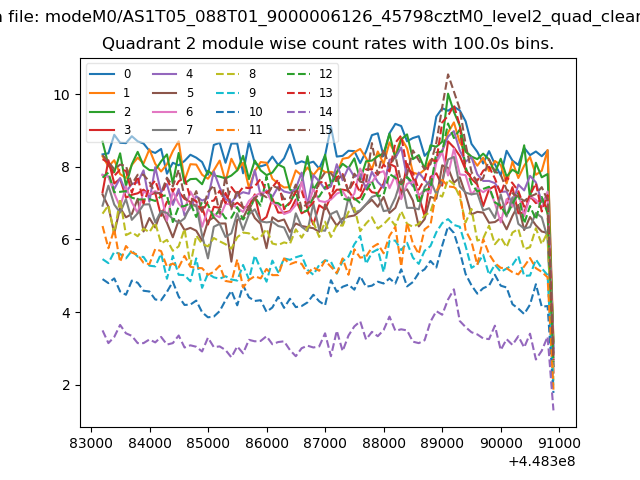
| Module-wise count rates for Quadrant B Data is divided into 100 sec bins |
 |
 |
| Module-wise count rates for Quadrant C Data is divided into 100 sec bins |
 |
 |
| Module-wise count rates for Quadrant D Data is divided into 100 sec bins |
 |
 |
| Parameter | Plot |
|---|---|
| CZT HV Monitor | 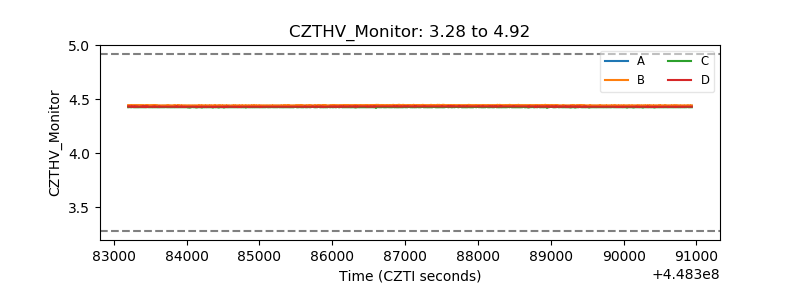 |
| D_VDD | 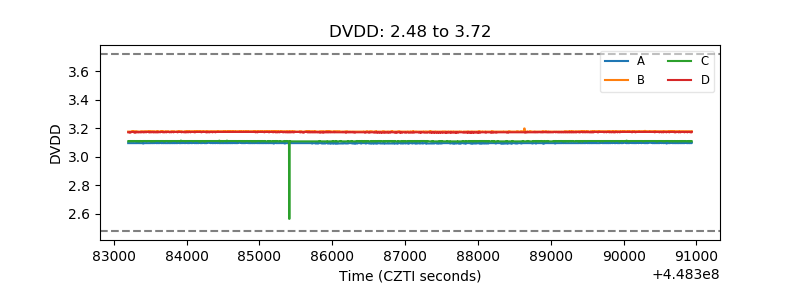 |
| Temperature 1 | 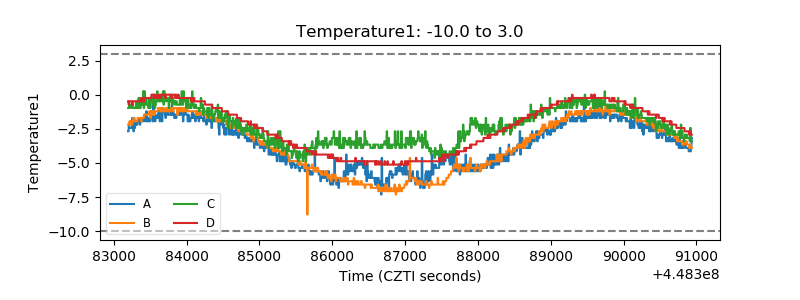 |
| Veto HV Monitor | 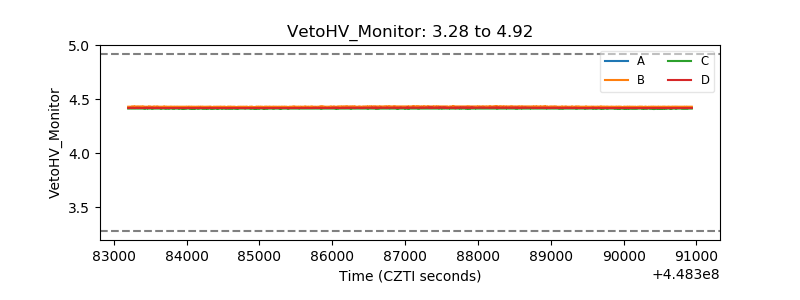 |
| Veto LLD | 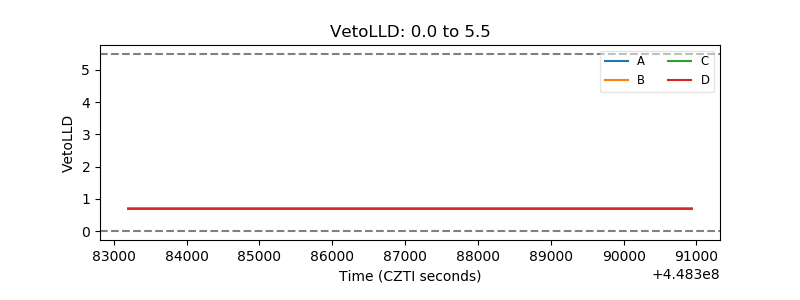 |
| Alpha Counter | 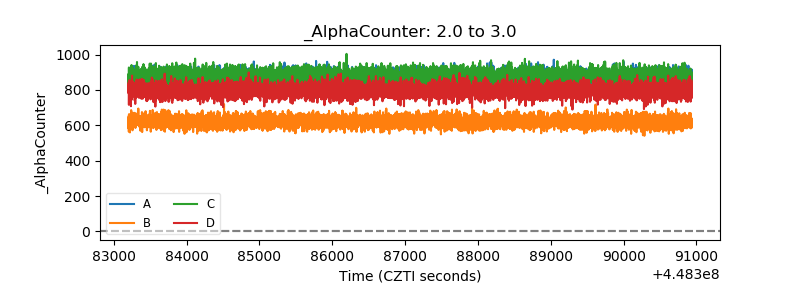 |
| _CPM_Rate | 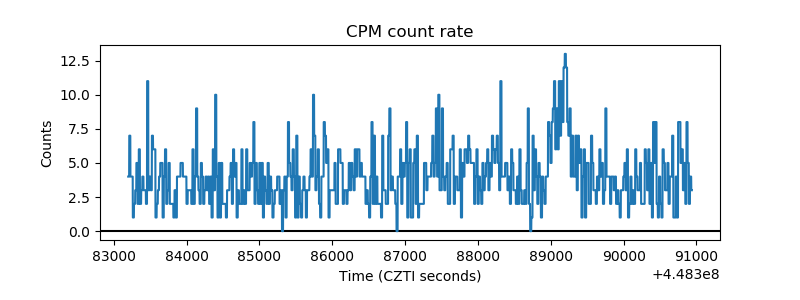 |
| CZT Counter | 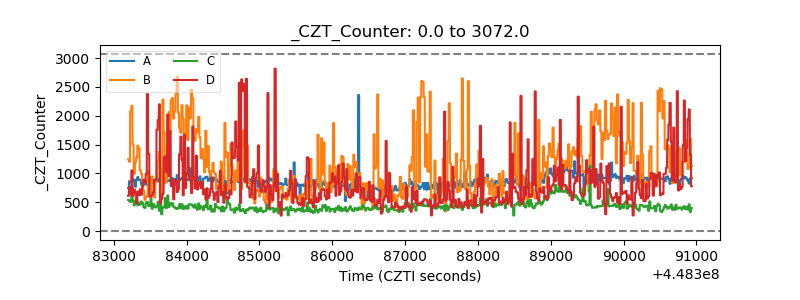 |
| +2.5 Volts monitor |  |
| +5 Volts monitor | 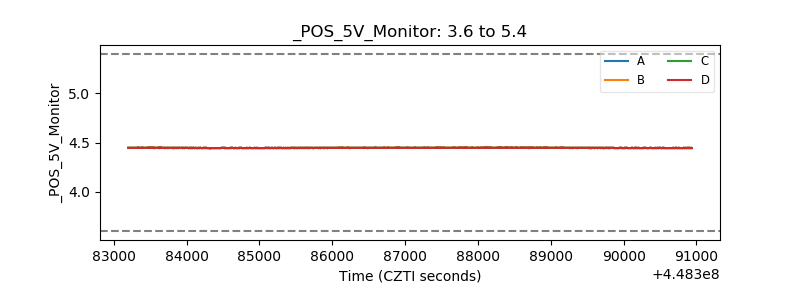 |
| _ROLL_ROT | 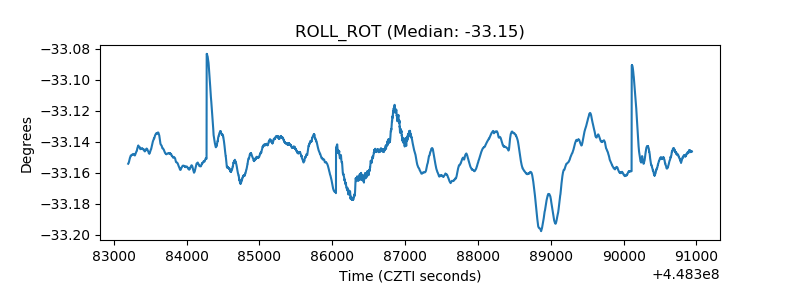 |
| _Roll_DEC | 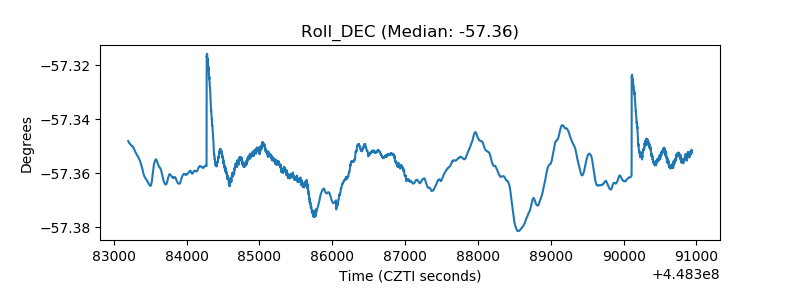 |
| _Roll_RA | 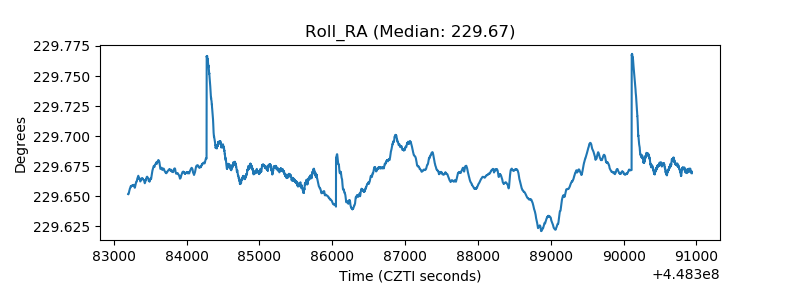 |
| Veto Counter | 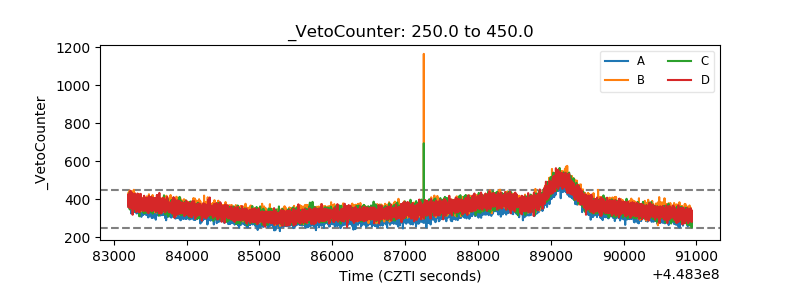 |