| Param | Original file | Final file |
|---|---|---|
| Filename | modeM0/AS1T05_088T01_9000006126_45799cztM0_level2.fits | modeM0/AS1T05_088T01_9000006126_45799cztM0_level2_quad_clean.evt |
| Size (bytes) | 857,836,800 | 117,411,840 |
| Size | 818.1 MB | 112.0 MB |
| Events in quadrant A | 6,869,471 | 832,103 |
| Events in quadrant B | 11,682,074 | 633,976 |
| Events in quadrant C | 4,205,872 | 832,077 |
| Events in quadrant D | 8,390,182 | 710,064 |
| Mode M9 | |||
|---|---|---|---|
| Quadrant | BADHDUFLAG | Total packets | Discarded packets |
| A | 0 | 1 | 0 |
| B | 0 | 1 | 0 |
| C | 0 | 1 | 0 |
| D | 0 | 1 | 0 |
| Mode M0 | |||
|---|---|---|---|
| Quadrant | BADHDUFLAG | Total packets | Discarded packets |
| A | 0 | 25291 | 2 |
| B | 0 | 40230 | 5 |
| C | 0 | 18167 | 2 |
| D | 0 | 30491 | 2 |
| Mode SS | |||
|---|---|---|---|
| Quadrant | BADHDUFLAG | Total packets | Discarded packets |
| A | 0 | 158 | 0 |
| B | 0 | 158 | 0 |
| C | 0 | 158 | 0 |
| D | 0 | 158 | 0 |
| Quadrant | Total seconds | Saturated seconds | Saturation percentage |
|---|---|---|---|
| A | 7859 | 271 | 3.448276% |
| B | 7858 | 2704 | 34.410792% |
| C | 7858 | 160 | 2.036142% |
| D | 7858 | 843 | 10.727921% |
Noise dominated data is calculated using 1-second bins in cleaned event files. If a bin has >2000 counts, and if more than 50% of those come from <1% of pixels, then it is considered to be noise-dominated and hence unusable.
| Quadrant | # 1 sec bins | Bins with >0 counts | Bins with >2000 counts | High rate bins dominated by noise | Noise dominated (total time) | Noise dominated (detector-on time) | Marked lightcurve |
|---|---|---|---|---|---|---|---|
| A | 7939 | 7861 | 29 | 29 | 0.37% | 0.37% | 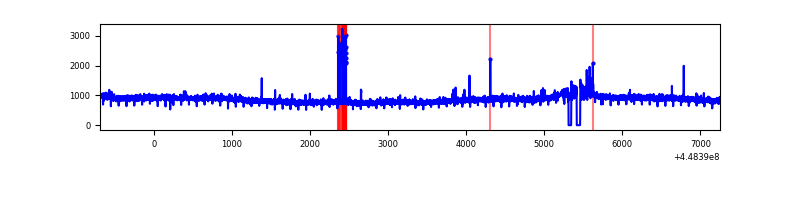 |
| B | 7938 | 7860 | 1592 | 1592 | 20.06% | 20.25% | 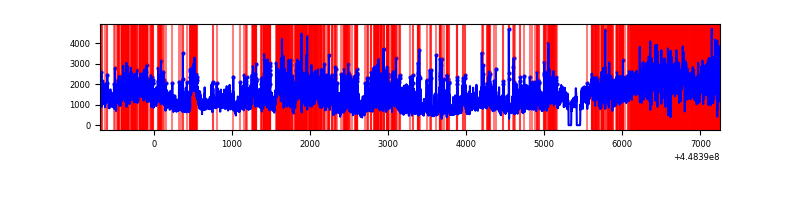 |
| C | 7938 | 7860 | 100 | 100 | 1.26% | 1.27% | 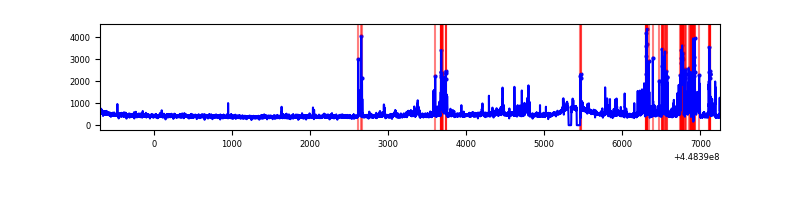 |
| D | 7938 | 7860 | 665 | 665 | 8.38% | 8.46% | 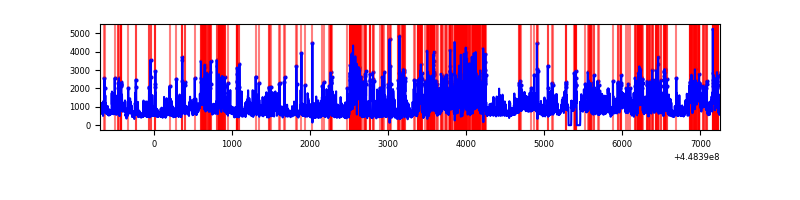 |
Top three noisy pixels from each quadrant. If the there are fewer than three noisy pixels in the level2.evt file, extra rows are filled as -1
| Pixel properties | Quadrant properties | ||||||
|---|---|---|---|---|---|---|---|
| Quadrant | DetID | PixID | Counts | Sigma | Mean | Median | Sigma |
| A | 10 | 83 | 3291970 | 17890.84 | 888 | 870 | 184.0 |
| A | 9 | 191 | 67480 | 362.1 | 888 | 870 | 184.0 |
| A | 13 | 248 | 32254 | 170.61 | 888 | 870 | 184.0 |
| B | 3 | 112 | 7778578 | 49421.45 | 802 | 776 | 157.4 |
| B | 4 | 171 | 180577 | 1142.49 | 802 | 776 | 157.4 |
| B | 5 | 172 | 140455 | 887.54 | 802 | 776 | 157.4 |
| C | 12 | 2 | 752814 | 3709.97 | 866 | 868 | 202.7 |
| C | 12 | 249 | 44089 | 213.25 | 866 | 868 | 202.7 |
| C | 3 | 233 | 13202 | 60.85 | 866 | 868 | 202.7 |
| D | 11 | 241 | 2582084 | 12191.78 | 839 | 812 | 211.7 |
| D | 12 | 2 | 866668 | 4089.58 | 839 | 812 | 211.7 |
| D | 2 | 249 | 819902 | 3868.7 | 839 | 812 | 211.7 |
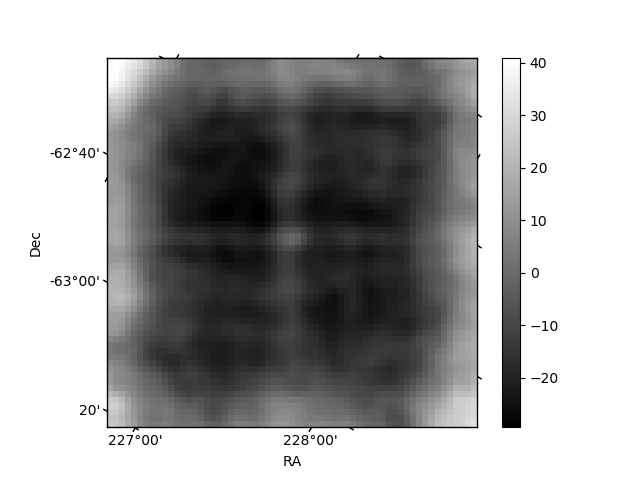
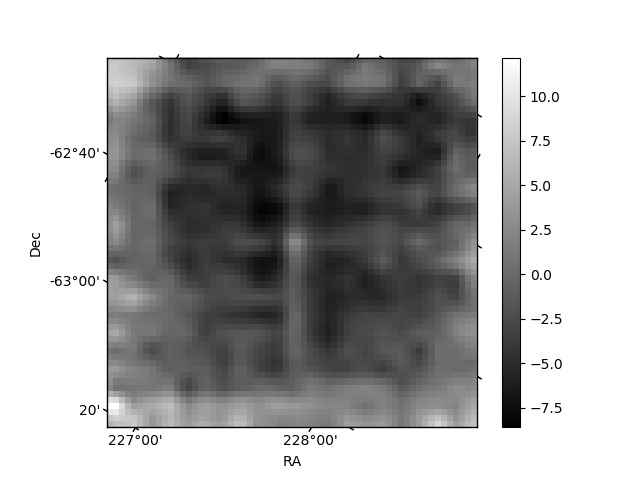
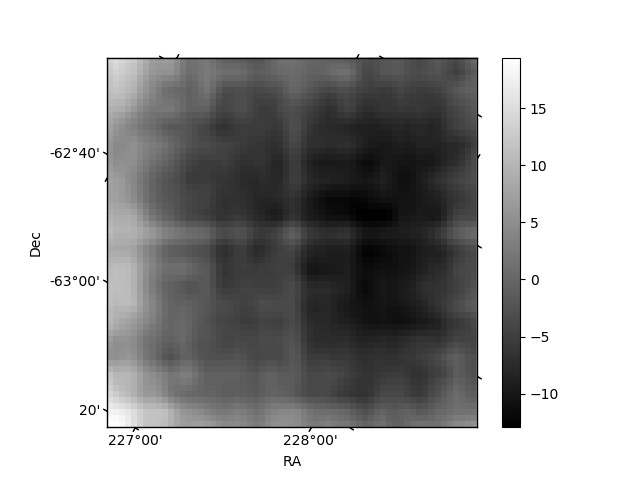
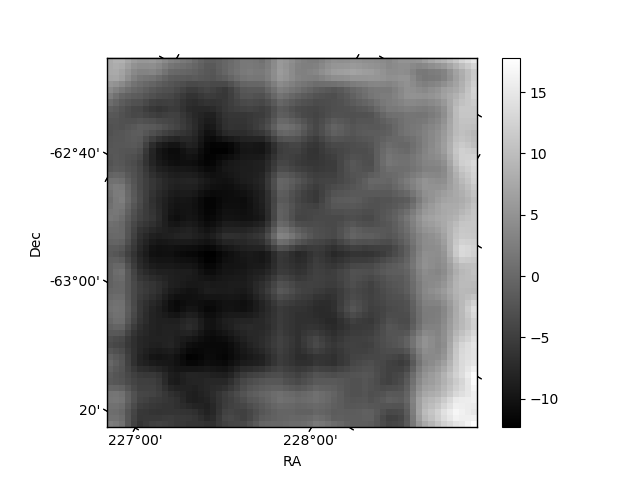
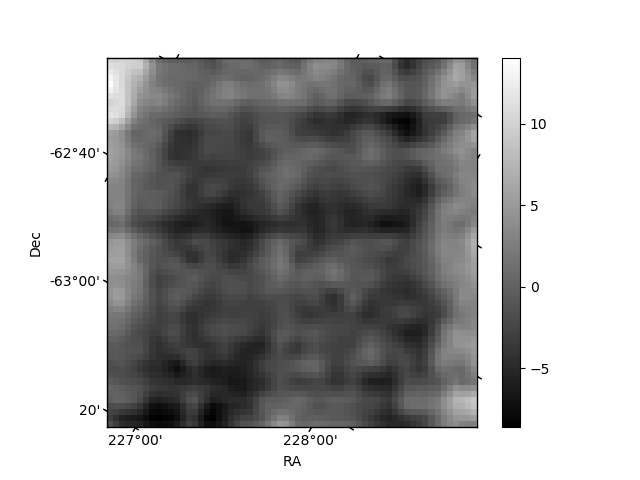
Histogram calculated using DETX and DETY for each event in the final _common_clean file
| Quadrant A | 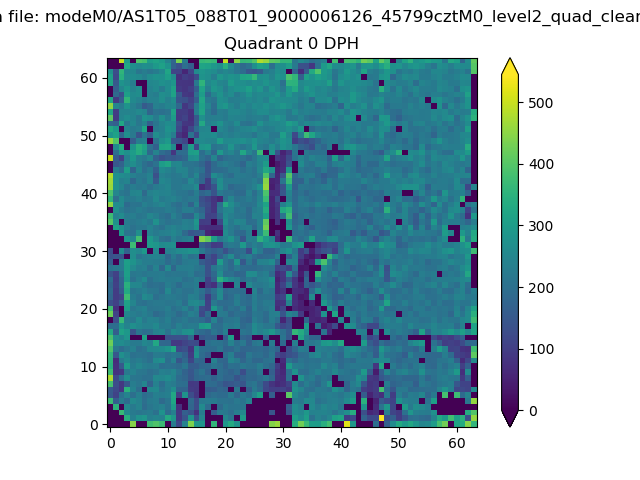 |
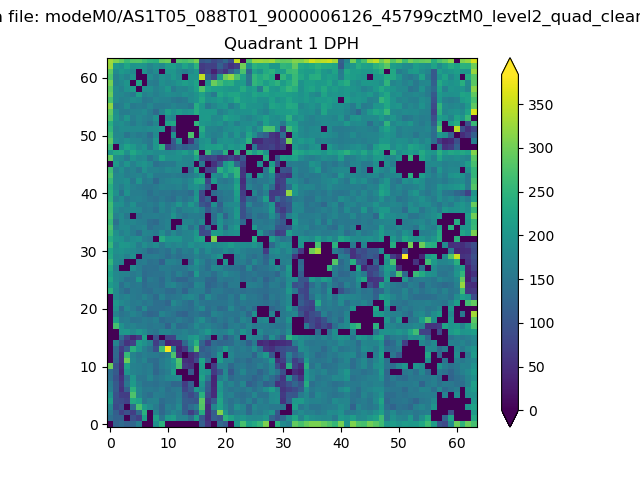 |
Quadrant B |
|---|---|---|---|
| Quadrant D | 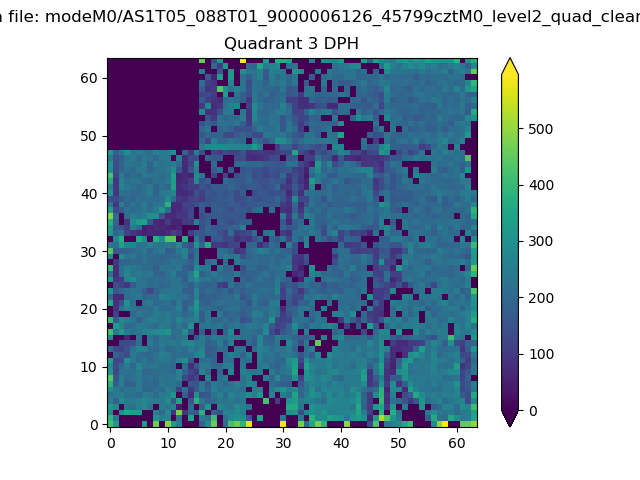 |
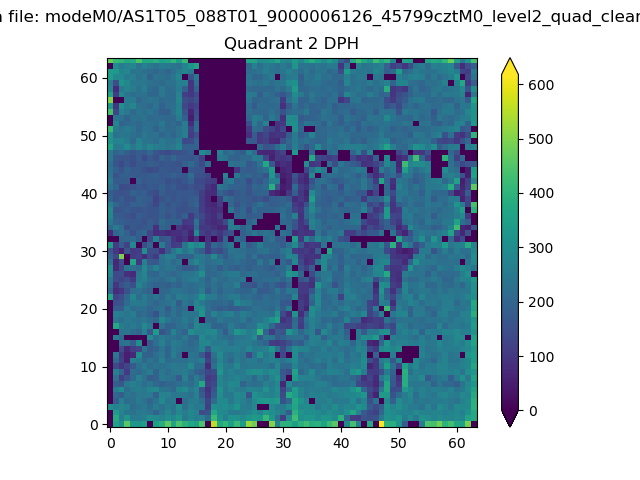 |
Quadrant C |
| Plot type | Count rate plots | Images |
|---|---|---|
| Comparison with Poisson distribution Blue bars denote a histogram of data divided into 1 sec bins. Red curve is a Poisson curve with rate = median count rate of data. |
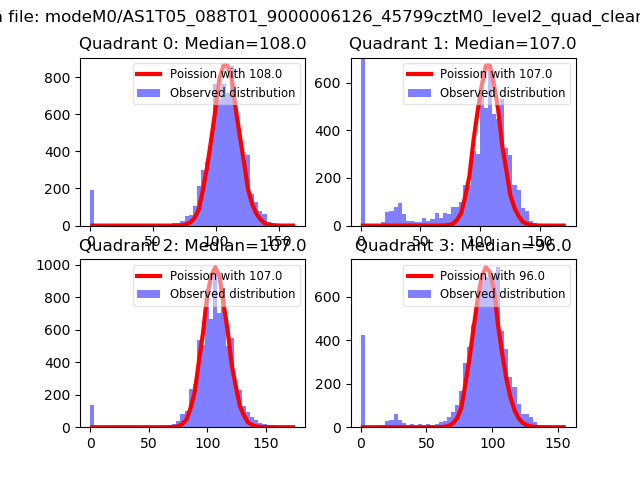 |
 |
| Quadrant-wise count rates Data is divided into 100 sec bins |
 |
|
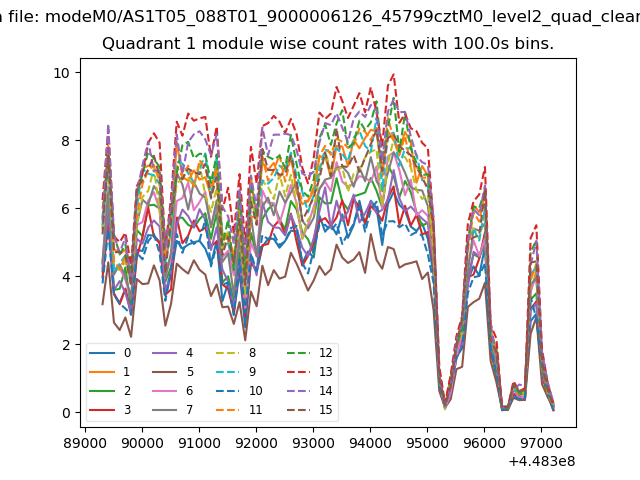
| Module-wise count rates for Quadrant A Data is divided into 100 sec bins |
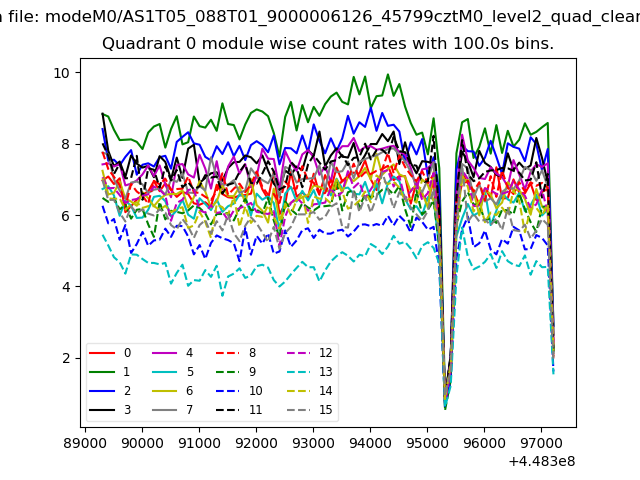 |
 |
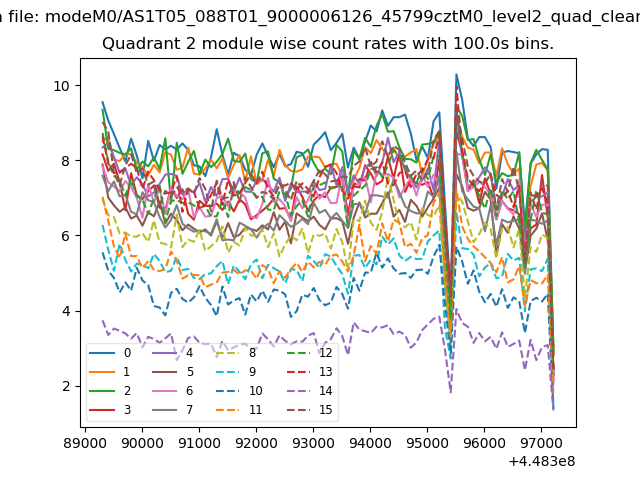
| Module-wise count rates for Quadrant B Data is divided into 100 sec bins |
 |
 |
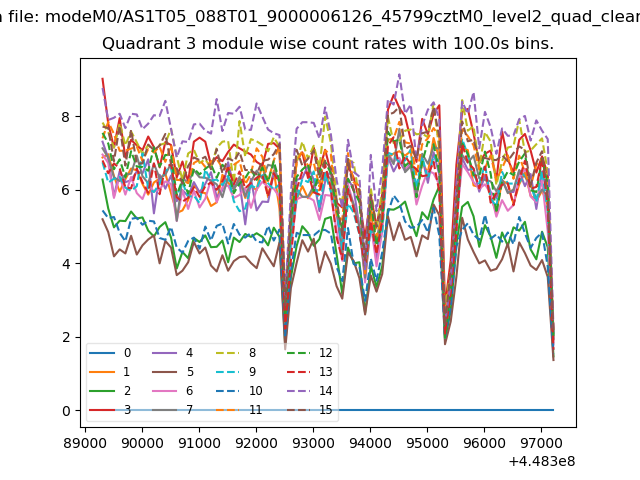
| Module-wise count rates for Quadrant C Data is divided into 100 sec bins |
 |
 |
| Module-wise count rates for Quadrant D Data is divided into 100 sec bins |
 |
 |
| Parameter | Plot |
|---|---|
| CZT HV Monitor | 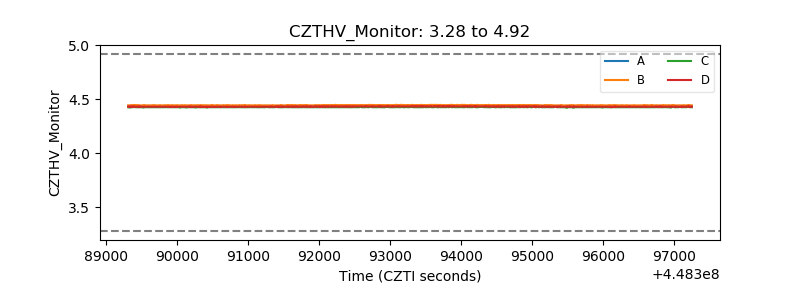 |
| D_VDD | 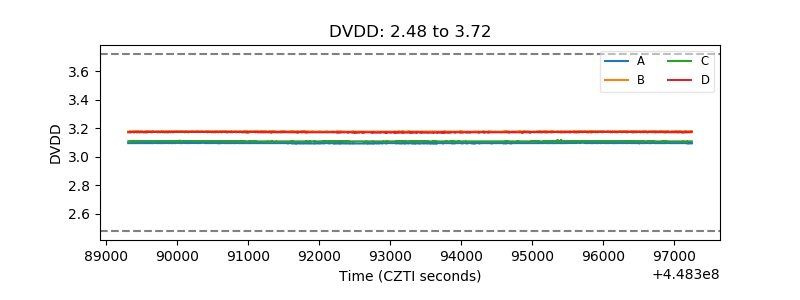 |
| Temperature 1 | 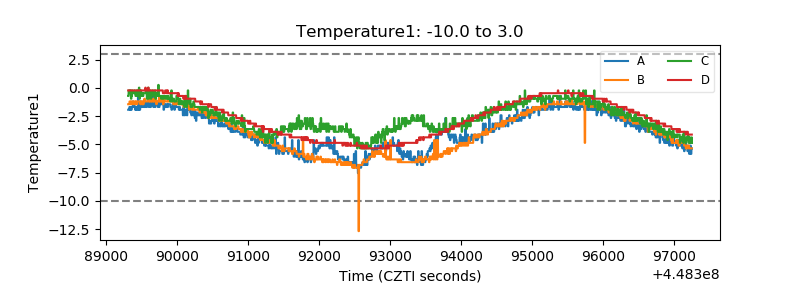 |
| Veto HV Monitor | 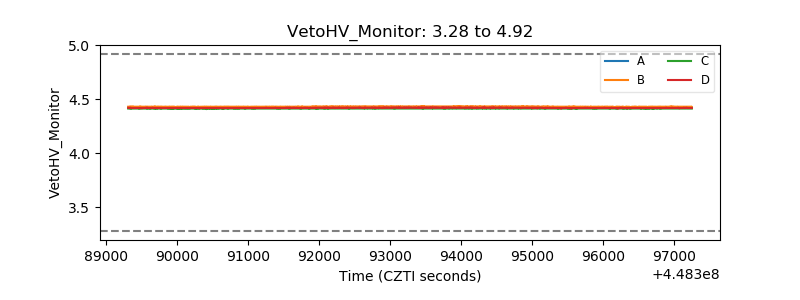 |
| Veto LLD | 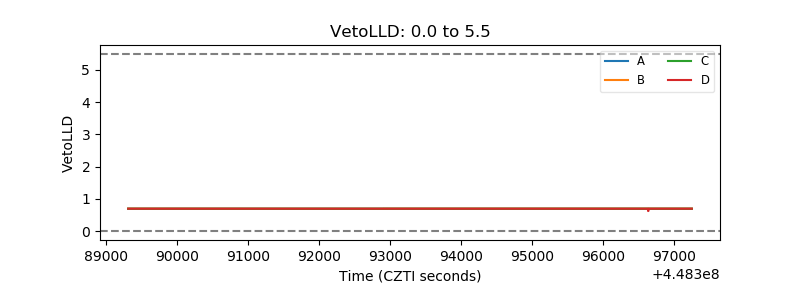 |
| Alpha Counter | 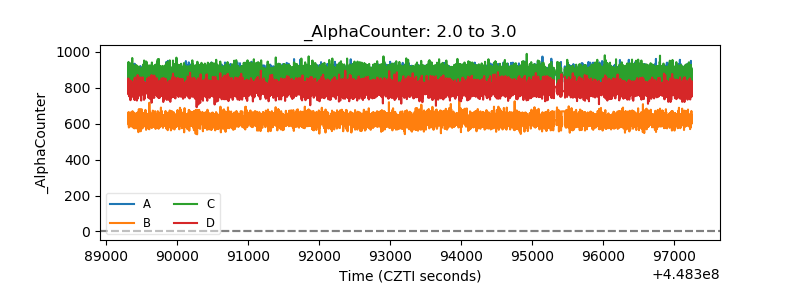 |
| _CPM_Rate |  |
| CZT Counter | 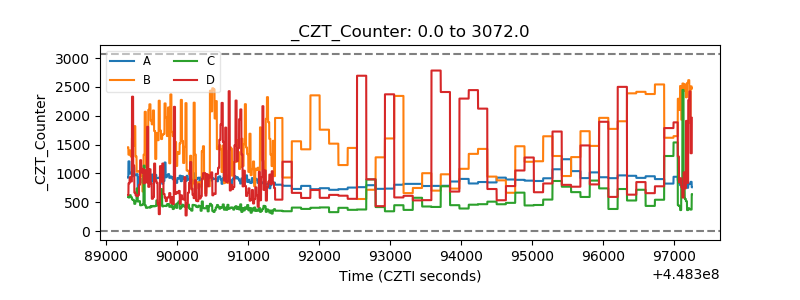 |
| +2.5 Volts monitor | 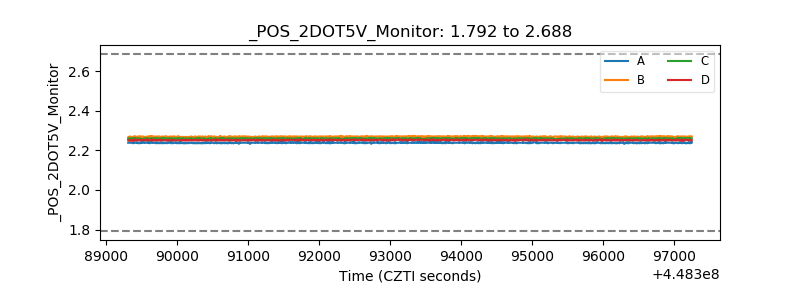 |
| +5 Volts monitor | 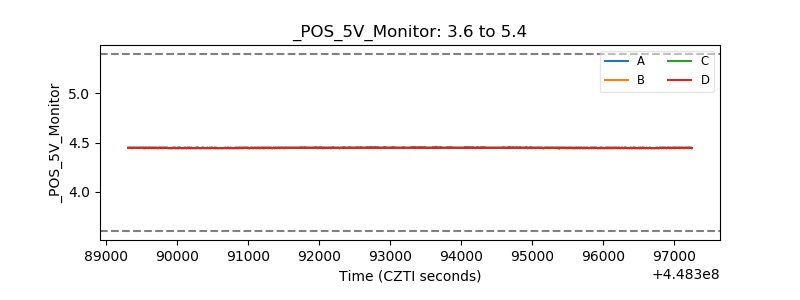 |
| _ROLL_ROT | 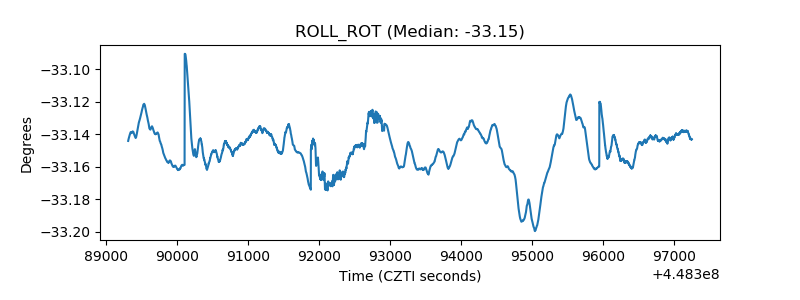 |
| _Roll_DEC | 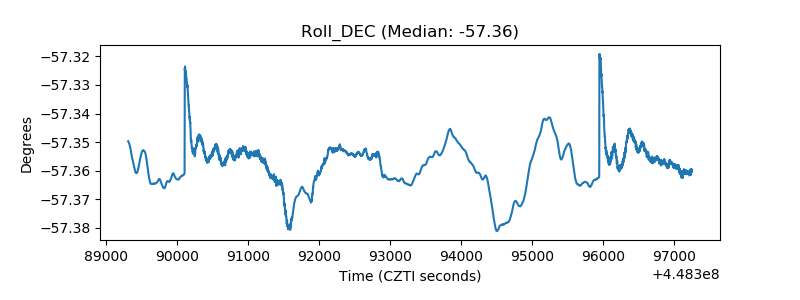 |
| _Roll_RA | 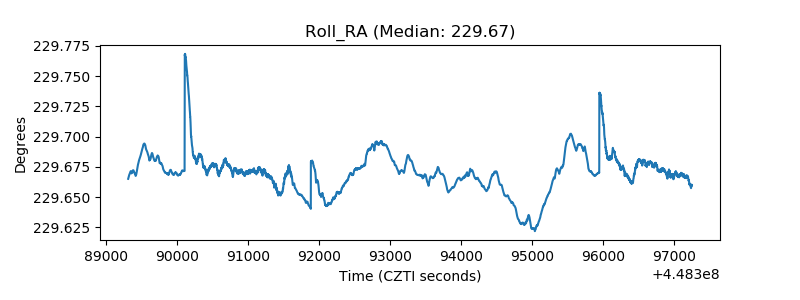 |
| Veto Counter | 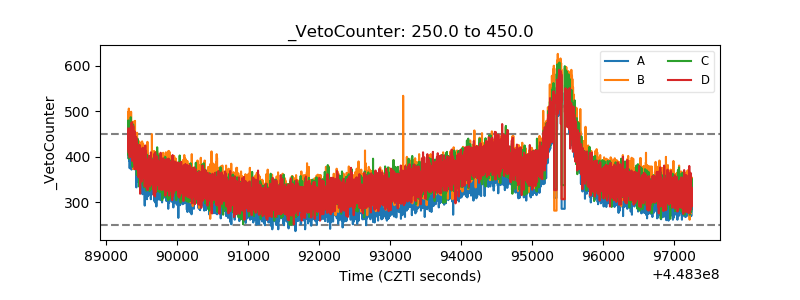 |