| Param | Original file | Final file |
|---|---|---|
| Filename | modeM0/AS1T05_088T01_9000006126_45803cztM0_level2.fits | modeM0/AS1T05_088T01_9000006126_45803cztM0_level2_quad_clean.evt |
| Size (bytes) | 2,787,580,800 | 335,759,040 |
| Size | 2.6 GB | 320.2 MB |
| Events in quadrant A | 20,807,159 | 2,522,130 |
| Events in quadrant B | 29,939,738 | 1,919,952 |
| Events in quadrant C | 12,248,549 | 2,475,464 |
| Events in quadrant D | 38,373,328 | 1,616,958 |
| Mode M9 | |||
|---|---|---|---|
| Quadrant | BADHDUFLAG | Total packets | Discarded packets |
| A | 0 | 25 | 0 |
| B | 0 | 25 | 0 |
| C | 0 | 25 | 0 |
| D | 0 | 25 | 0 |
| Mode M0 | |||
|---|---|---|---|
| Quadrant | BADHDUFLAG | Total packets | Discarded packets |
| A | 0 | 78098 | 6 |
| B | 0 | 105366 | 4 |
| C | 0 | 53589 | 4 |
| D | 0 | 130502 | 4 |
| Mode SS | |||
|---|---|---|---|
| Quadrant | BADHDUFLAG | Total packets | Discarded packets |
| A | 0 | 484 | 0 |
| B | 0 | 484 | 0 |
| C | 0 | 484 | 0 |
| D | 0 | 484 | 0 |
| Quadrant | Total seconds | Saturated seconds | Saturation percentage |
|---|---|---|---|
| A | 23669 | 673 | 2.843382% |
| B | 23670 | 6150 | 25.982256% |
| C | 23670 | 596 | 2.517955% |
| D | 23670 | 7187 | 30.363329% |
Noise dominated data is calculated using 1-second bins in cleaned event files. If a bin has >2000 counts, and if more than 50% of those come from <1% of pixels, then it is considered to be noise-dominated and hence unusable.
| Quadrant | # 1 sec bins | Bins with >0 counts | Bins with >2000 counts | High rate bins dominated by noise | Noise dominated (total time) | Noise dominated (detector-on time) | Marked lightcurve |
|---|---|---|---|---|---|---|---|
| A | 26324 | 23673 | 231 | 231 | 0.88% | 0.98% | 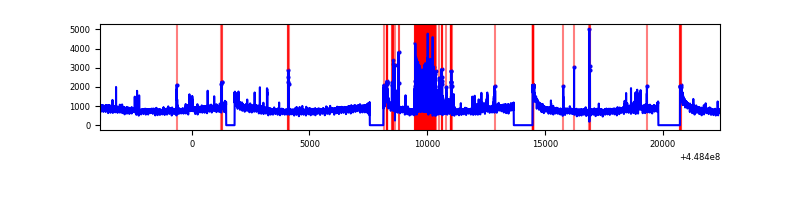 |
| B | 26325 | 23673 | 4157 | 4157 | 15.79% | 17.56% | 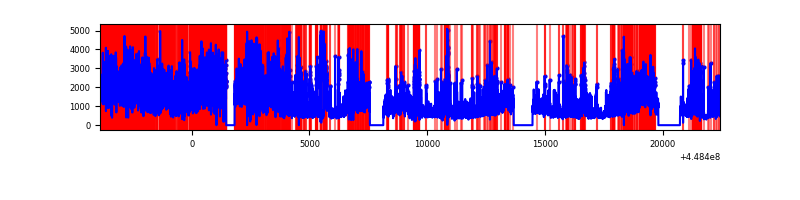 |
| C | 26325 | 23674 | 442 | 442 | 1.68% | 1.87% | 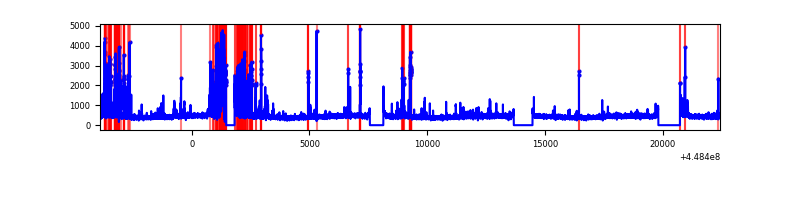 |
| D | 26325 | 23673 | 7002 | 7002 | 26.60% | 29.58% | 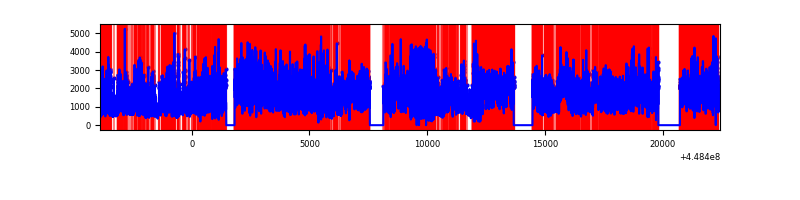 |
Top three noisy pixels from each quadrant. If the there are fewer than three noisy pixels in the level2.evt file, extra rows are filled as -1
| Pixel properties | Quadrant properties | ||||||
|---|---|---|---|---|---|---|---|
| Quadrant | DetID | PixID | Counts | Sigma | Mean | Median | Sigma |
| A | 10 | 83 | 9651520 | 18017.05 | 2600 | 2544 | 535.5 |
| A | 13 | 248 | 890152 | 1657.39 | 2600 | 2544 | 535.5 |
| A | 2 | 79 | 80607 | 145.76 | 2600 | 2544 | 535.5 |
| B | 3 | 112 | 18826873 | 40765.79 | 2377 | 2300 | 461.8 |
| B | 5 | 172 | 621084 | 1340.01 | 2377 | 2300 | 461.8 |
| B | 4 | 171 | 279082 | 599.39 | 2377 | 2300 | 461.8 |
| C | 12 | 2 | 2061329 | 3446.1 | 2554 | 2569 | 597.4 |
| C | 12 | 249 | 72759 | 117.49 | 2554 | 2569 | 597.4 |
| C | 12 | 250 | 68671 | 110.65 | 2554 | 2569 | 597.4 |
| D | 11 | 241 | 18038152 | 30906.94 | 2314 | 2244 | 583.6 |
| D | 1 | 52 | 5890131 | 10089.68 | 2314 | 2244 | 583.6 |
| D | 8 | 48 | 2358731 | 4038.16 | 2314 | 2244 | 583.6 |
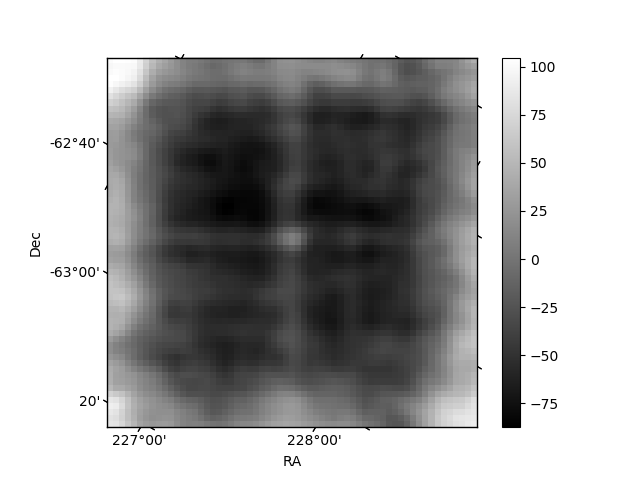
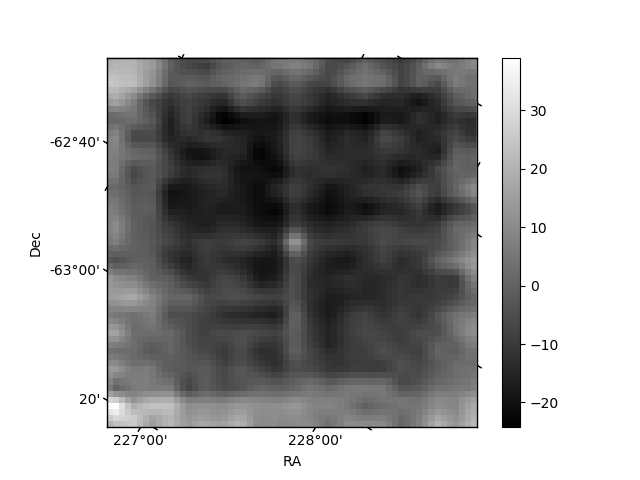
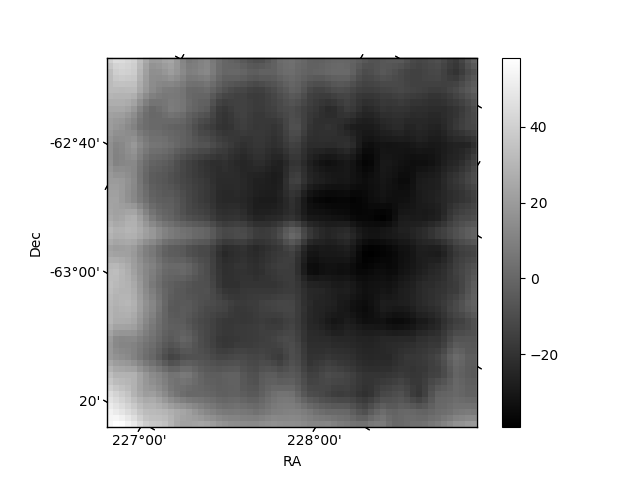
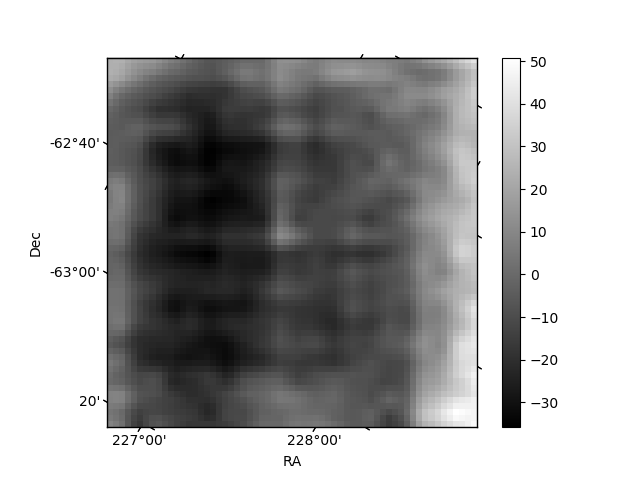
Histogram calculated using DETX and DETY for each event in the final _common_clean file
| Quadrant A | 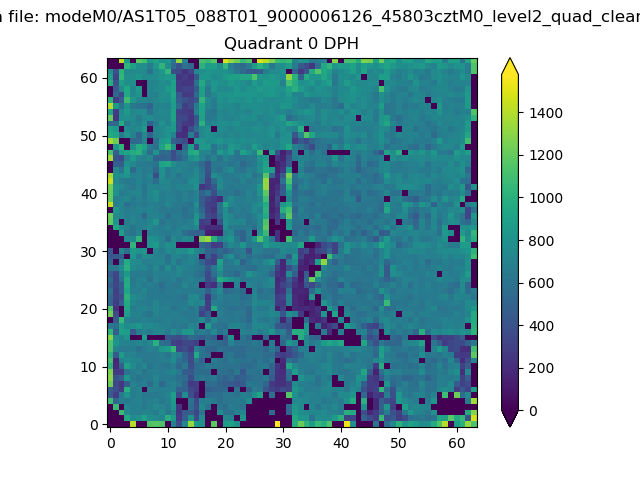 |
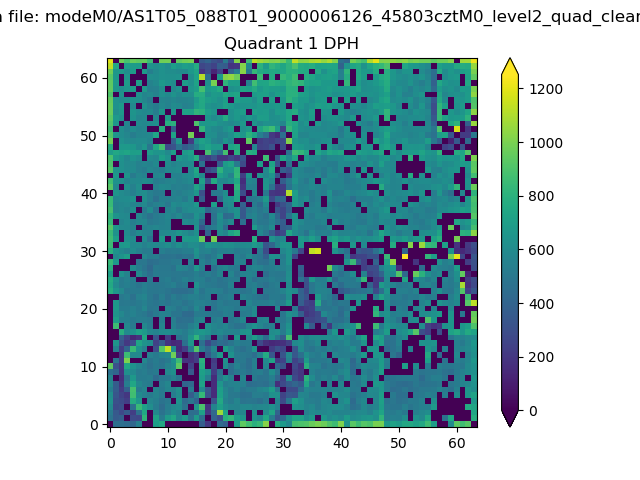 |
Quadrant B |
|---|---|---|---|
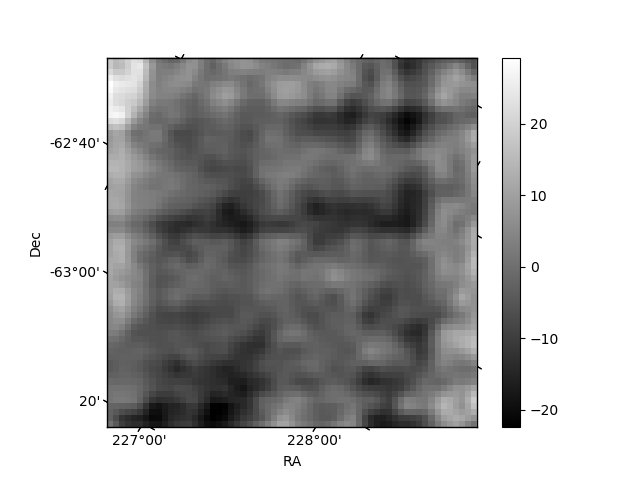
| Quadrant D | 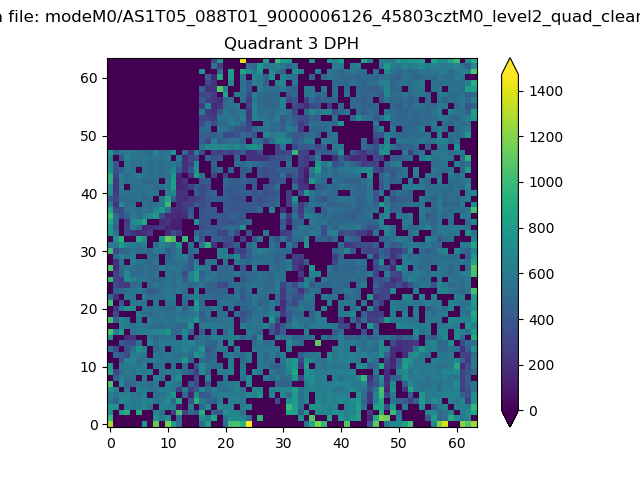 |
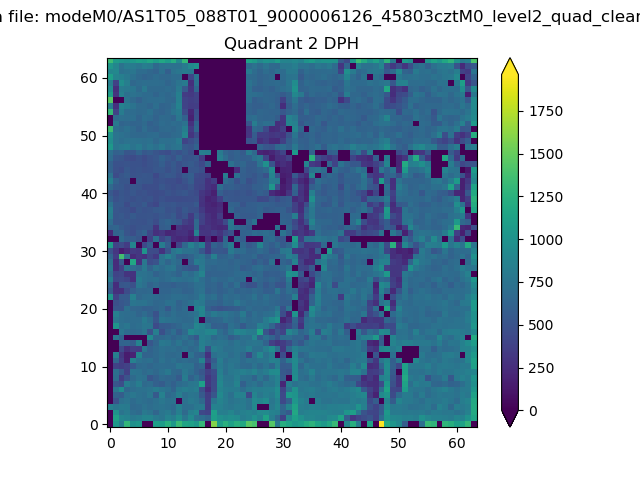 |
Quadrant C |
| Plot type | Count rate plots | Images |
|---|---|---|
| Comparison with Poisson distribution Blue bars denote a histogram of data divided into 1 sec bins. Red curve is a Poisson curve with rate = median count rate of data. |
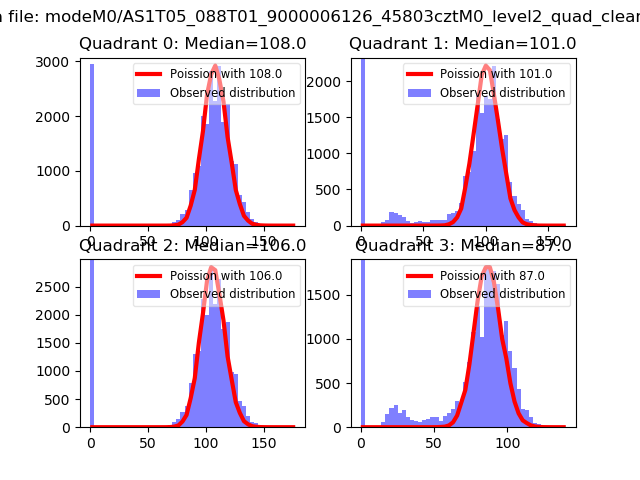 |
 |
| Quadrant-wise count rates Data is divided into 100 sec bins |
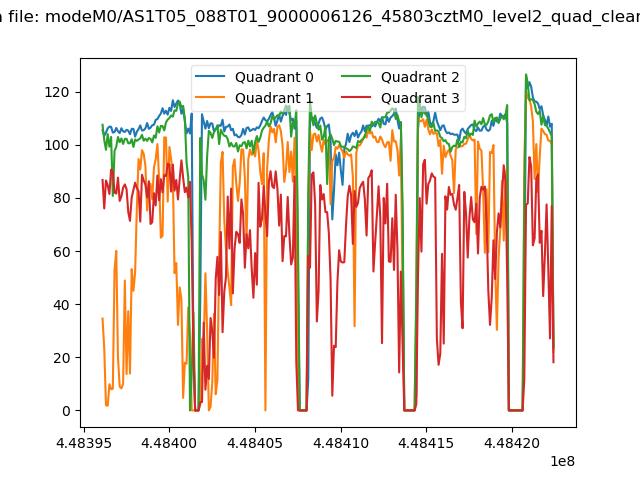 |
|
| Module-wise count rates for Quadrant A Data is divided into 100 sec bins |
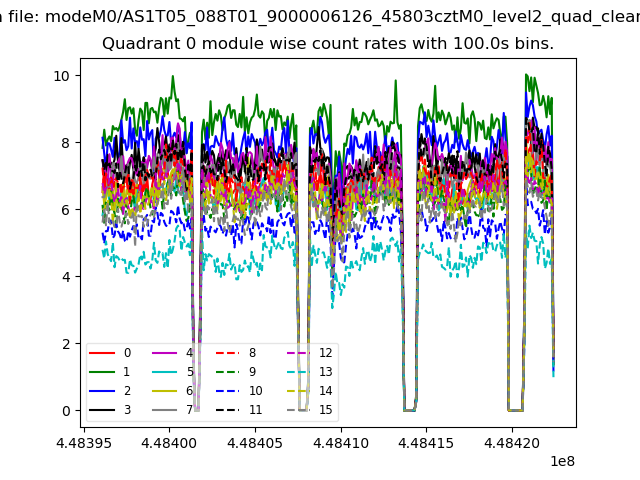 |
 |
| Module-wise count rates for Quadrant B Data is divided into 100 sec bins |
 |
 |
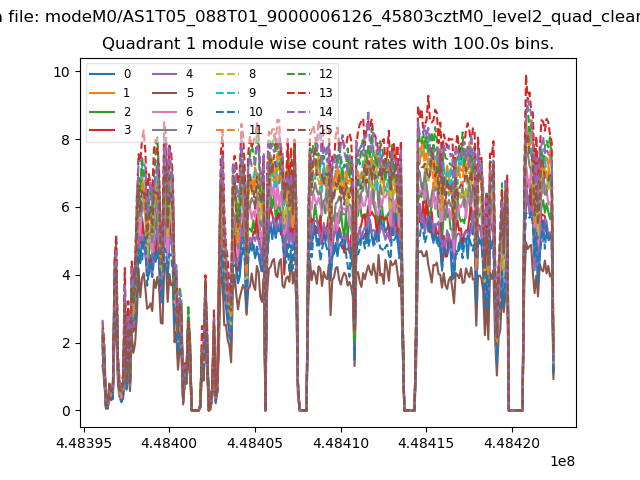
| Module-wise count rates for Quadrant C Data is divided into 100 sec bins |
 |
 |
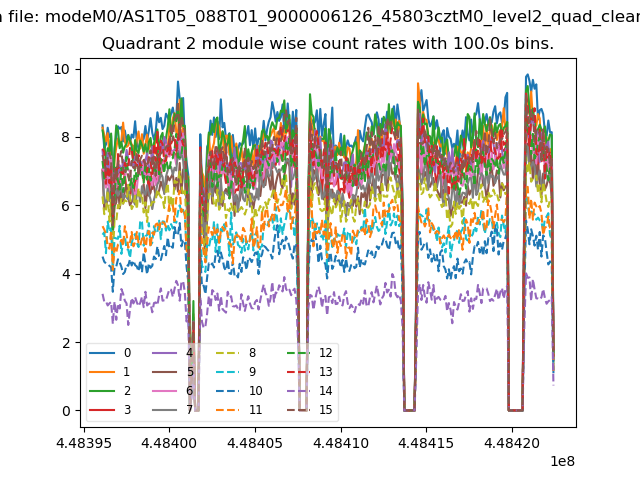
| Module-wise count rates for Quadrant D Data is divided into 100 sec bins |
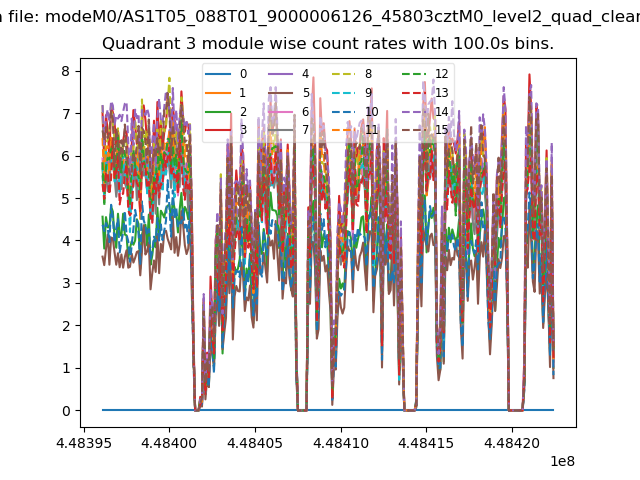 |
 |
| Parameter | Plot |
|---|---|
| CZT HV Monitor | 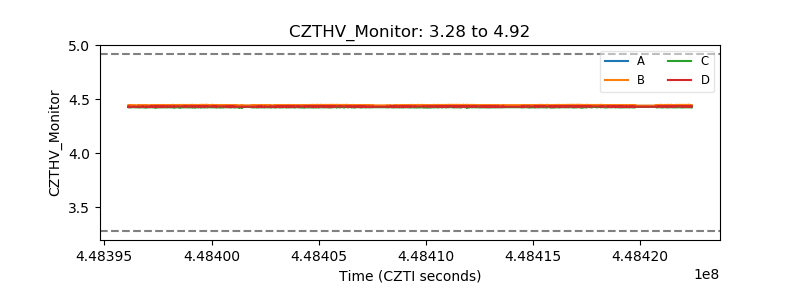 |
| D_VDD | 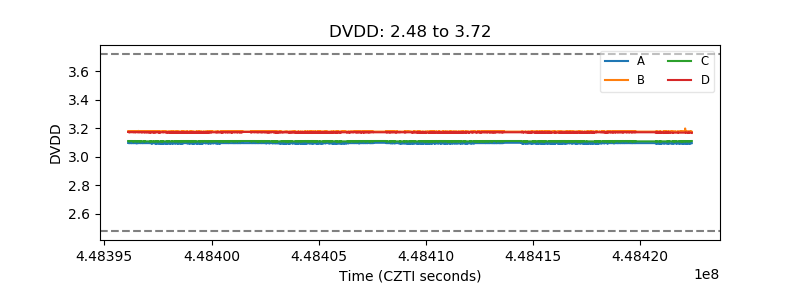 |
| Temperature 1 | 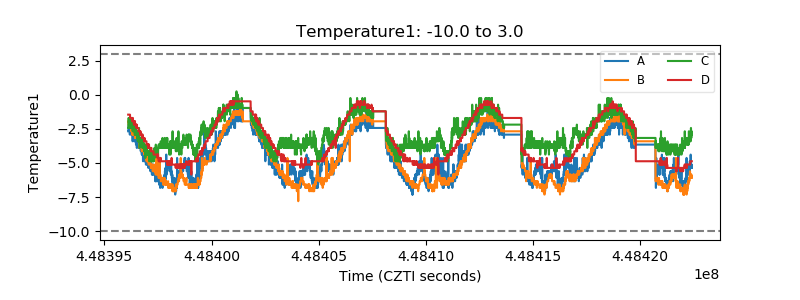 |
| Veto HV Monitor | 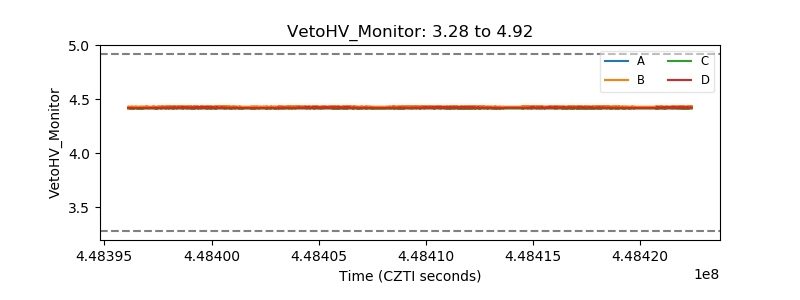 |
| Veto LLD | 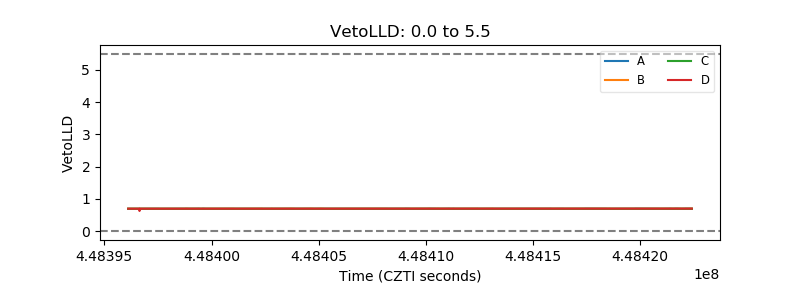 |
| Alpha Counter | 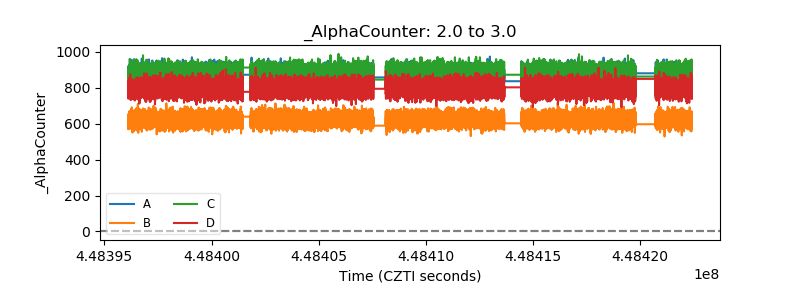 |
| _CPM_Rate | 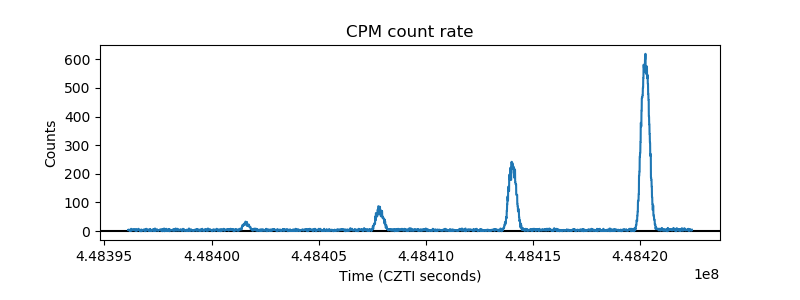 |
| CZT Counter | 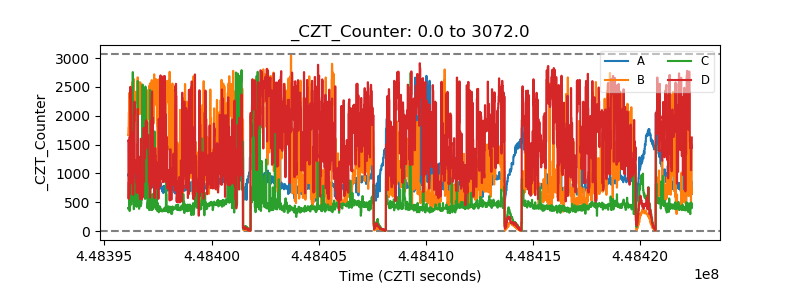 |
| +2.5 Volts monitor | 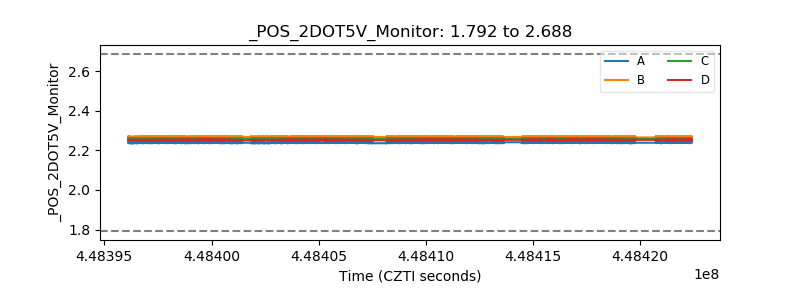 |
| +5 Volts monitor | 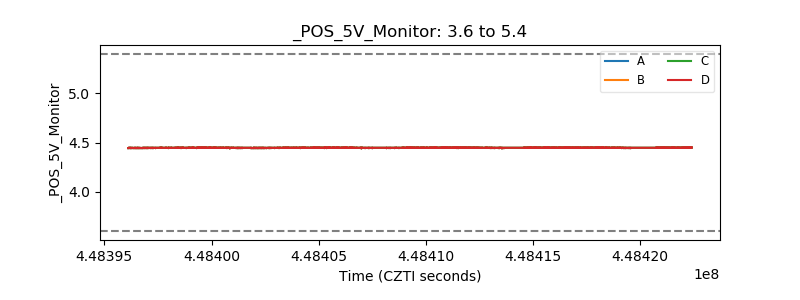 |
| _ROLL_ROT | 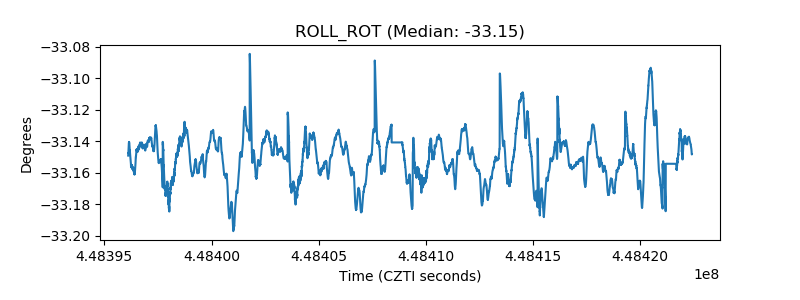 |
| _Roll_DEC | 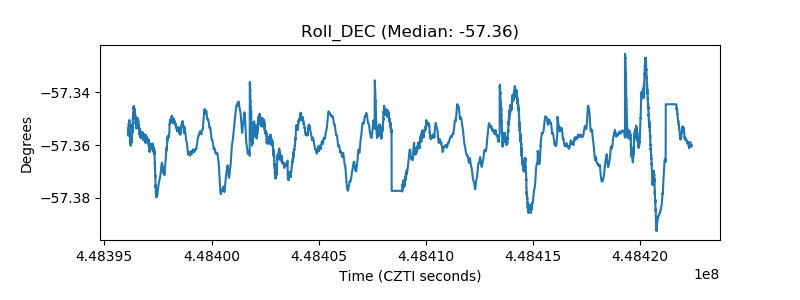 |
| _Roll_RA | 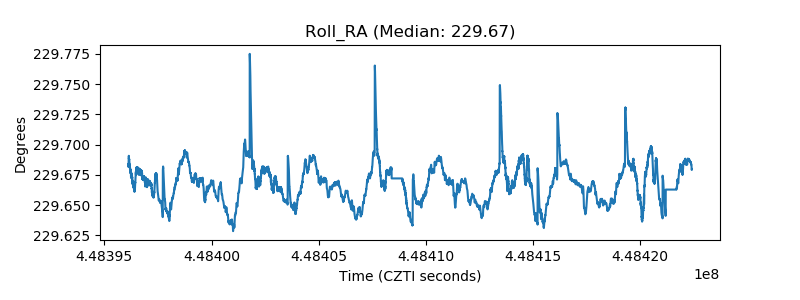 |
| Veto Counter | 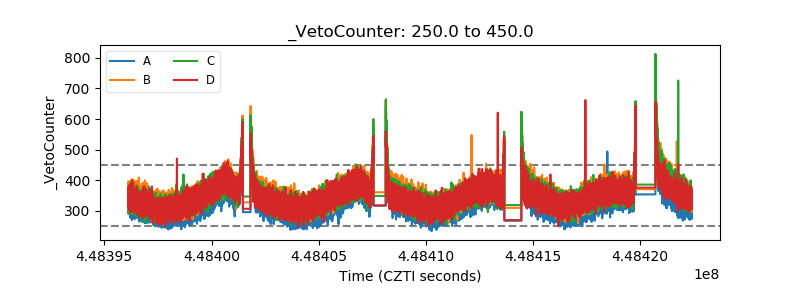 |