| Param | Original file | Final file |
|---|---|---|
| Filename | modeM0/AS1T05_088T01_9000006126_45805cztM0_level2.fits | modeM0/AS1T05_088T01_9000006126_45805cztM0_level2_quad_clean.evt |
| Size (bytes) | 758,856,960 | 93,755,520 |
| Size | 723.7 MB | 89.4 MB |
| Events in quadrant A | 5,616,233 | 685,122 |
| Events in quadrant B | 6,894,062 | 644,661 |
| Events in quadrant C | 3,001,108 | 694,026 |
| Events in quadrant D | 12,096,360 | 378,598 |
| Mode M9 | |||
|---|---|---|---|
| Quadrant | BADHDUFLAG | Total packets | Discarded packets |
| A | 0 | 11 | 0 |
| B | 0 | 11 | 0 |
| C | 0 | 11 | 0 |
| D | 0 | 11 | 0 |
| Mode M0 | |||
|---|---|---|---|
| Quadrant | BADHDUFLAG | Total packets | Discarded packets |
| A | 0 | 20984 | 1 |
| B | 0 | 24947 | 1 |
| C | 0 | 13352 | 1 |
| D | 0 | 40277 | 2 |
| Mode SS | |||
|---|---|---|---|
| Quadrant | BADHDUFLAG | Total packets | Discarded packets |
| A | 0 | 126 | 0 |
| B | 0 | 126 | 0 |
| C | 0 | 126 | 0 |
| D | 0 | 126 | 0 |
| Quadrant | Total seconds | Saturated seconds | Saturation percentage |
|---|---|---|---|
| A | 6249 | 177 | 2.832453% |
| B | 6250 | 965 | 15.440000% |
| C | 6250 | 65 | 1.040000% |
| D | 6249 | 2978 | 47.655625% |
Noise dominated data is calculated using 1-second bins in cleaned event files. If a bin has >2000 counts, and if more than 50% of those come from <1% of pixels, then it is considered to be noise-dominated and hence unusable.
| Quadrant | # 1 sec bins | Bins with >0 counts | Bins with >2000 counts | High rate bins dominated by noise | Noise dominated (total time) | Noise dominated (detector-on time) | Marked lightcurve |
|---|---|---|---|---|---|---|---|
| A | 7334 | 6250 | 117 | 117 | 1.60% | 1.87% | 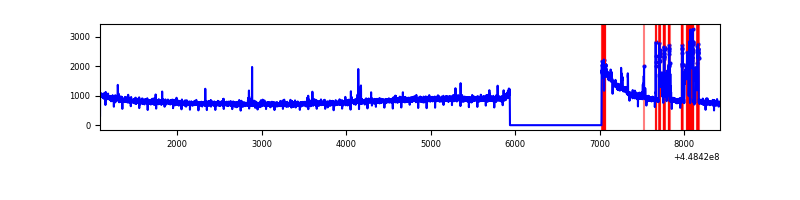 |
| B | 7335 | 6251 | 576 | 576 | 7.85% | 9.21% | 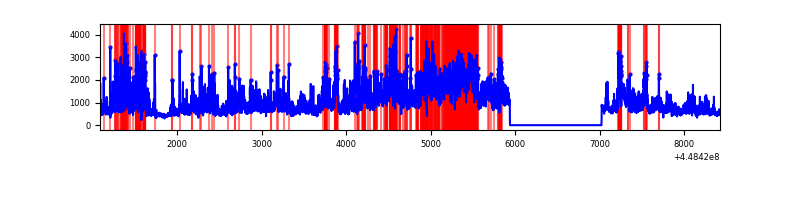 |
| C | 7335 | 6251 | 48 | 48 | 0.65% | 0.77% | 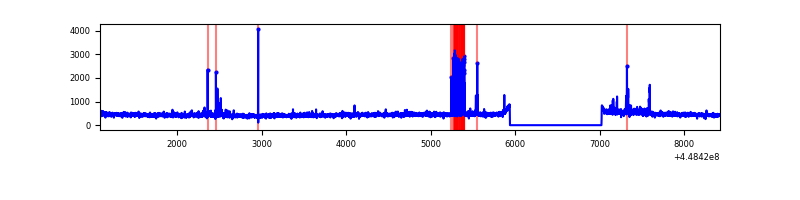 |
| D | 7334 | 6250 | 2987 | 2987 | 40.73% | 47.79% | 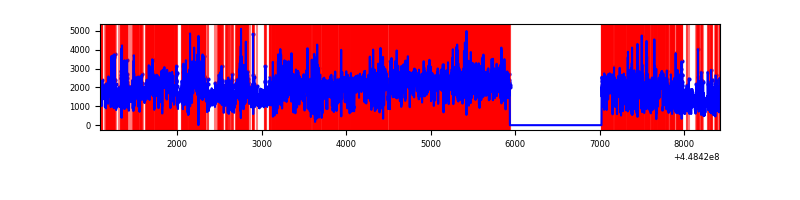 |
Top three noisy pixels from each quadrant. If the there are fewer than three noisy pixels in the level2.evt file, extra rows are filled as -1
| Pixel properties | Quadrant properties | ||||||
|---|---|---|---|---|---|---|---|
| Quadrant | DetID | PixID | Counts | Sigma | Mean | Median | Sigma |
| A | 10 | 83 | 2548240 | 17806.62 | 691 | 677 | 143.1 |
| A | 15 | 14 | 333858 | 2328.82 | 691 | 677 | 143.1 |
| A | 13 | 248 | 41013 | 281.94 | 691 | 677 | 143.1 |
| B | 3 | 112 | 3903429 | 30225.78 | 668 | 649 | 129.1 |
| B | 0 | 171 | 122909 | 946.86 | 668 | 649 | 129.1 |
| B | 4 | 158 | 55910 | 427.98 | 668 | 649 | 129.1 |
| C | 12 | 2 | 234315 | 1421.66 | 697 | 699 | 164.3 |
| C | 2 | 14 | 19152 | 112.29 | 697 | 699 | 164.3 |
| C | 12 | 250 | 16473 | 95.99 | 697 | 699 | 164.3 |
| D | 11 | 241 | 7044228 | 46946.65 | 585 | 566 | 150.0 |
| D | 1 | 52 | 1570865 | 10466.18 | 585 | 566 | 150.0 |
| D | 12 | 2 | 542735 | 3613.6 | 585 | 566 | 150.0 |
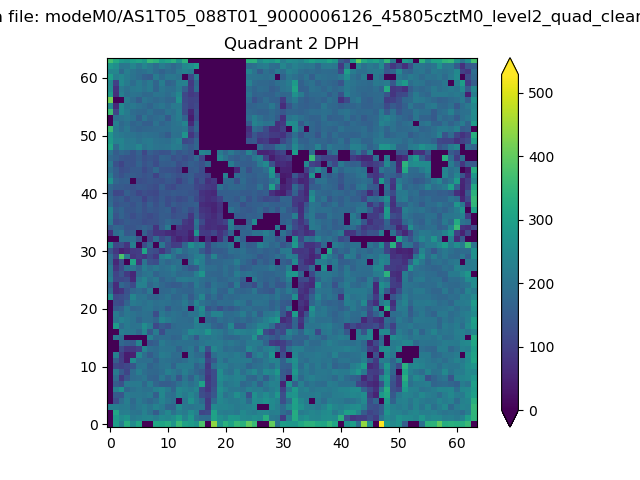
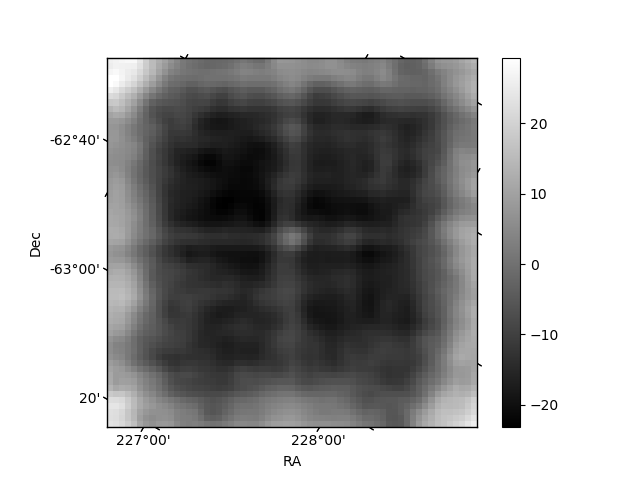
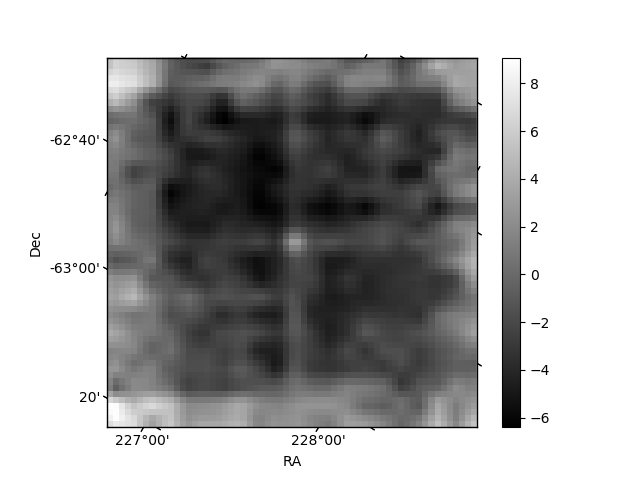
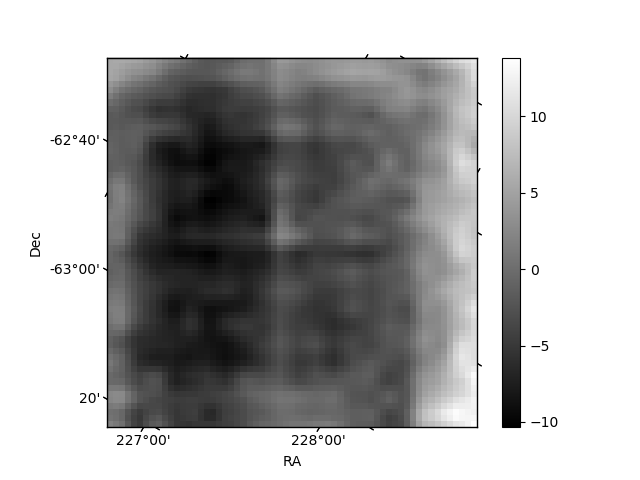
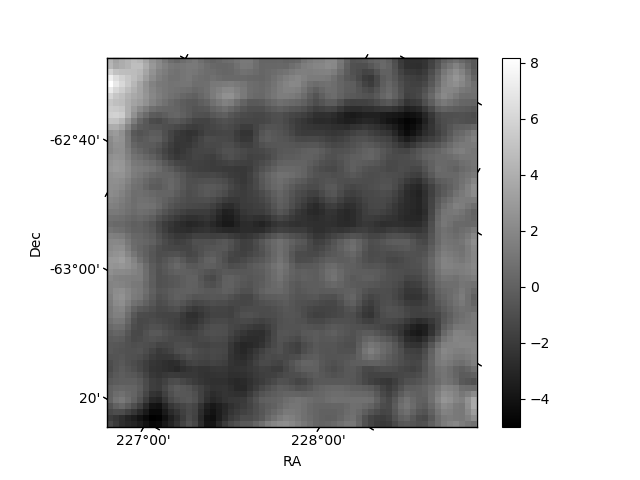
Histogram calculated using DETX and DETY for each event in the final _common_clean file
| Quadrant A | 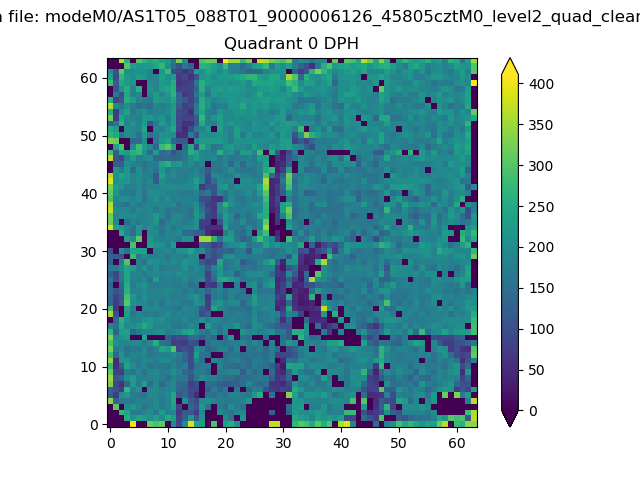 |
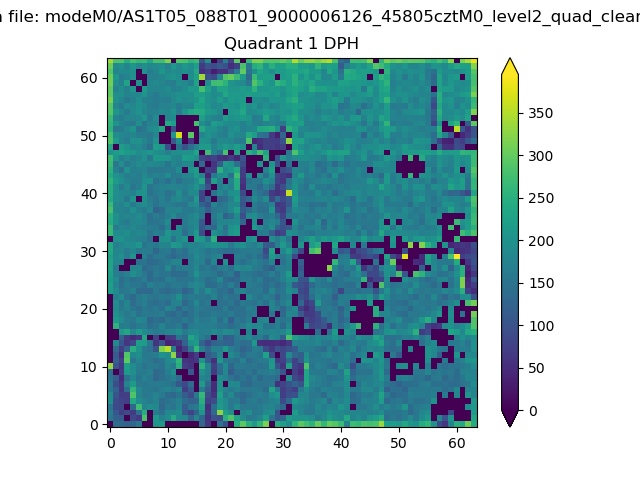 |
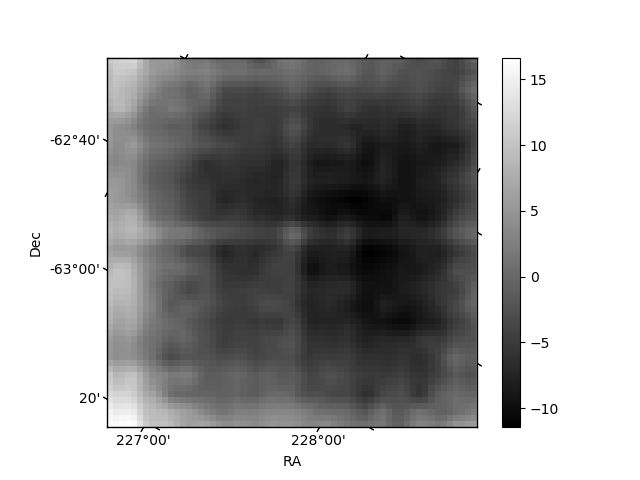
Quadrant B |
|---|---|---|---|
| Quadrant D | 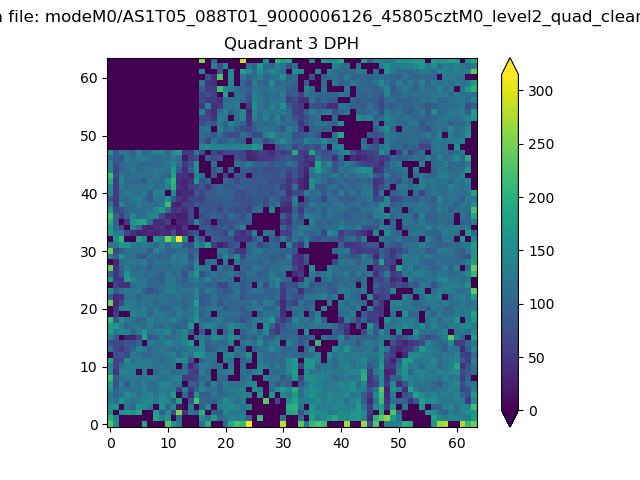 |
 |
Quadrant C |
| Plot type | Count rate plots | Images |
|---|---|---|
| Comparison with Poisson distribution Blue bars denote a histogram of data divided into 1 sec bins. Red curve is a Poisson curve with rate = median count rate of data. |
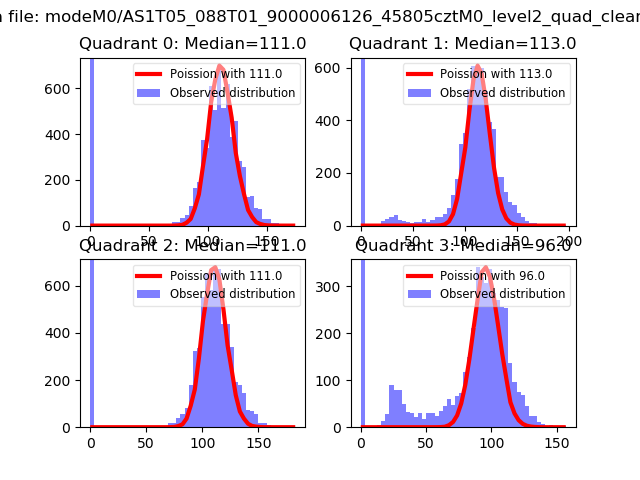 |
 |
| Quadrant-wise count rates Data is divided into 100 sec bins |
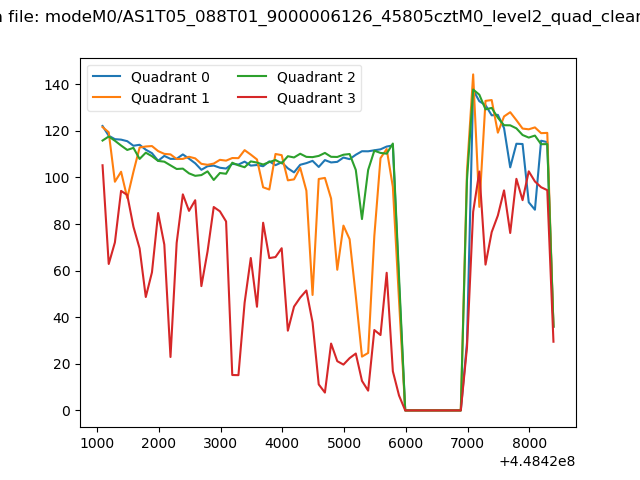 |
|
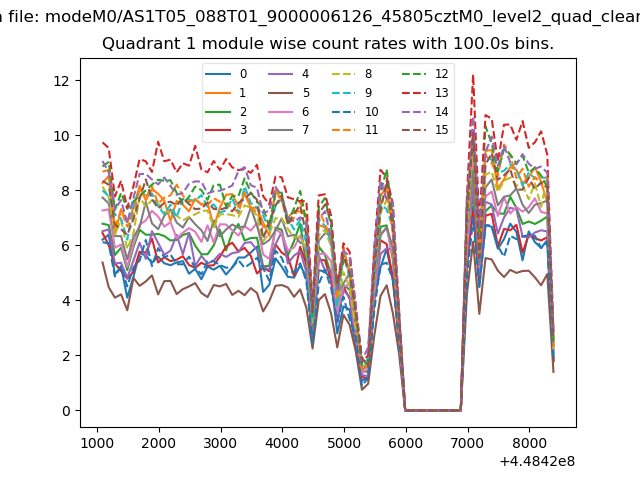
| Module-wise count rates for Quadrant A Data is divided into 100 sec bins |
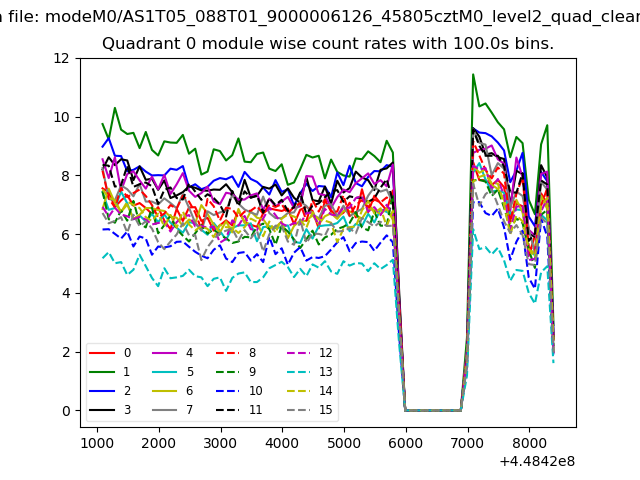 |
 |
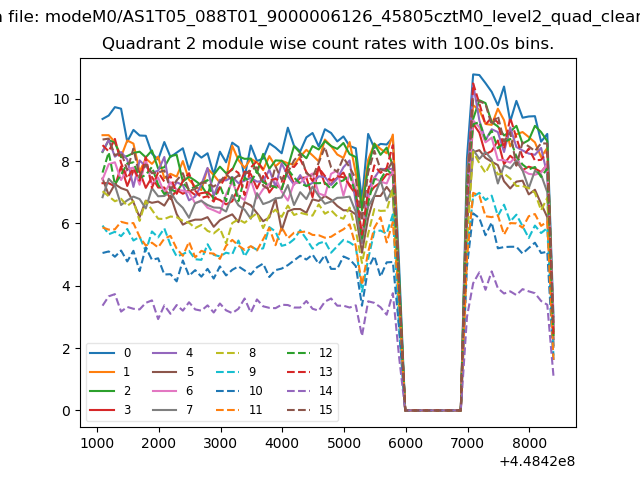
| Module-wise count rates for Quadrant B Data is divided into 100 sec bins |
 |
 |
| Module-wise count rates for Quadrant C Data is divided into 100 sec bins |
 |
 |
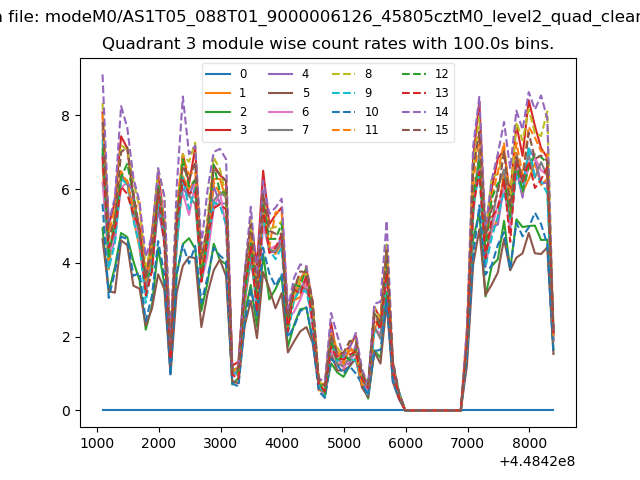
| Module-wise count rates for Quadrant D Data is divided into 100 sec bins |
 |
 |
| Parameter | Plot |
|---|---|
| CZT HV Monitor | 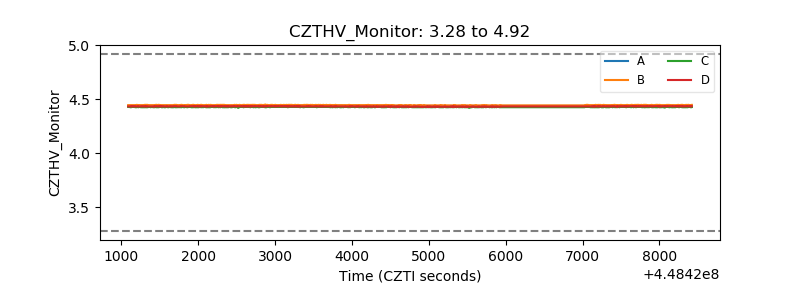 |
| D_VDD | 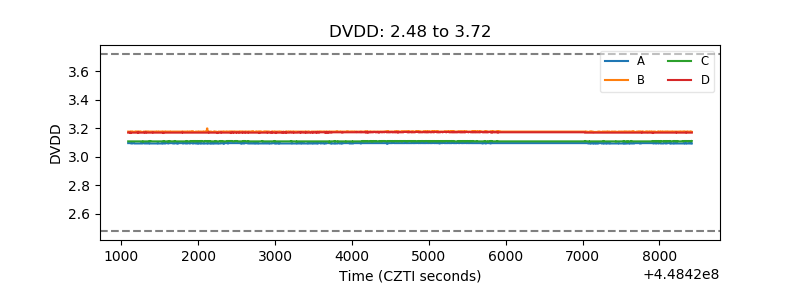 |
| Temperature 1 | 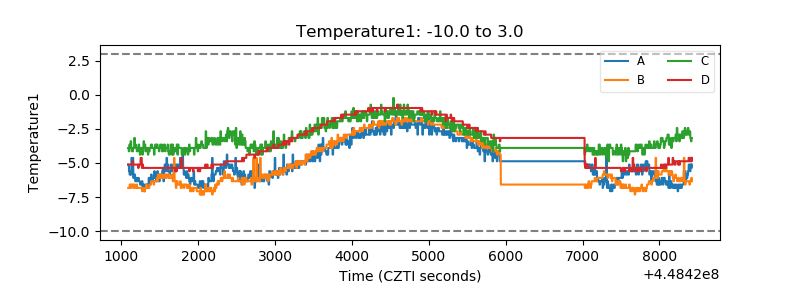 |
| Veto HV Monitor |  |
| Veto LLD | 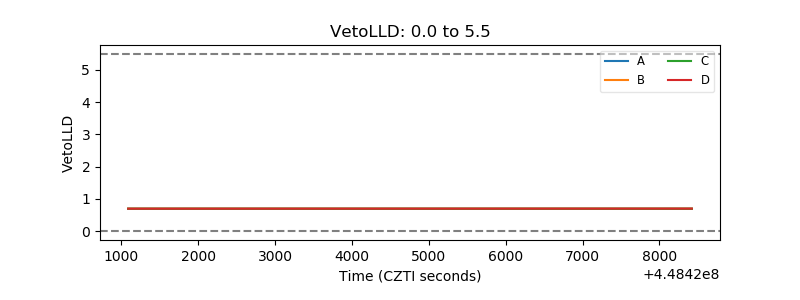 |
| Alpha Counter | 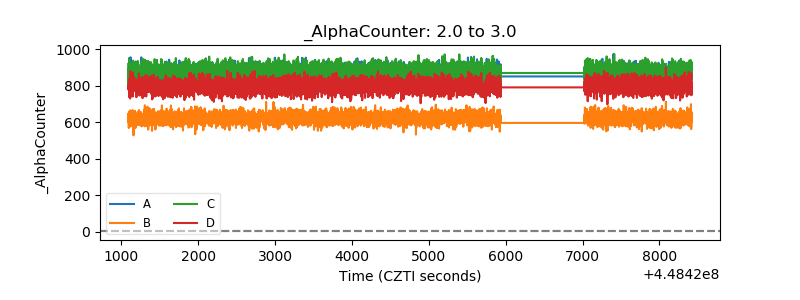 |
| _CPM_Rate | 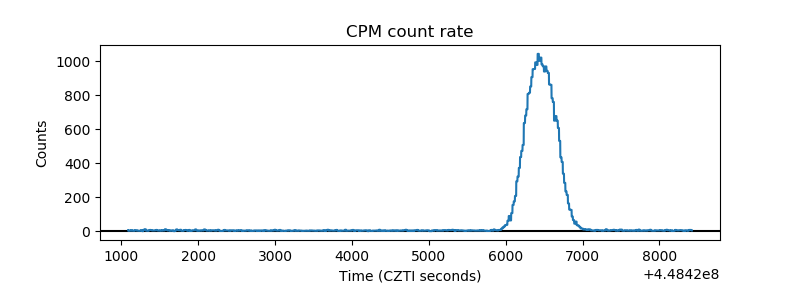 |
| CZT Counter | 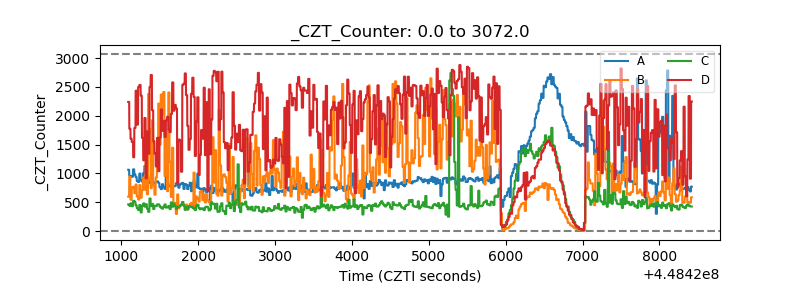 |
| +2.5 Volts monitor | 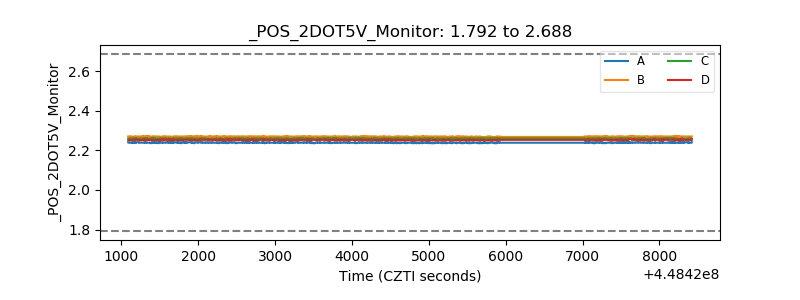 |
| +5 Volts monitor | 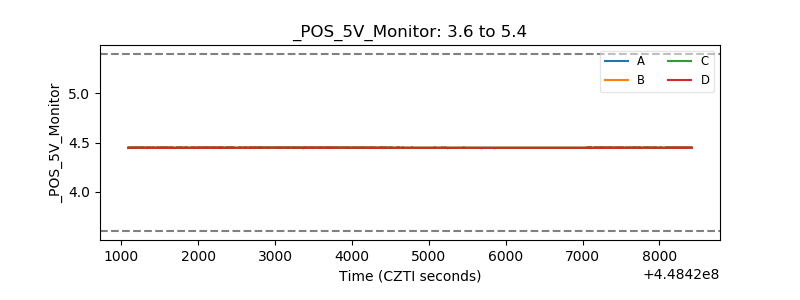 |
| _ROLL_ROT | 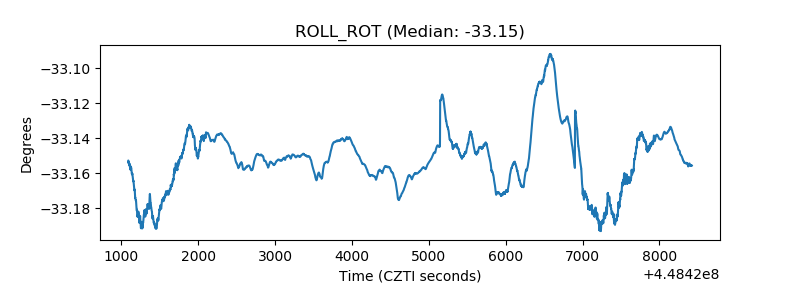 |
| _Roll_DEC | 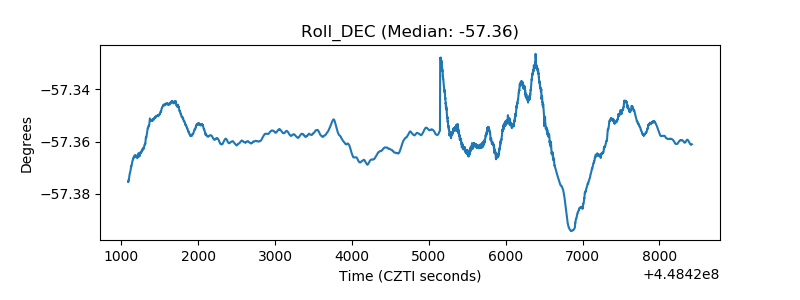 |
| _Roll_RA | 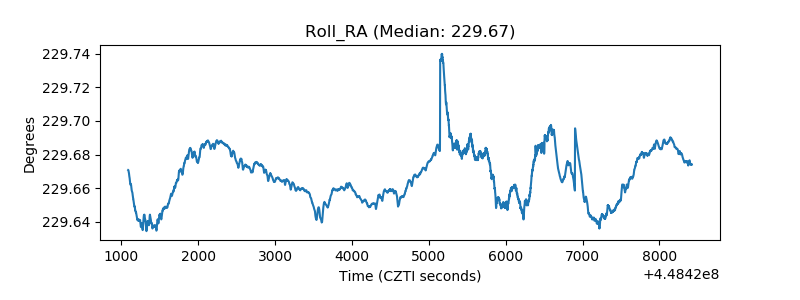 |
| Veto Counter | 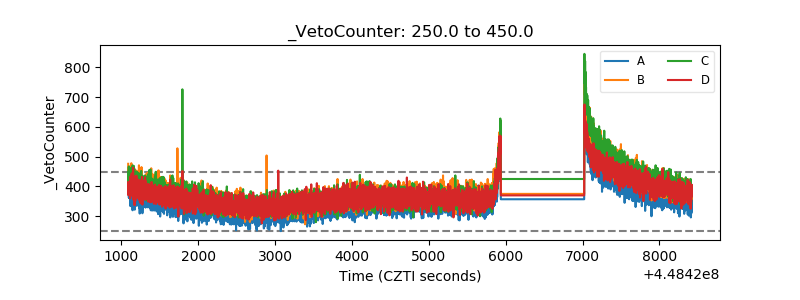 |