| Param | Original file | Final file |
|---|---|---|
| Filename | modeM0/AS1T05_088T01_9000006126_45806cztM0_level2.fits | modeM0/AS1T05_088T01_9000006126_45806cztM0_level2_quad_clean.evt |
| Size (bytes) | 766,609,920 | 103,608,000 |
| Size | 731.1 MB | 98.8 MB |
| Events in quadrant A | 6,347,760 | 729,634 |
| Events in quadrant B | 6,076,283 | 748,489 |
| Events in quadrant C | 3,656,602 | 759,198 |
| Events in quadrant D | 11,798,287 | 449,250 |
| Mode M9 | |||
|---|---|---|---|
| Quadrant | BADHDUFLAG | Total packets | Discarded packets |
| A | 0 | 15 | 0 |
| B | 0 | 16 | 0 |
| C | 0 | 16 | 0 |
| D | 0 | 16 | 0 |
| Mode M0 | |||
|---|---|---|---|
| Quadrant | BADHDUFLAG | Total packets | Discarded packets |
| A | 0 | 23080 | 2 |
| B | 0 | 22541 | 2 |
| C | 0 | 15225 | 2 |
| D | 0 | 39547 | 2 |
| Mode SS | |||
|---|---|---|---|
| Quadrant | BADHDUFLAG | Total packets | Discarded packets |
| A | 0 | 130 | 0 |
| B | 0 | 130 | 0 |
| C | 0 | 130 | 0 |
| D | 0 | 130 | 0 |
| Quadrant | Total seconds | Saturated seconds | Saturation percentage |
|---|---|---|---|
| A | 6458 | 338 | 5.233819% |
| B | 6458 | 537 | 8.315268% |
| C | 6458 | 95 | 1.471044% |
| D | 6458 | 2734 | 42.335088% |
Noise dominated data is calculated using 1-second bins in cleaned event files. If a bin has >2000 counts, and if more than 50% of those come from <1% of pixels, then it is considered to be noise-dominated and hence unusable.
| Quadrant | # 1 sec bins | Bins with >0 counts | Bins with >2000 counts | High rate bins dominated by noise | Noise dominated (total time) | Noise dominated (detector-on time) | Marked lightcurve |
|---|---|---|---|---|---|---|---|
| A | 7608 | 6459 | 193 | 193 | 2.54% | 2.99% | 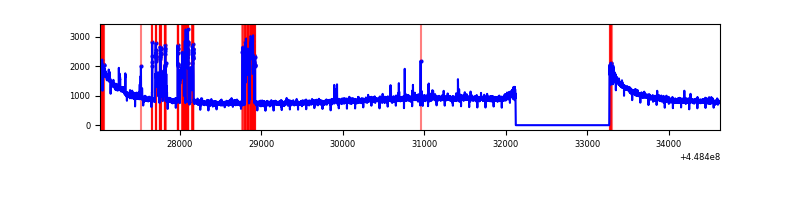 |
| B | 7608 | 6459 | 272 | 272 | 3.58% | 4.21% | 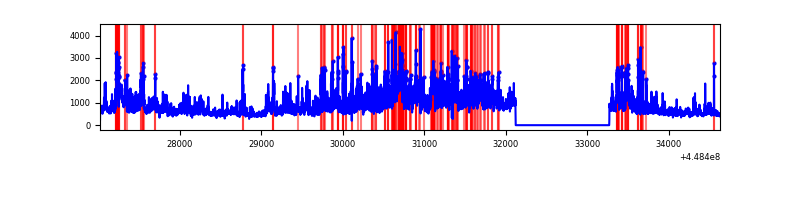 |
| C | 7608 | 6459 | 48 | 48 | 0.63% | 0.74% | 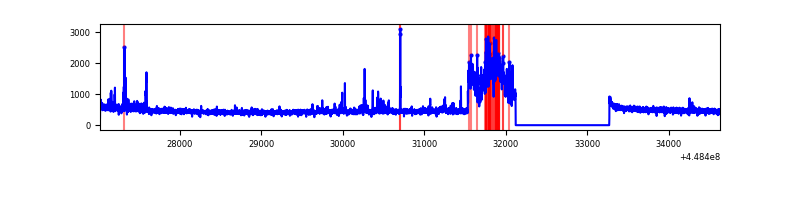 |
| D | 7608 | 6459 | 2678 | 2678 | 35.20% | 41.46% | 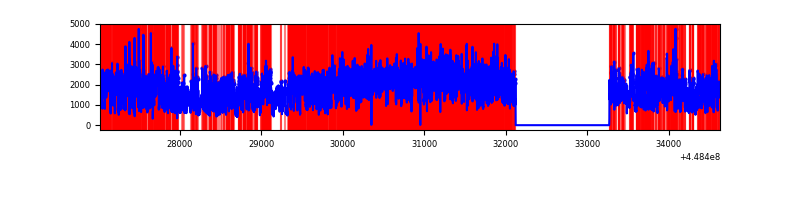 |
Top three noisy pixels from each quadrant. If the there are fewer than three noisy pixels in the level2.evt file, extra rows are filled as -1
| Pixel properties | Quadrant properties | ||||||
|---|---|---|---|---|---|---|---|
| Quadrant | DetID | PixID | Counts | Sigma | Mean | Median | Sigma |
| A | 10 | 83 | 2898642 | 18968.59 | 740 | 724 | 152.8 |
| A | 15 | 14 | 523181 | 3419.79 | 740 | 724 | 152.8 |
| A | 13 | 248 | 33585 | 215.09 | 740 | 724 | 152.8 |
| B | 3 | 112 | 2366670 | 16875.45 | 734 | 712 | 140.2 |
| B | 0 | 171 | 254006 | 1806.65 | 734 | 712 | 140.2 |
| B | 5 | 172 | 225372 | 1602.41 | 734 | 712 | 140.2 |
| C | 12 | 2 | 642771 | 3645.75 | 752 | 758 | 176.1 |
| C | 2 | 14 | 37117 | 206.47 | 752 | 758 | 176.1 |
| C | 12 | 250 | 18867 | 102.83 | 752 | 758 | 176.1 |
| D | 11 | 241 | 7064706 | 43173.04 | 648 | 630 | 163.6 |
| D | 1 | 52 | 1431925 | 8747.55 | 648 | 630 | 163.6 |
| D | 1 | 47 | 207714 | 1265.62 | 648 | 630 | 163.6 |
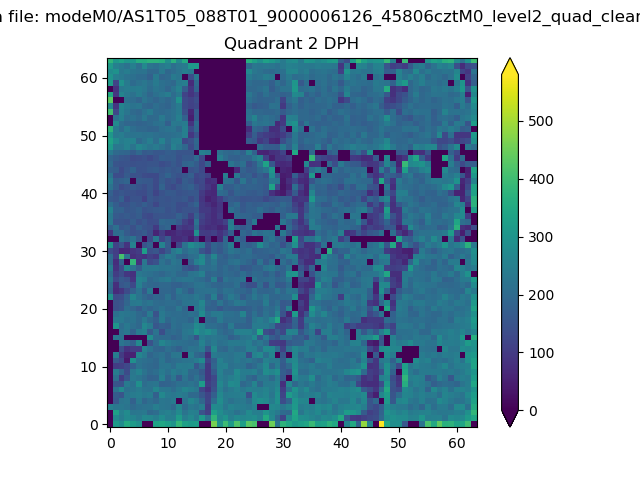
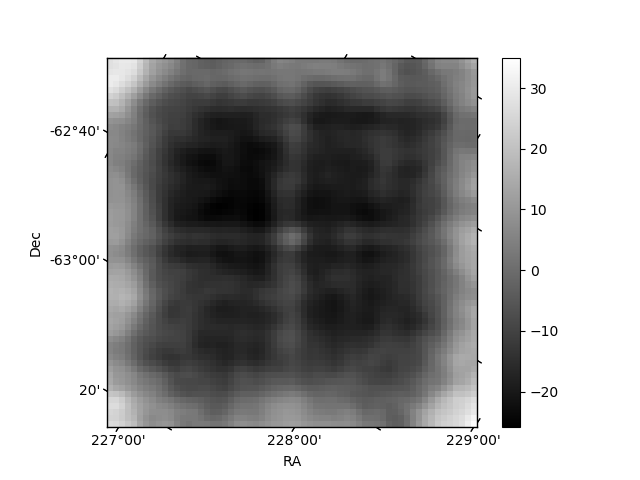
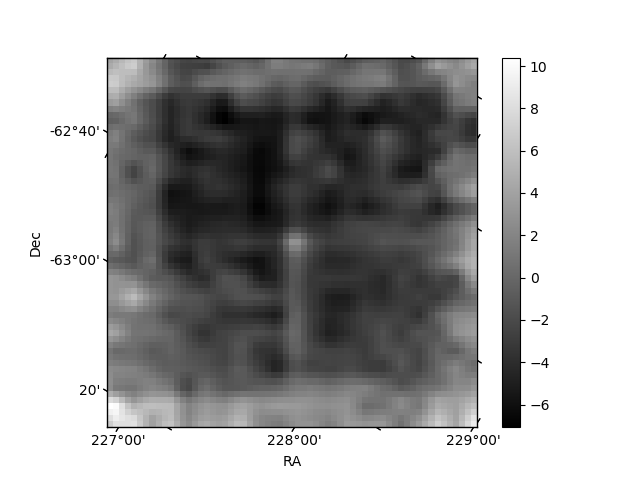
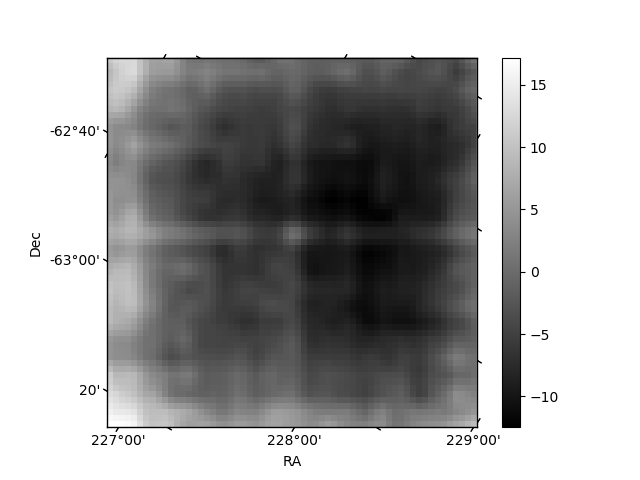
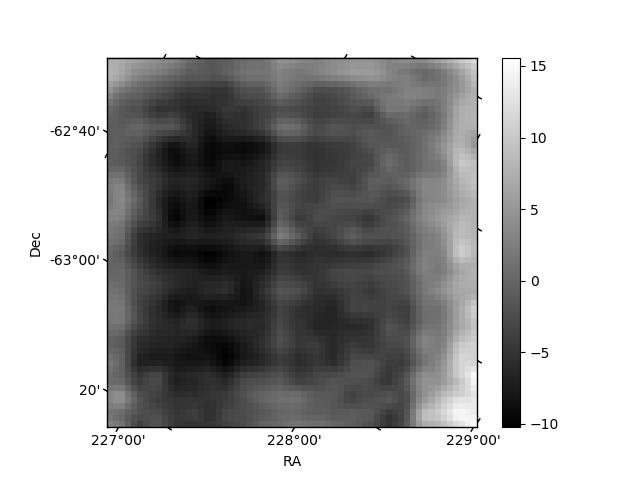
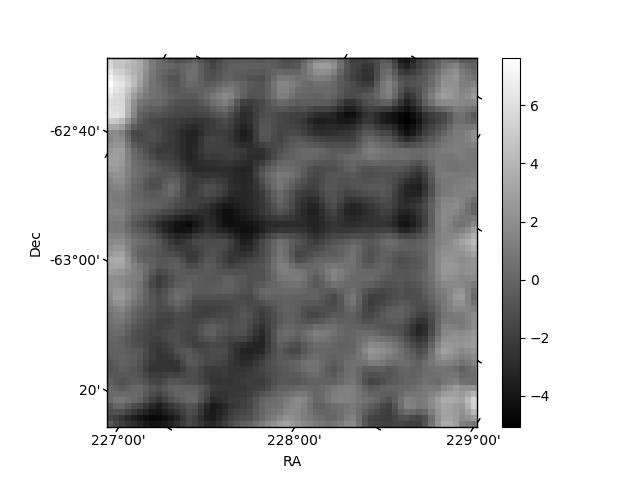
Histogram calculated using DETX and DETY for each event in the final _common_clean file
| Quadrant A | 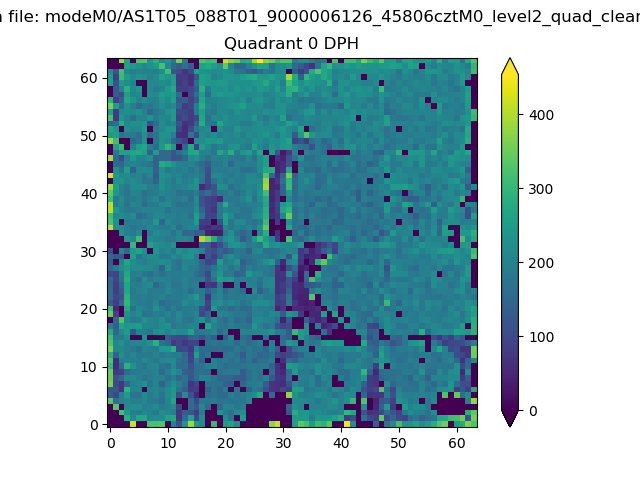 |
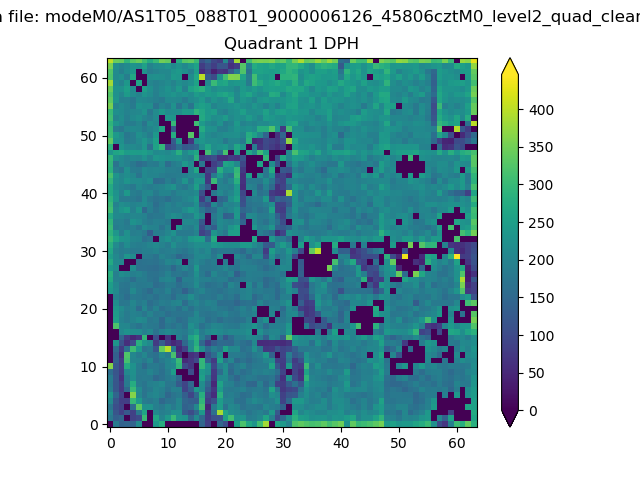 |
Quadrant B |
|---|---|---|---|
| Quadrant D | 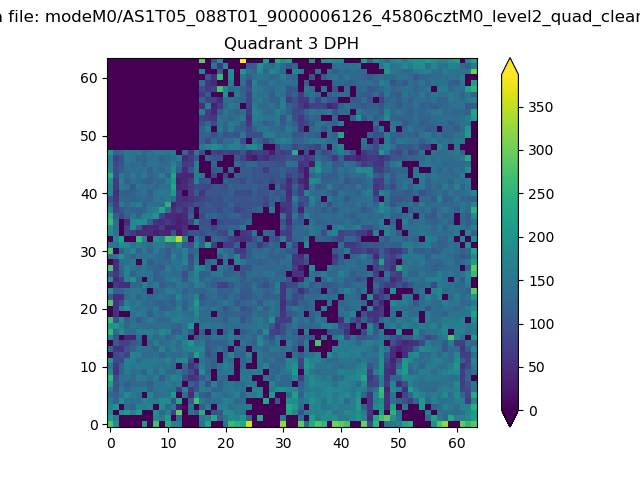 |
 |
Quadrant C |
| Plot type | Count rate plots | Images |
|---|---|---|
| Comparison with Poisson distribution Blue bars denote a histogram of data divided into 1 sec bins. Red curve is a Poisson curve with rate = median count rate of data. |
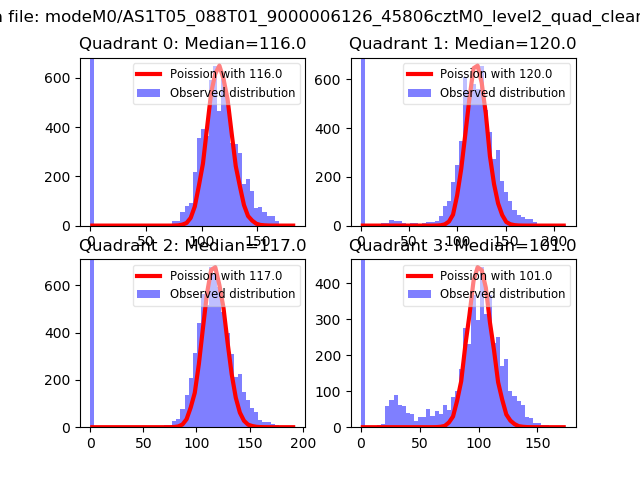 |
 |
| Quadrant-wise count rates Data is divided into 100 sec bins |
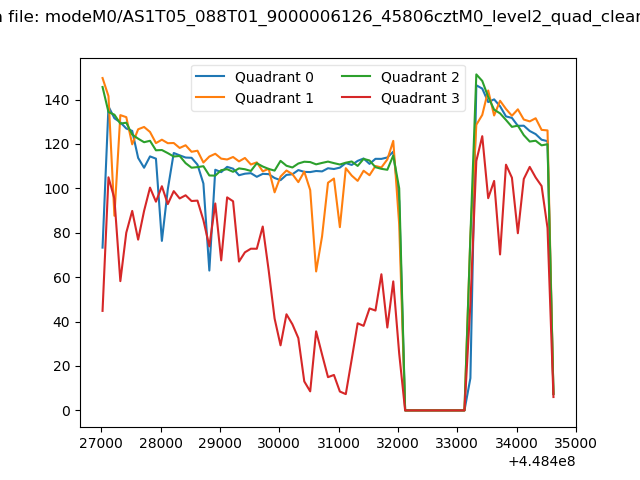 |
|
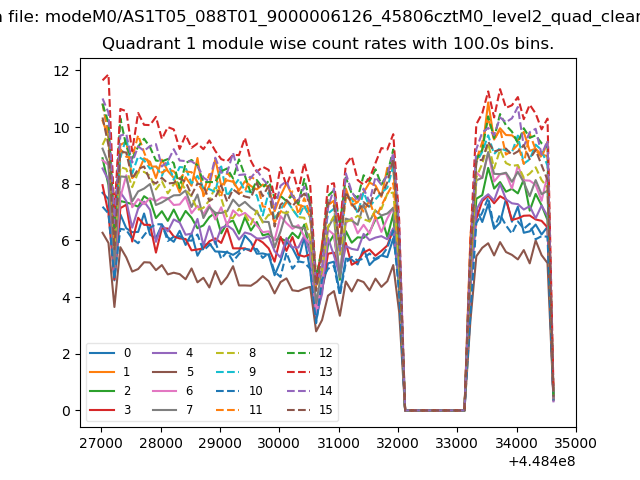
| Module-wise count rates for Quadrant A Data is divided into 100 sec bins |
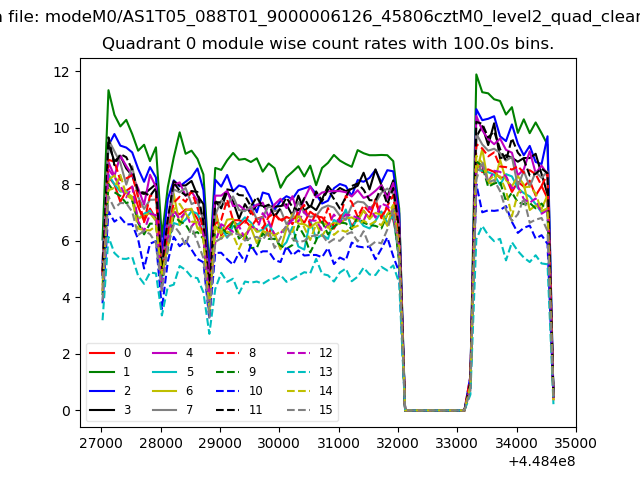 |
 |
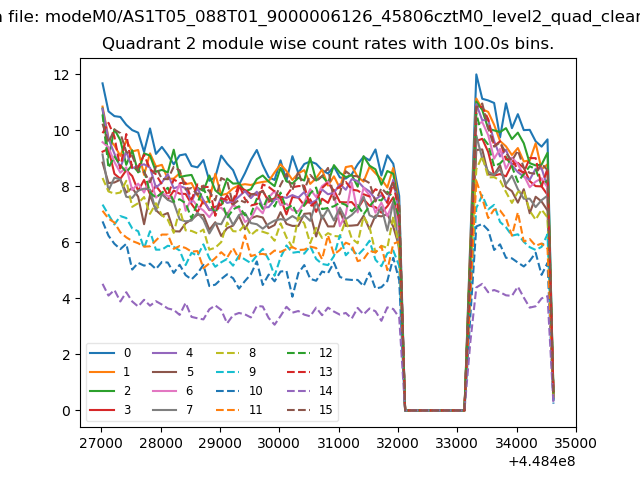
| Module-wise count rates for Quadrant B Data is divided into 100 sec bins |
 |
 |
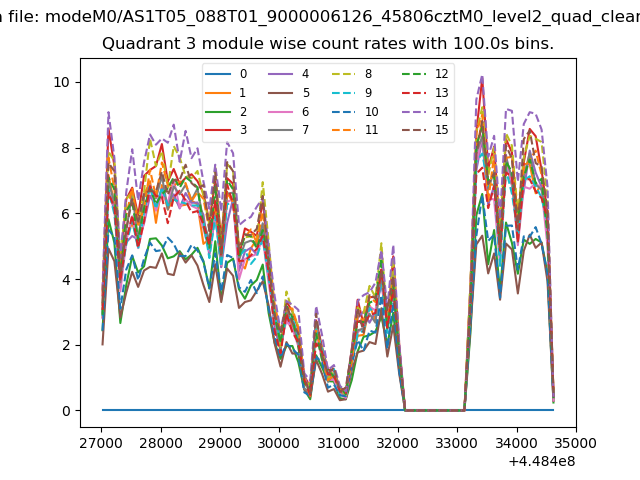
| Module-wise count rates for Quadrant C Data is divided into 100 sec bins |
 |
 |
| Module-wise count rates for Quadrant D Data is divided into 100 sec bins |
 |
 |
| Parameter | Plot |
|---|---|
| CZT HV Monitor | 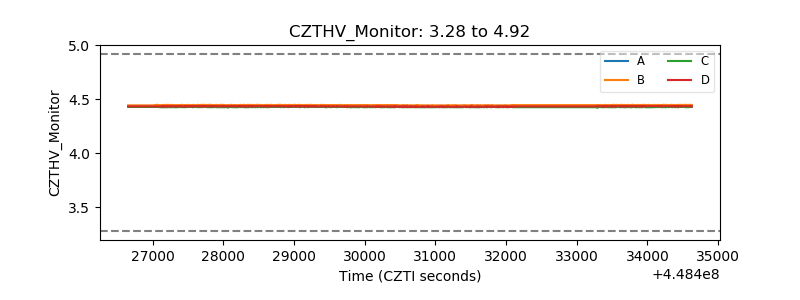 |
| D_VDD | 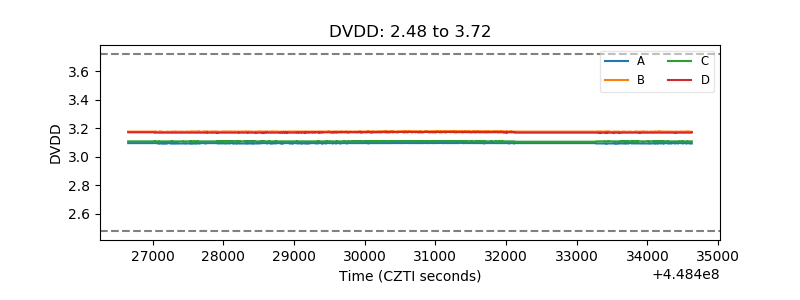 |
| Temperature 1 | 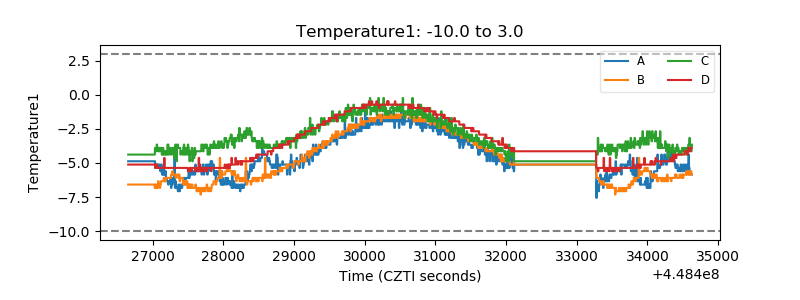 |
| Veto HV Monitor | 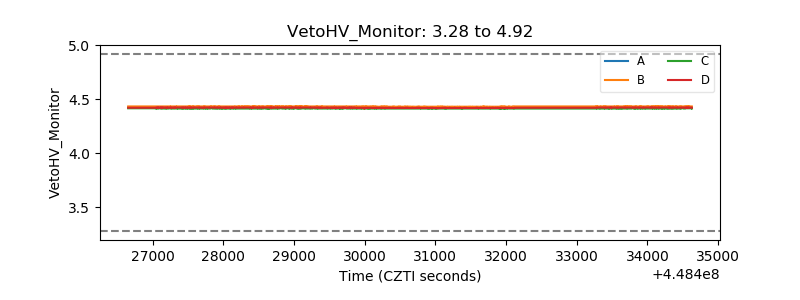 |
| Veto LLD | 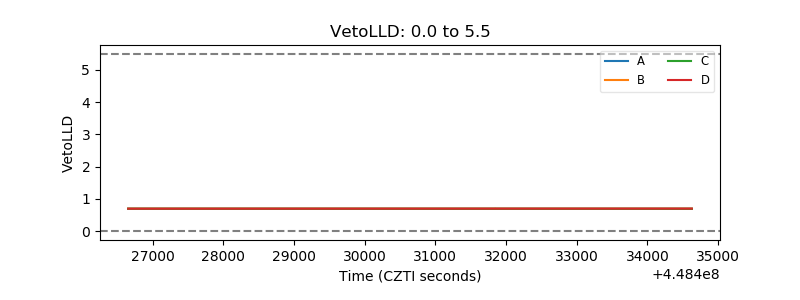 |
| Alpha Counter | 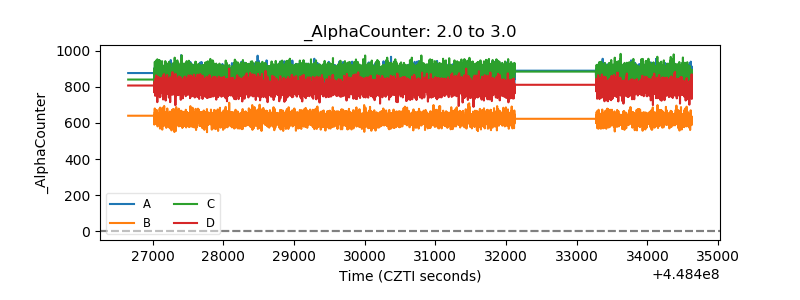 |
| _CPM_Rate | 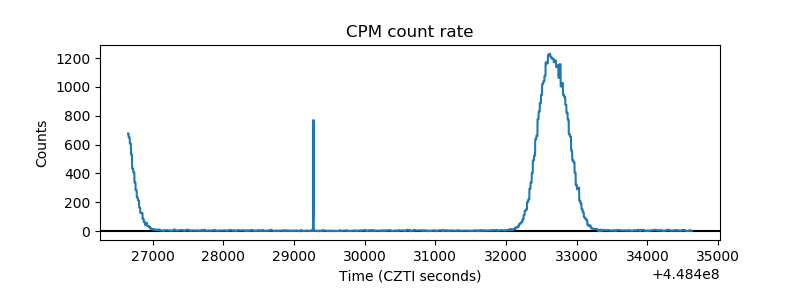 |
| CZT Counter | 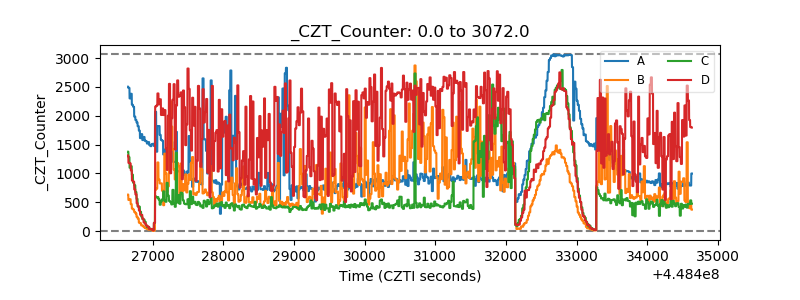 |
| +2.5 Volts monitor | 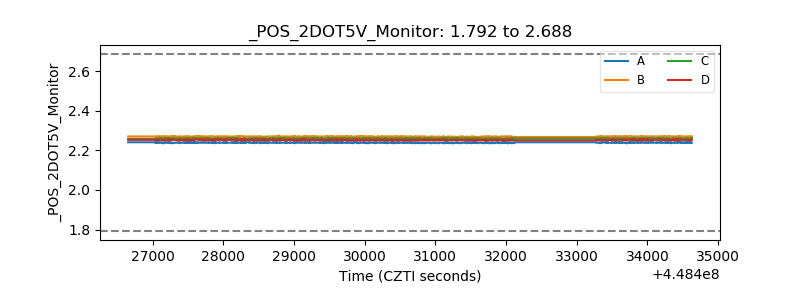 |
| +5 Volts monitor | 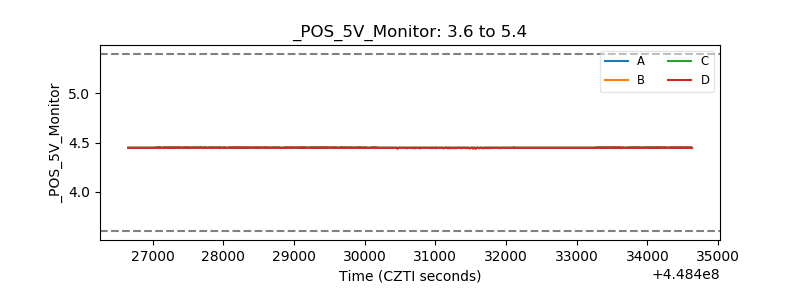 |
| _ROLL_ROT | 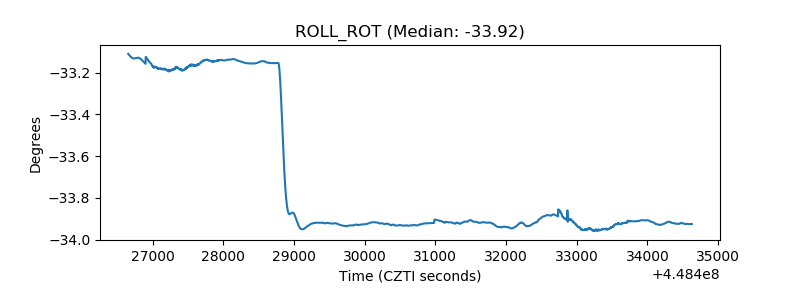 |
| _Roll_DEC | 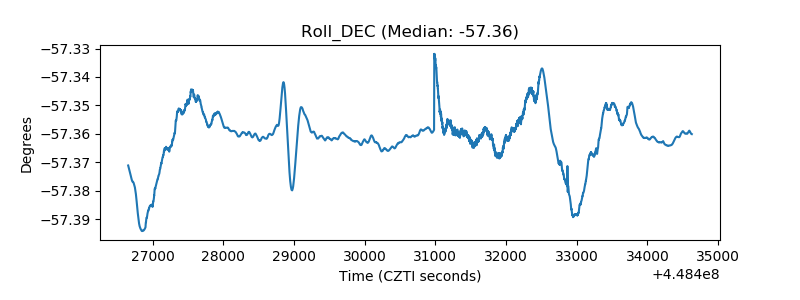 |
| _Roll_RA | 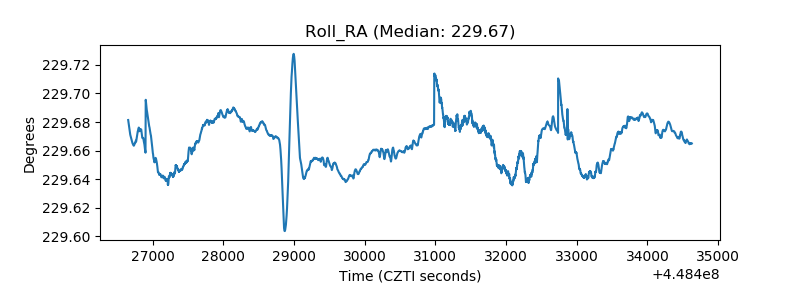 |
| Veto Counter | 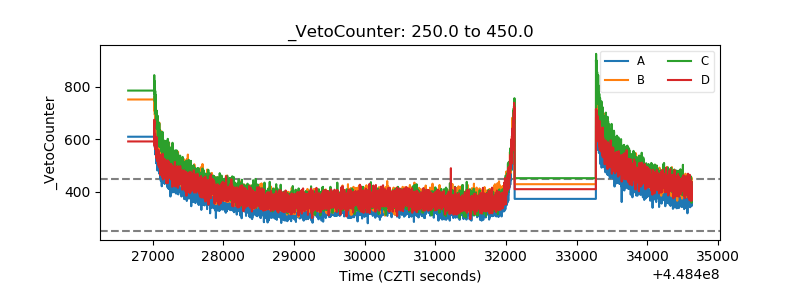 |