| Param | Original file | Final file |
|---|---|---|
| Filename | modeM0/AS1T05_088T01_9000006126_45808cztM0_level2.fits | modeM0/AS1T05_088T01_9000006126_45808cztM0_level2_quad_clean.evt |
| Size (bytes) | 670,224,960 | 99,915,840 |
| Size | 639.2 MB | 95.3 MB |
| Events in quadrant A | 5,270,381 | 706,518 |
| Events in quadrant B | 7,116,910 | 652,782 |
| Events in quadrant C | 3,064,586 | 708,710 |
| Events in quadrant D | 8,897,306 | 540,492 |
| Mode M9 | |||
|---|---|---|---|
| Quadrant | BADHDUFLAG | Total packets | Discarded packets |
| A | 0 | 12 | 0 |
| B | 0 | 12 | 0 |
| C | 0 | 12 | 0 |
| D | 0 | 12 | 0 |
| Mode M0 | |||
|---|---|---|---|
| Quadrant | BADHDUFLAG | Total packets | Discarded packets |
| A | 0 | 19136 | 1 |
| B | 0 | 25343 | 1 |
| C | 0 | 13056 | 1 |
| D | 0 | 30596 | 1 |
| Mode SS | |||
|---|---|---|---|
| Quadrant | BADHDUFLAG | Total packets | Discarded packets |
| A | 0 | 122 | 0 |
| B | 0 | 122 | 0 |
| C | 0 | 122 | 0 |
| D | 0 | 122 | 0 |
| Quadrant | Total seconds | Saturated seconds | Saturation percentage |
|---|---|---|---|
| A | 5963 | 149 | 2.498742% |
| B | 5964 | 995 | 16.683434% |
| C | 5964 | 113 | 1.894702% |
| D | 5964 | 1311 | 21.981891% |
Noise dominated data is calculated using 1-second bins in cleaned event files. If a bin has >2000 counts, and if more than 50% of those come from <1% of pixels, then it is considered to be noise-dominated and hence unusable.
| Quadrant | # 1 sec bins | Bins with >0 counts | Bins with >2000 counts | High rate bins dominated by noise | Noise dominated (total time) | Noise dominated (detector-on time) | Marked lightcurve |
|---|---|---|---|---|---|---|---|
| A | 7138 | 5964 | 2 | 2 | 0.03% | 0.03% | 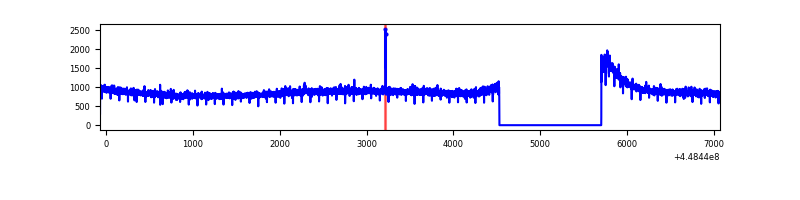 |
| B | 7139 | 5965 | 684 | 684 | 9.58% | 11.47% | 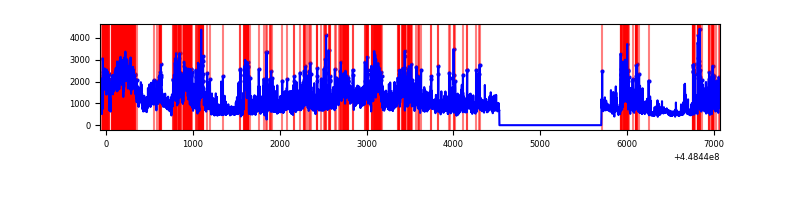 |
| C | 7139 | 5965 | 55 | 55 | 0.77% | 0.92% | 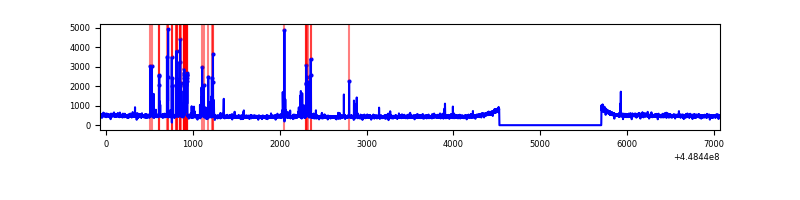 |
| D | 7139 | 5965 | 1212 | 1212 | 16.98% | 20.32% | 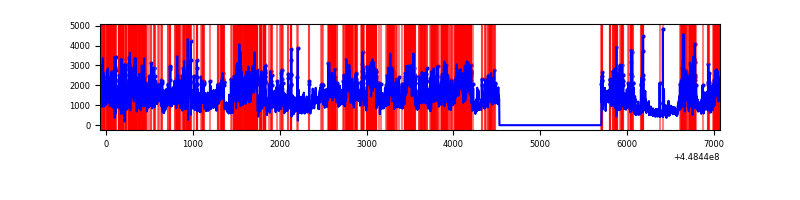 |
Top three noisy pixels from each quadrant. If the there are fewer than three noisy pixels in the level2.evt file, extra rows are filled as -1
| Pixel properties | Quadrant properties | ||||||
|---|---|---|---|---|---|---|---|
| Quadrant | DetID | PixID | Counts | Sigma | Mean | Median | Sigma |
| A | 10 | 83 | 2540093 | 17389.81 | 702 | 687 | 146.0 |
| A | 13 | 248 | 12172 | 78.65 | 702 | 687 | 146.0 |
| A | 13 | 254 | 10694 | 68.53 | 702 | 687 | 146.0 |
| B | 3 | 112 | 3933238 | 30201.29 | 674 | 654 | 130.2 |
| B | 0 | 171 | 184404 | 1411.16 | 674 | 654 | 130.2 |
| B | 4 | 171 | 92458 | 705.03 | 674 | 654 | 130.2 |
| C | 12 | 2 | 239501 | 1457.4 | 701 | 705 | 163.9 |
| C | 12 | 250 | 55098 | 331.97 | 701 | 705 | 163.9 |
| C | 12 | 249 | 13194 | 76.22 | 701 | 705 | 163.9 |
| D | 11 | 241 | 4479559 | 27171.93 | 658 | 638 | 164.8 |
| D | 1 | 52 | 563988 | 3417.63 | 658 | 638 | 164.8 |
| D | 1 | 47 | 425482 | 2577.37 | 658 | 638 | 164.8 |
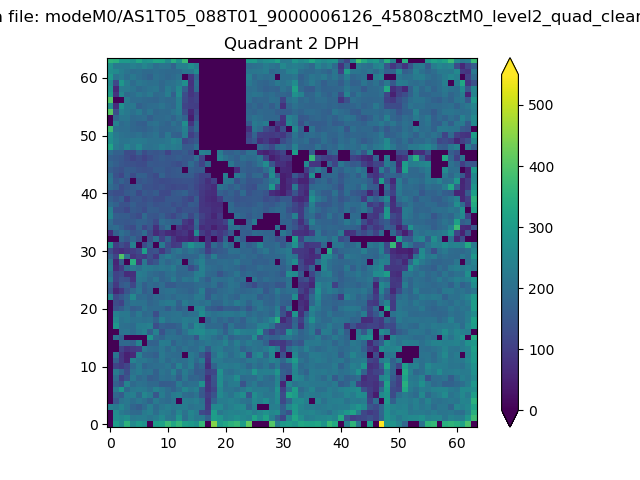
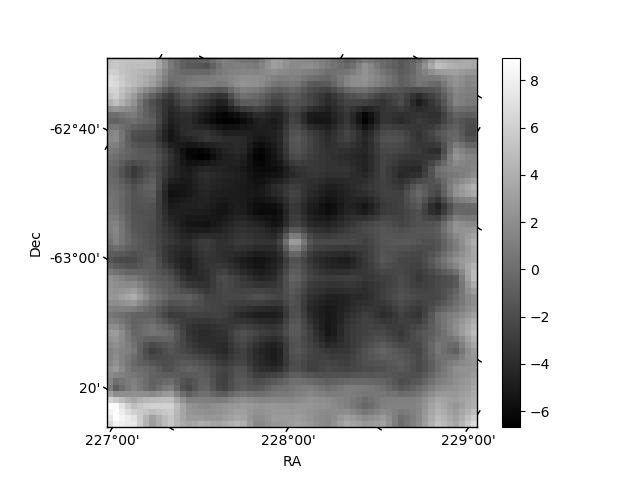
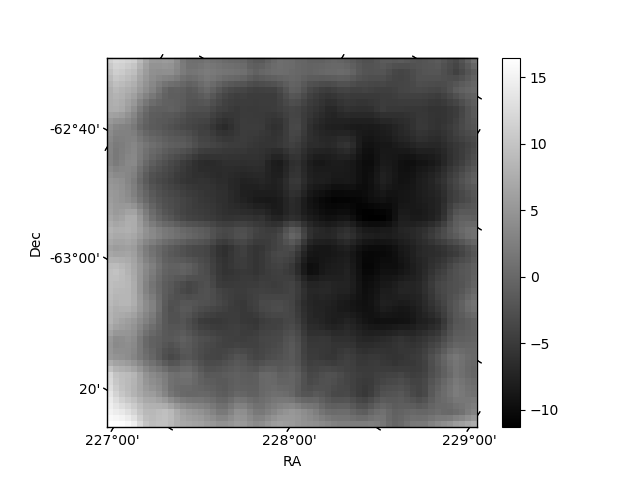
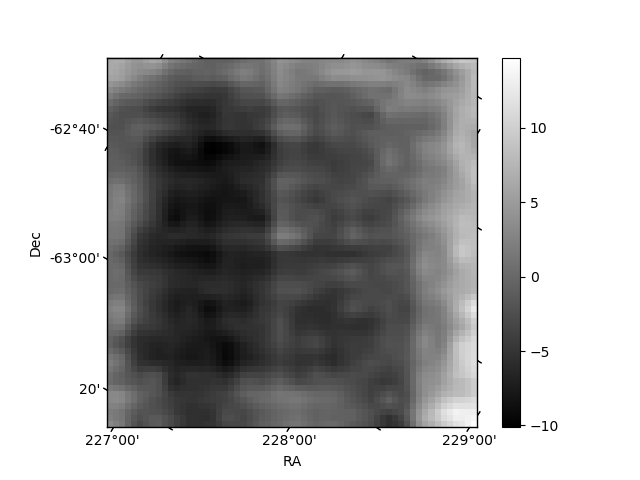
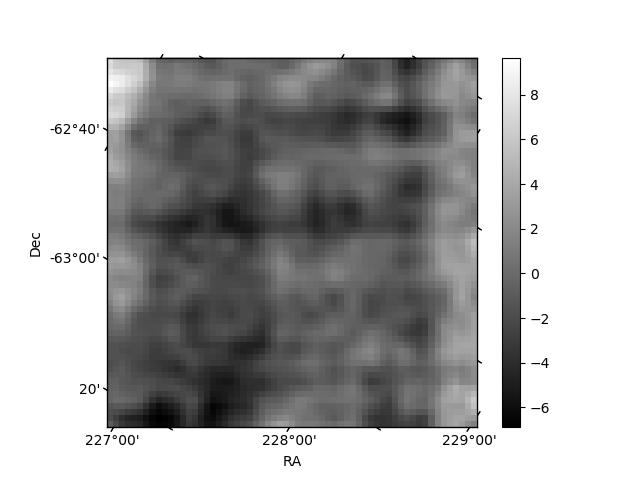
Histogram calculated using DETX and DETY for each event in the final _common_clean file
| Quadrant A | 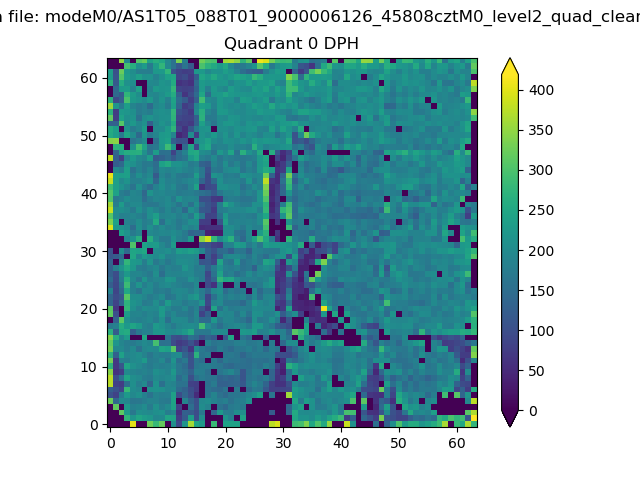 |
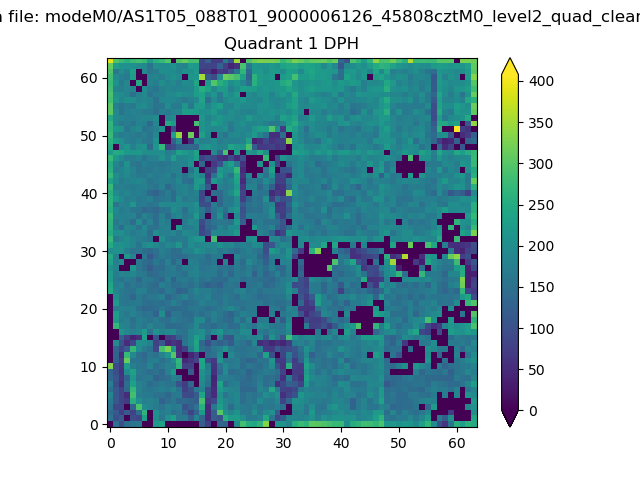 |
Quadrant B |
|---|---|---|---|
| Quadrant D | 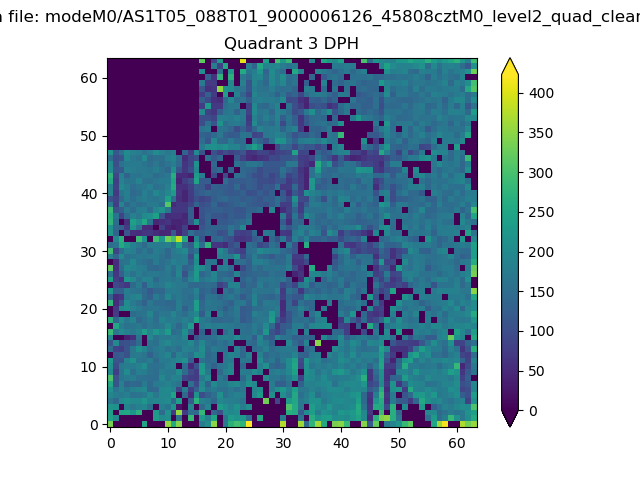 |
 |
Quadrant C |
| Plot type | Count rate plots | Images |
|---|---|---|
| Comparison with Poisson distribution Blue bars denote a histogram of data divided into 1 sec bins. Red curve is a Poisson curve with rate = median count rate of data. |
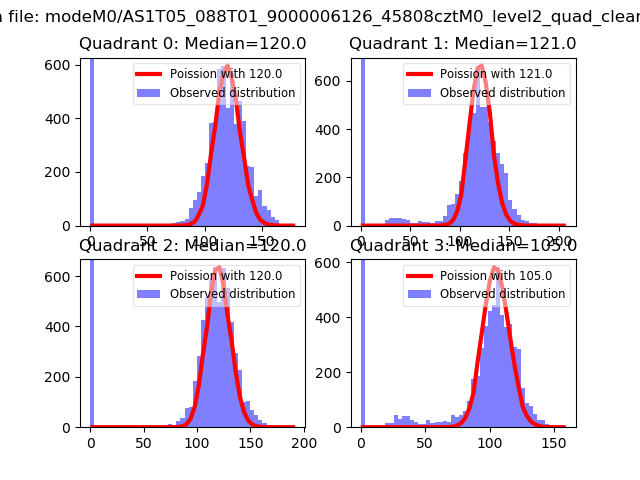 |
 |
| Quadrant-wise count rates Data is divided into 100 sec bins |
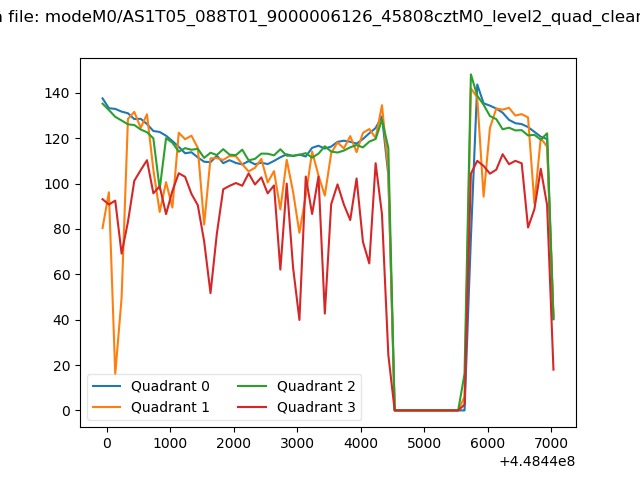 |
|
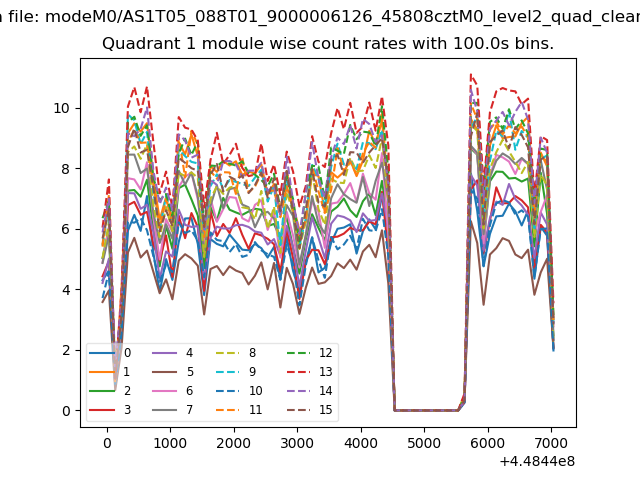
| Module-wise count rates for Quadrant A Data is divided into 100 sec bins |
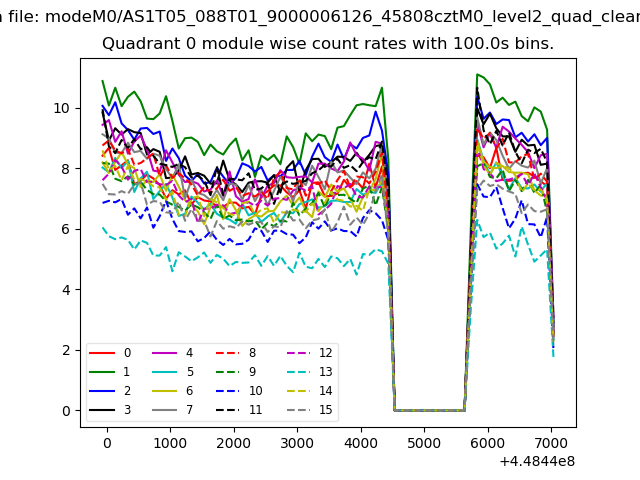 |
 |
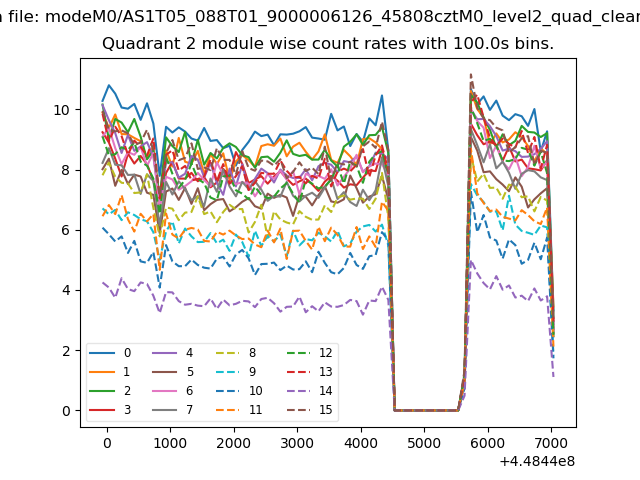
| Module-wise count rates for Quadrant B Data is divided into 100 sec bins |
 |
 |
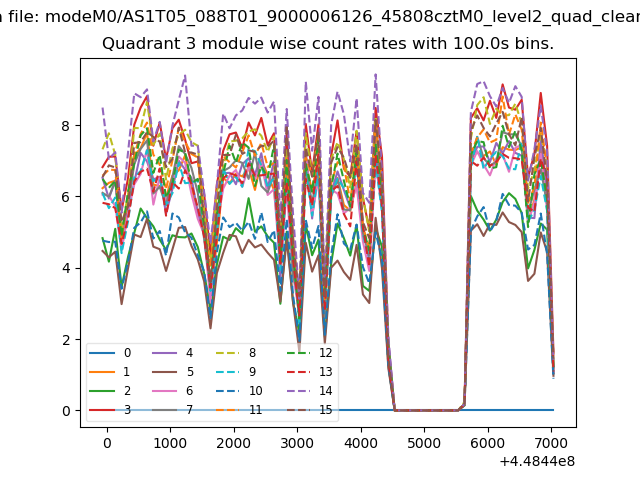
| Module-wise count rates for Quadrant C Data is divided into 100 sec bins |
 |
 |
| Module-wise count rates for Quadrant D Data is divided into 100 sec bins |
 |
 |
| Parameter | Plot |
|---|---|
| CZT HV Monitor | 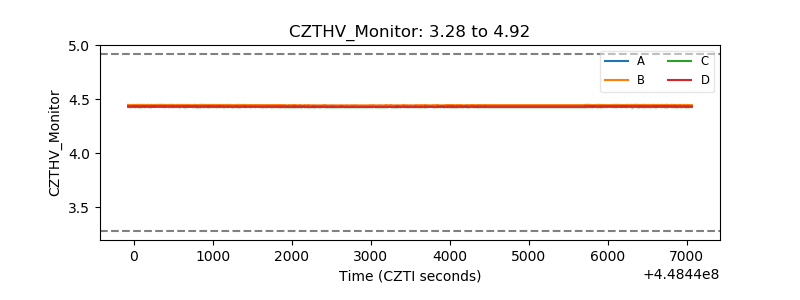 |
| D_VDD | 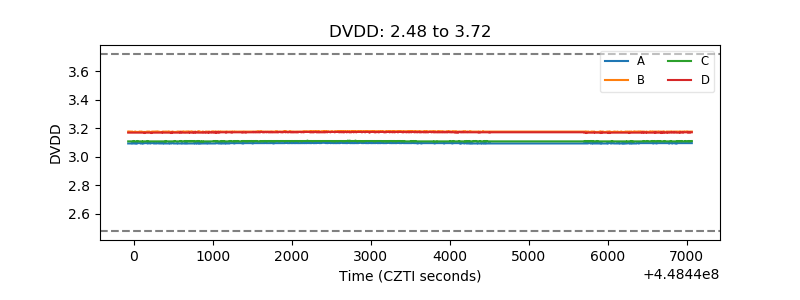 |
| Temperature 1 | 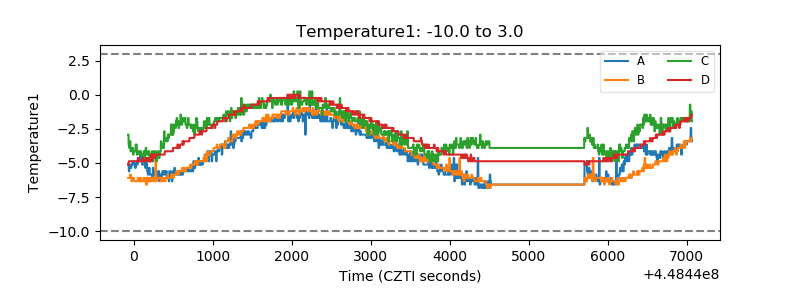 |
| Veto HV Monitor | 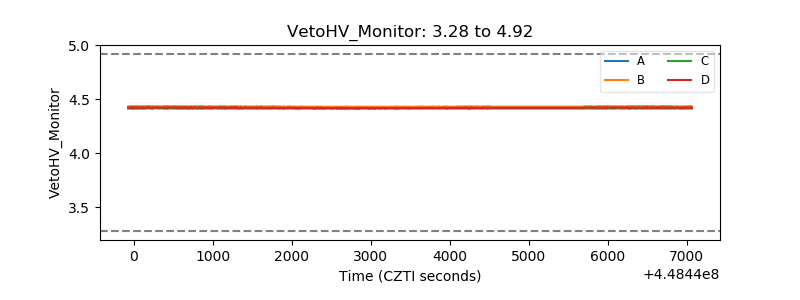 |
| Veto LLD | 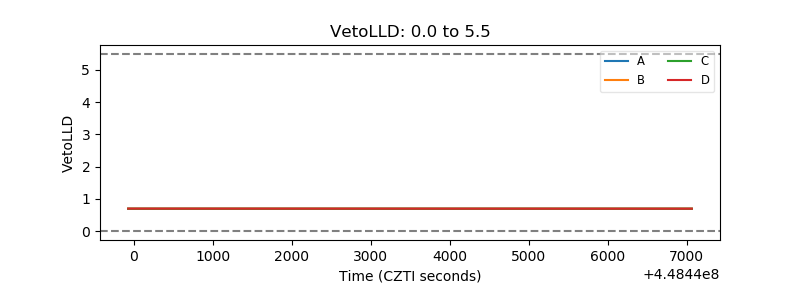 |
| Alpha Counter | 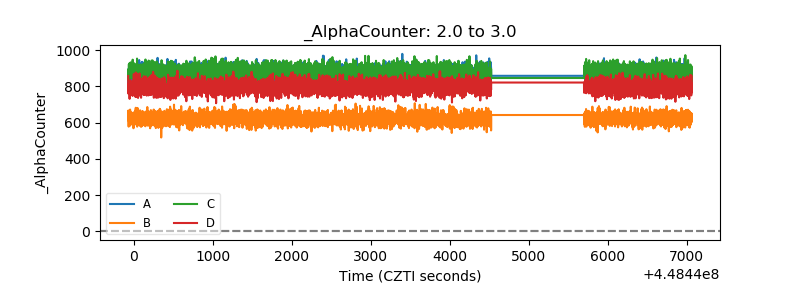 |
| _CPM_Rate | 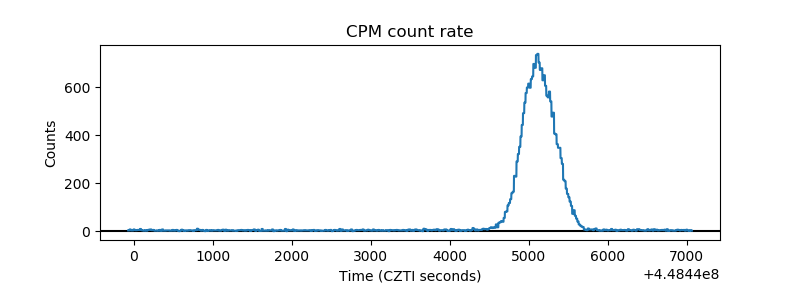 |
| CZT Counter | 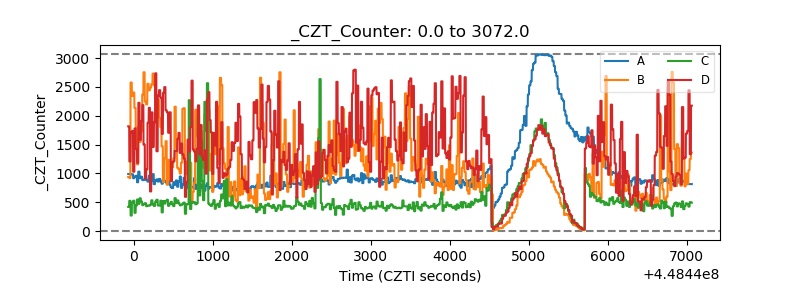 |
| +2.5 Volts monitor | 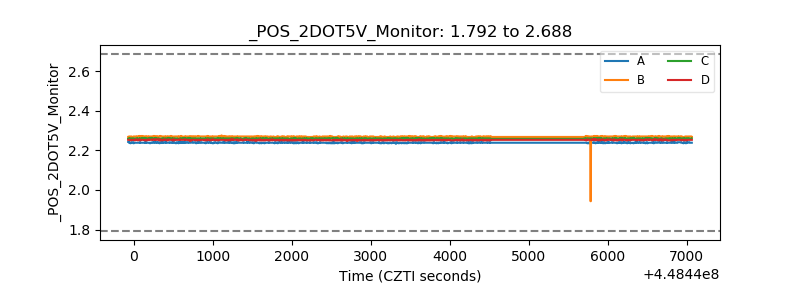 |
| +5 Volts monitor | 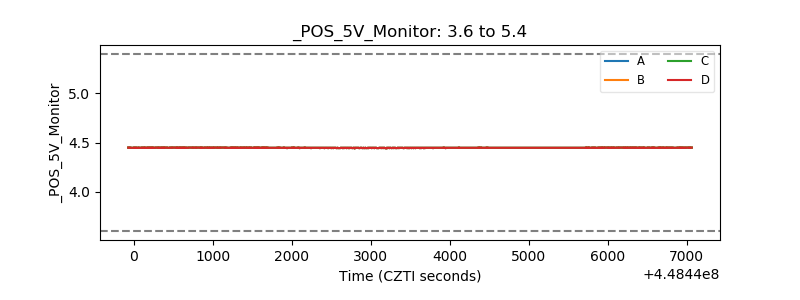 |
| _ROLL_ROT | 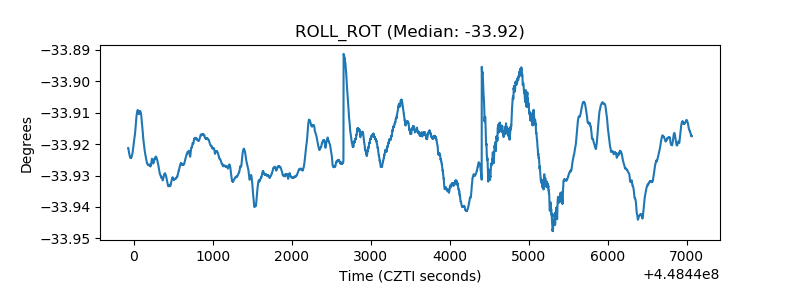 |
| _Roll_DEC | 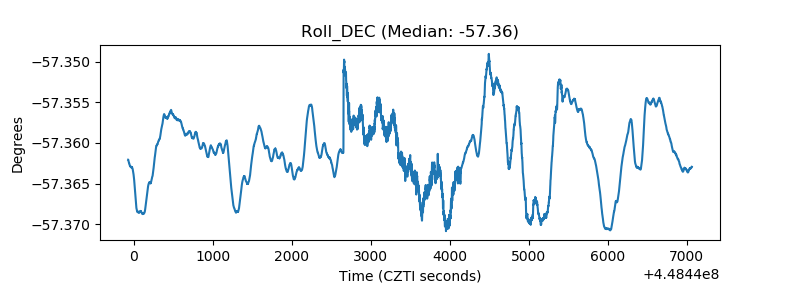 |
| _Roll_RA | 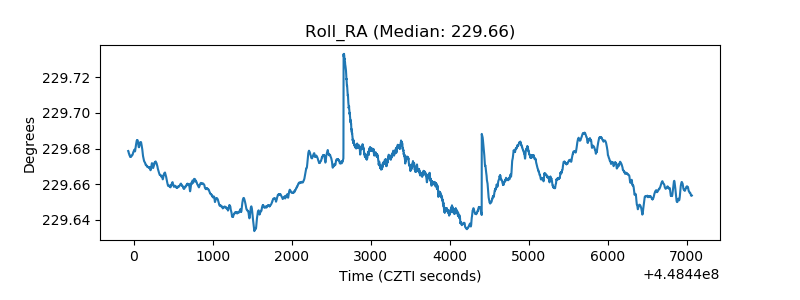 |
| Veto Counter | 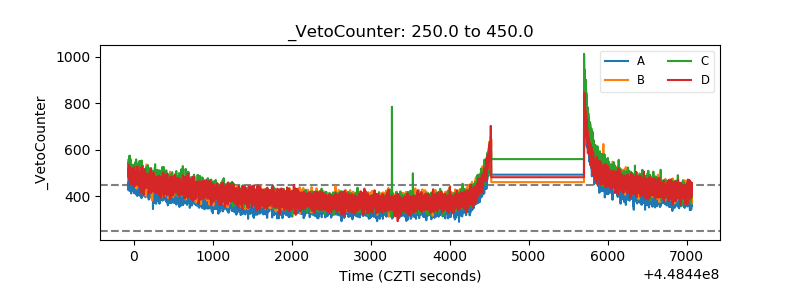 |