| Param | Original file | Final file |
|---|---|---|
| Filename | modeM0/AS1T05_088T01_9000006126_45809cztM0_level2.fits | modeM0/AS1T05_088T01_9000006126_45809cztM0_level2_quad_clean.evt |
| Size (bytes) | 736,479,360 | 100,252,800 |
| Size | 702.4 MB | 95.6 MB |
| Events in quadrant A | 5,772,440 | 732,435 |
| Events in quadrant B | 6,133,528 | 728,059 |
| Events in quadrant C | 2,994,084 | 742,323 |
| Events in quadrant D | 11,865,236 | 384,042 |
| Mode M9 | |||
|---|---|---|---|
| Quadrant | BADHDUFLAG | Total packets | Discarded packets |
| A | 0 | 10 | 0 |
| B | 0 | 10 | 0 |
| C | 0 | 10 | 0 |
| D | 0 | 10 | 0 |
| Mode M0 | |||
|---|---|---|---|
| Quadrant | BADHDUFLAG | Total packets | Discarded packets |
| A | 0 | 20865 | 1 |
| B | 0 | 22685 | 1 |
| C | 0 | 13305 | 1 |
| D | 0 | 39732 | 1 |
| Mode SS | |||
|---|---|---|---|
| Quadrant | BADHDUFLAG | Total packets | Discarded packets |
| A | 0 | 132 | 0 |
| B | 0 | 132 | 0 |
| C | 0 | 132 | 0 |
| D | 0 | 132 | 0 |
| Quadrant | Total seconds | Saturated seconds | Saturation percentage |
|---|---|---|---|
| A | 6424 | 226 | 3.518057% |
| B | 6424 | 608 | 9.464508% |
| C | 6424 | 105 | 1.634496% |
| D | 6424 | 3238 | 50.404732% |
Noise dominated data is calculated using 1-second bins in cleaned event files. If a bin has >2000 counts, and if more than 50% of those come from <1% of pixels, then it is considered to be noise-dominated and hence unusable.
| Quadrant | # 1 sec bins | Bins with >0 counts | Bins with >2000 counts | High rate bins dominated by noise | Noise dominated (total time) | Noise dominated (detector-on time) | Marked lightcurve |
|---|---|---|---|---|---|---|---|
| A | 7459 | 6425 | 0 | 0 | 0.00% | 0.00% | 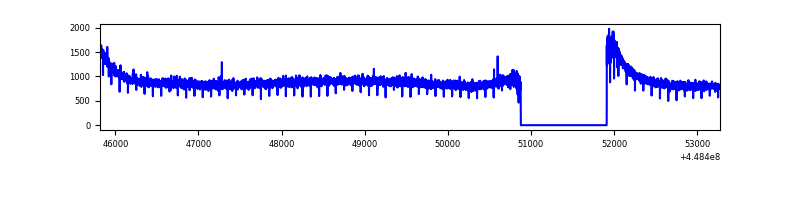 |
| B | 7459 | 6425 | 295 | 295 | 3.95% | 4.59% | 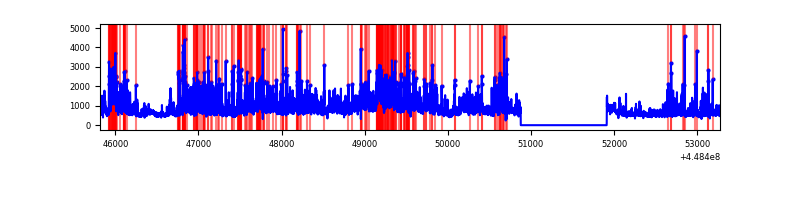 |
| C | 7459 | 6425 | 8 | 8 | 0.11% | 0.12% | 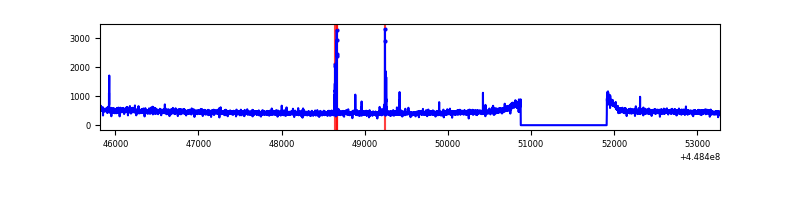 |
| D | 7459 | 6425 | 2920 | 2920 | 39.15% | 45.45% | 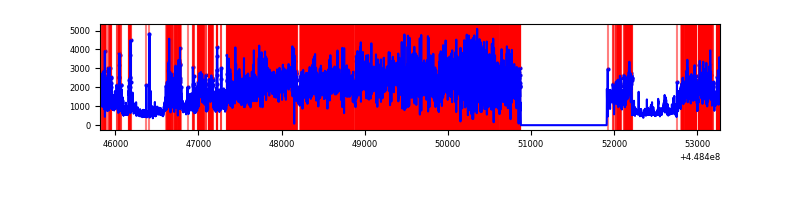 |
Top three noisy pixels from each quadrant. If the there are fewer than three noisy pixels in the level2.evt file, extra rows are filled as -1
| Pixel properties | Quadrant properties | ||||||
|---|---|---|---|---|---|---|---|
| Quadrant | DetID | PixID | Counts | Sigma | Mean | Median | Sigma |
| A | 10 | 83 | 2860505 | 18438.06 | 748 | 731 | 155.1 |
| A | 13 | 254 | 12152 | 73.64 | 748 | 731 | 155.1 |
| A | 13 | 248 | 9706 | 57.87 | 748 | 731 | 155.1 |
| B | 3 | 112 | 2736705 | 19562.14 | 733 | 712 | 139.9 |
| B | 4 | 171 | 80594 | 571.15 | 733 | 712 | 139.9 |
| B | 0 | 190 | 77047 | 545.79 | 733 | 712 | 139.9 |
| C | 12 | 2 | 53153 | 298.22 | 751 | 753 | 175.7 |
| C | 2 | 14 | 5460 | 26.79 | 751 | 753 | 175.7 |
| C | 13 | 61 | 5195 | 25.28 | 751 | 753 | 175.7 |
| D | 1 | 47 | 4245298 | 27811.71 | 604 | 585 | 152.6 |
| D | 11 | 241 | 3873066 | 25372.82 | 604 | 585 | 152.6 |
| D | 1 | 52 | 400404 | 2619.65 | 604 | 585 | 152.6 |
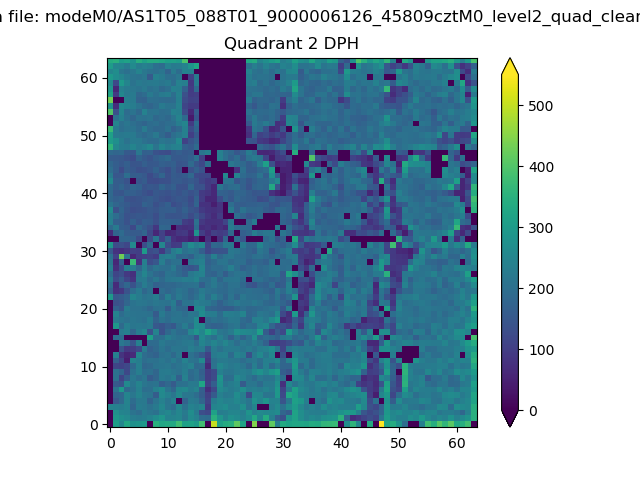
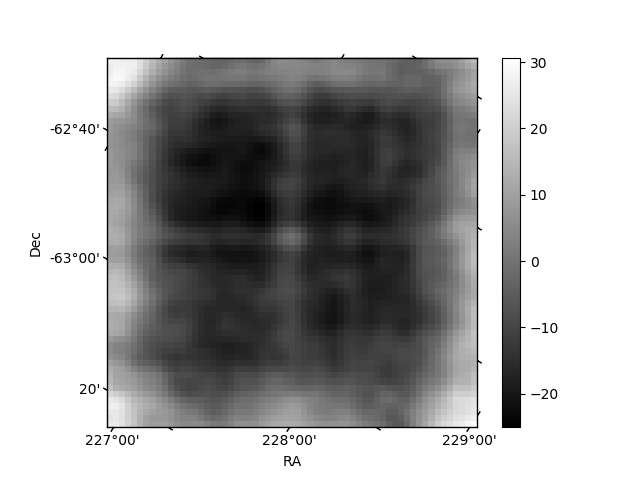
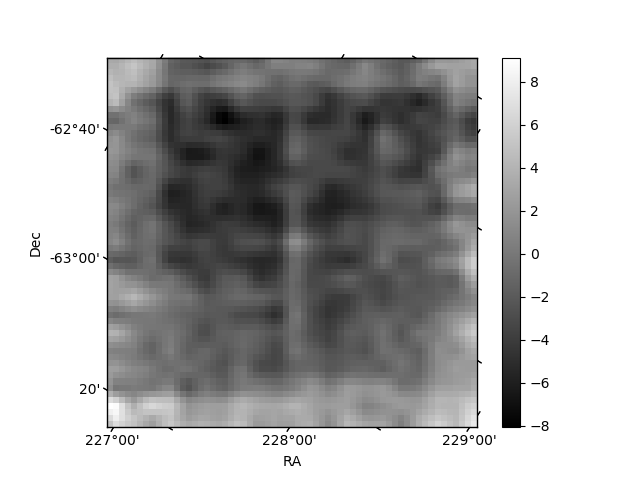
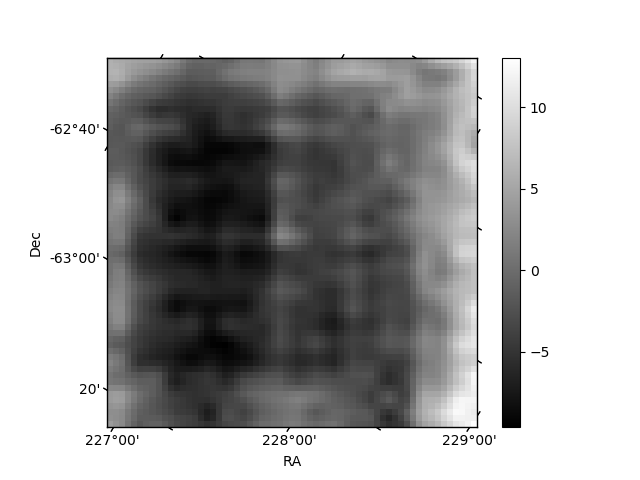
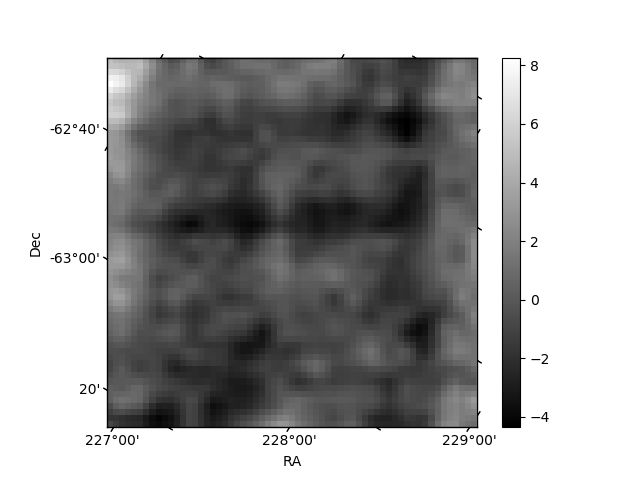
Histogram calculated using DETX and DETY for each event in the final _common_clean file
| Quadrant A | 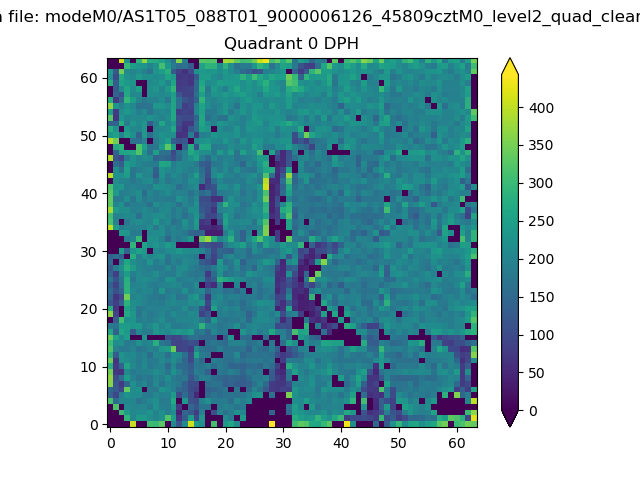 |
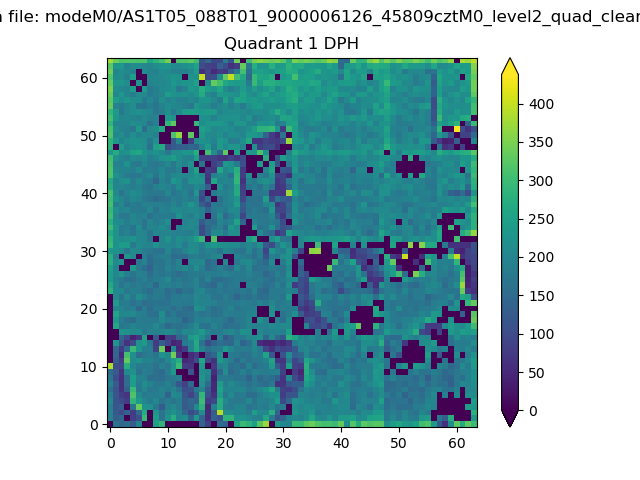 |
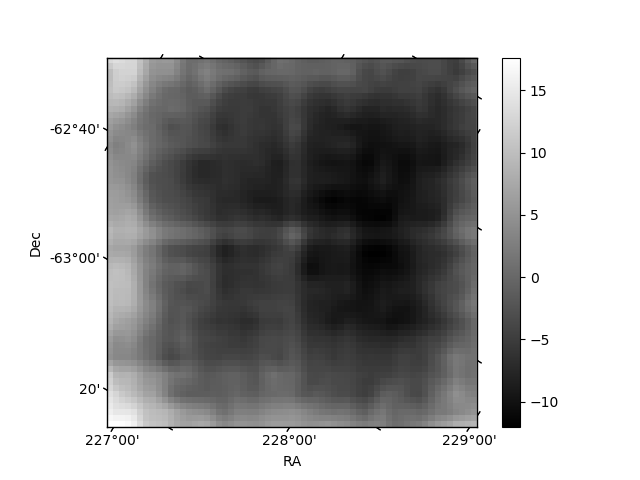
Quadrant B |
|---|---|---|---|
| Quadrant D | 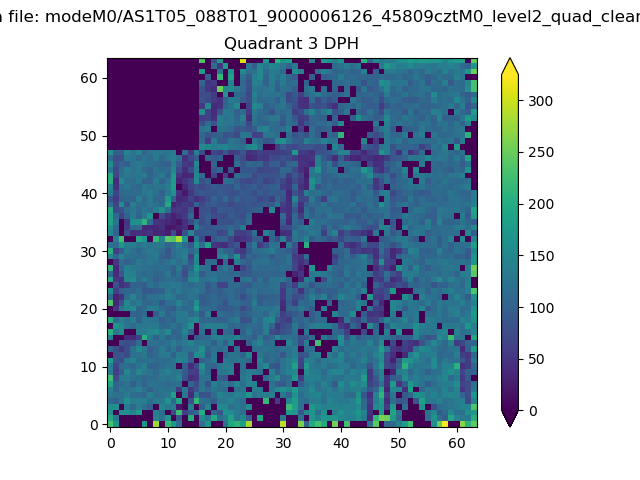 |
 |
Quadrant C |
| Plot type | Count rate plots | Images |
|---|---|---|
| Comparison with Poisson distribution Blue bars denote a histogram of data divided into 1 sec bins. Red curve is a Poisson curve with rate = median count rate of data. |
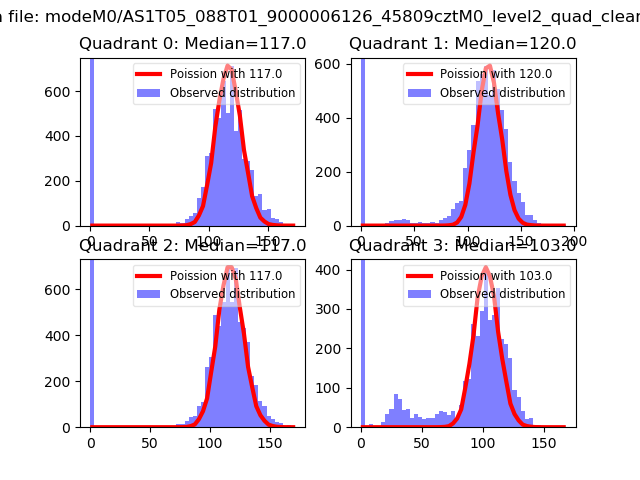 |
 |
| Quadrant-wise count rates Data is divided into 100 sec bins |
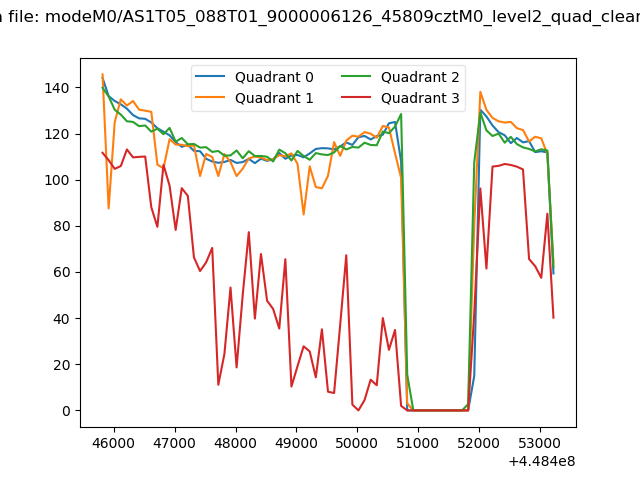 |
|
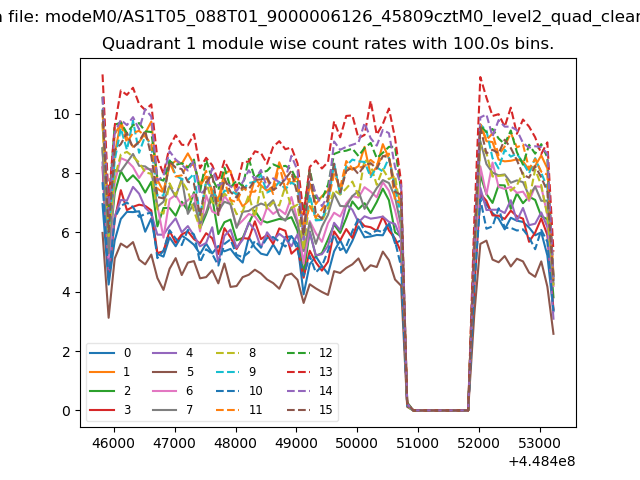
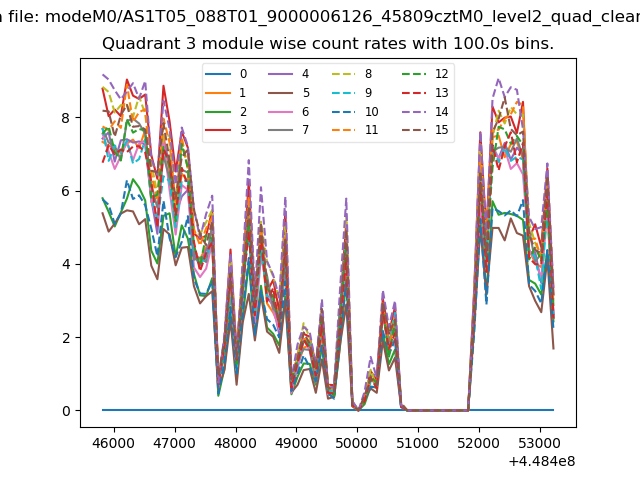
| Module-wise count rates for Quadrant A Data is divided into 100 sec bins |
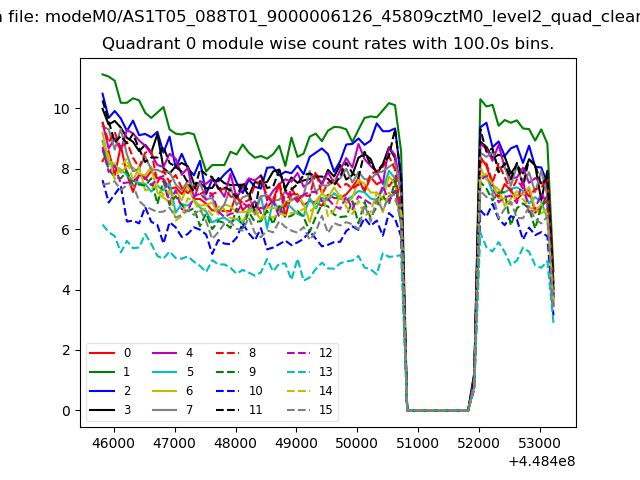 |
 |
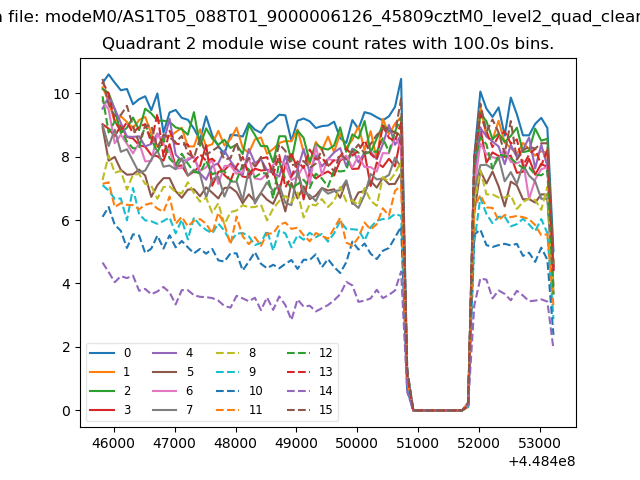
| Module-wise count rates for Quadrant B Data is divided into 100 sec bins |
 |
 |
| Module-wise count rates for Quadrant C Data is divided into 100 sec bins |
 |
 |
| Module-wise count rates for Quadrant D Data is divided into 100 sec bins |
 |
 |
| Parameter | Plot |
|---|---|
| CZT HV Monitor | 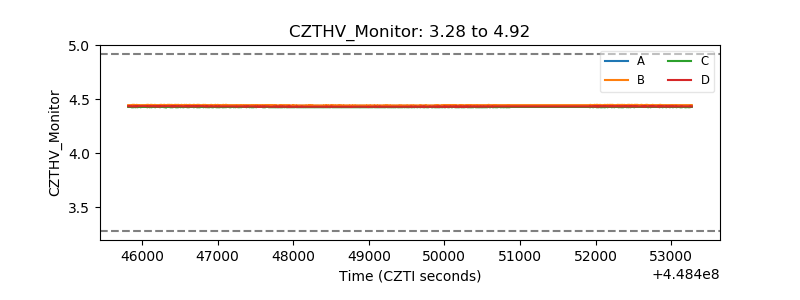 |
| D_VDD | 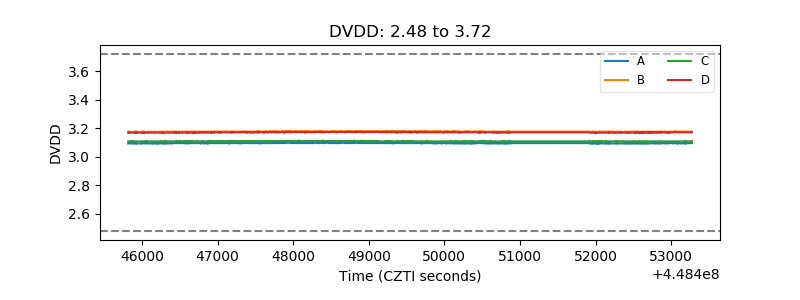 |
| Temperature 1 | 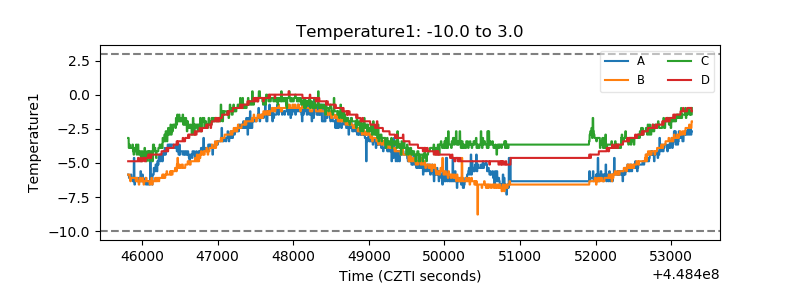 |
| Veto HV Monitor | 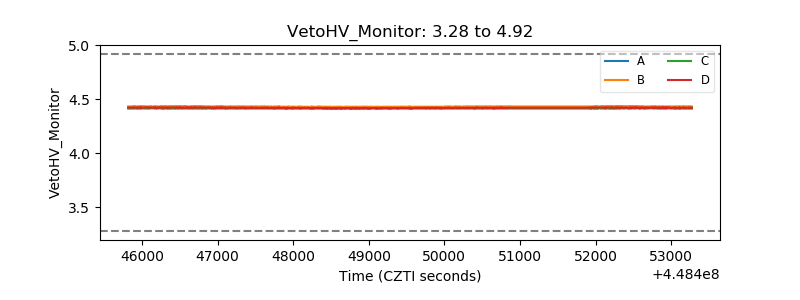 |
| Veto LLD | 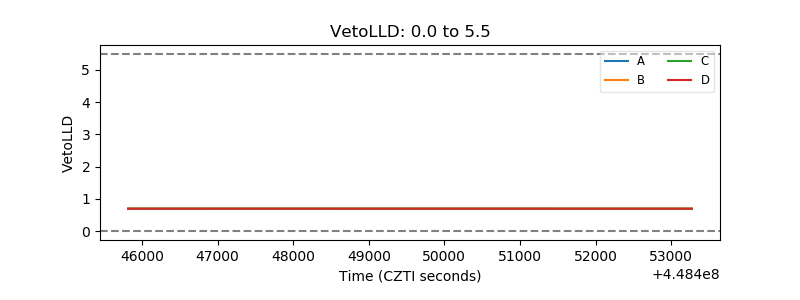 |
| Alpha Counter | 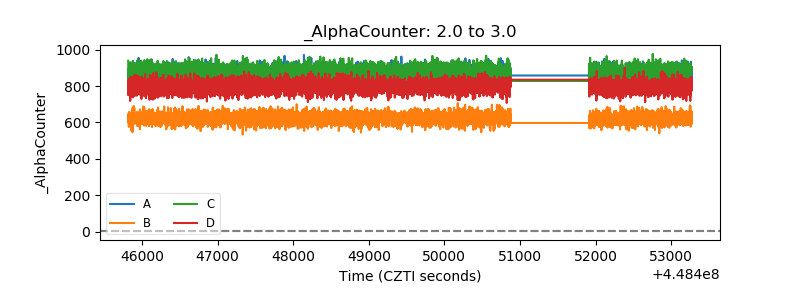 |
| _CPM_Rate | 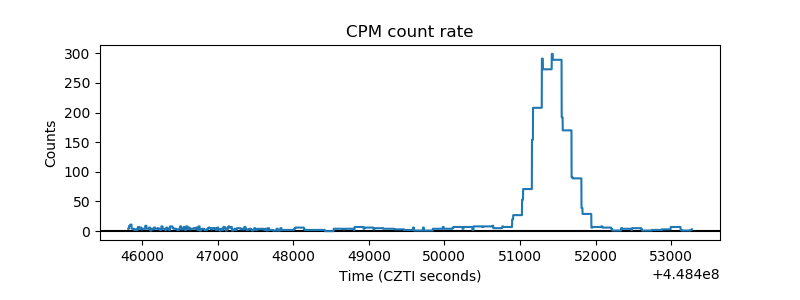 |
| CZT Counter | 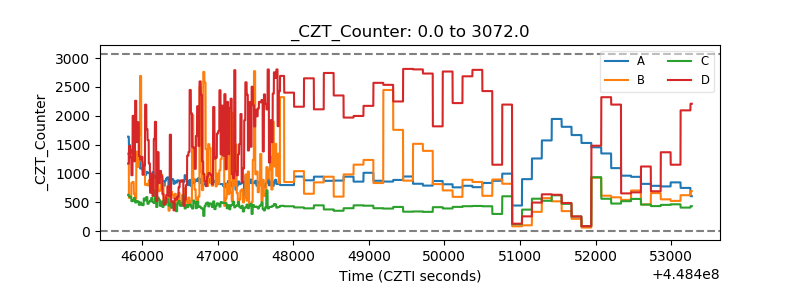 |
| +2.5 Volts monitor |  |
| +5 Volts monitor | 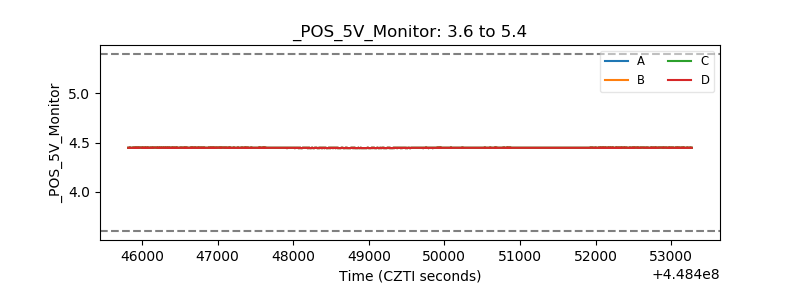 |
| _ROLL_ROT | 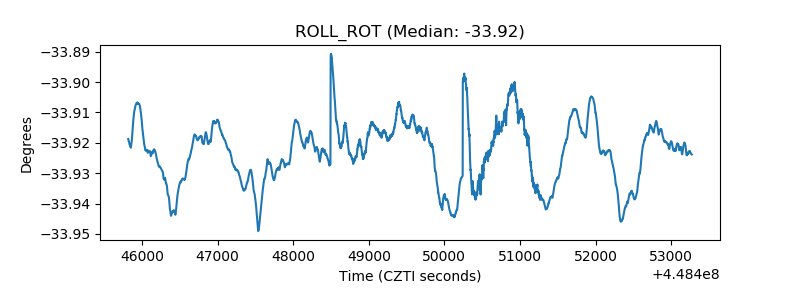 |
| _Roll_DEC | 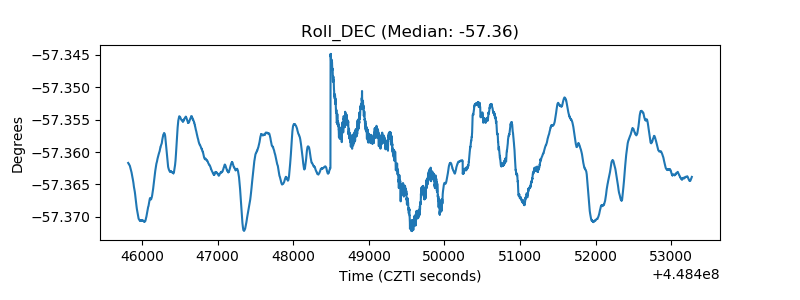 |
| _Roll_RA | 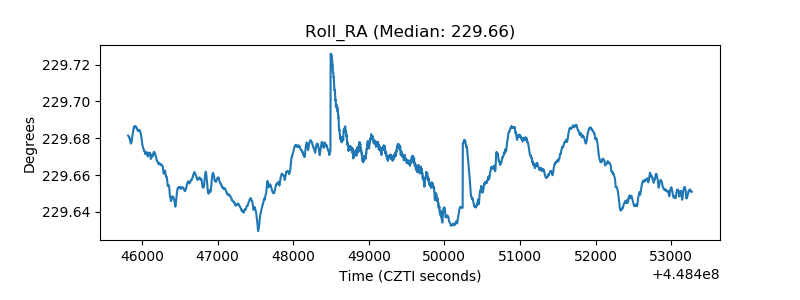 |
| Veto Counter | 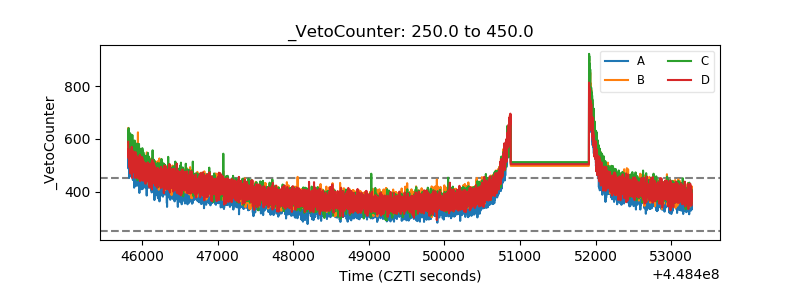 |