| Param | Original file | Final file |
|---|---|---|
| Filename | modeM0/AS1T05_088T01_9000006126_45810cztM0_level2.fits | modeM0/AS1T05_088T01_9000006126_45810cztM0_level2_quad_clean.evt |
| Size (bytes) | 858,890,880 | 107,703,360 |
| Size | 819.1 MB | 102.7 MB |
| Events in quadrant A | 6,514,146 | 778,960 |
| Events in quadrant B | 8,363,536 | 709,011 |
| Events in quadrant C | 3,350,035 | 806,742 |
| Events in quadrant D | 12,997,516 | 454,314 |
| Mode M9 | |||
|---|---|---|---|
| Quadrant | BADHDUFLAG | Total packets | Discarded packets |
| A | 0 | 8 | 0 |
| B | 0 | 9 | 0 |
| C | 0 | 9 | 0 |
| D | 0 | 9 | 0 |
| Mode M0 | |||
|---|---|---|---|
| Quadrant | BADHDUFLAG | Total packets | Discarded packets |
| A | 0 | 23760 | 2 |
| B | 0 | 29969 | 2 |
| C | 0 | 15251 | 2 |
| D | 0 | 43705 | 7 |
| Mode SS | |||
|---|---|---|---|
| Quadrant | BADHDUFLAG | Total packets | Discarded packets |
| A | 0 | 150 | 0 |
| B | 0 | 150 | 0 |
| C | 0 | 150 | 0 |
| D | 0 | 150 | 0 |
| Quadrant | Total seconds | Saturated seconds | Saturation percentage |
|---|---|---|---|
| A | 7350 | 415 | 5.646259% |
| B | 7350 | 1517 | 20.639456% |
| C | 7350 | 198 | 2.693878% |
| D | 7349 | 3284 | 44.686352% |
Noise dominated data is calculated using 1-second bins in cleaned event files. If a bin has >2000 counts, and if more than 50% of those come from <1% of pixels, then it is considered to be noise-dominated and hence unusable.
| Quadrant | # 1 sec bins | Bins with >0 counts | Bins with >2000 counts | High rate bins dominated by noise | Noise dominated (total time) | Noise dominated (detector-on time) | Marked lightcurve |
|---|---|---|---|---|---|---|---|
| A | 8095 | 7351 | 8 | 8 | 0.10% | 0.11% | 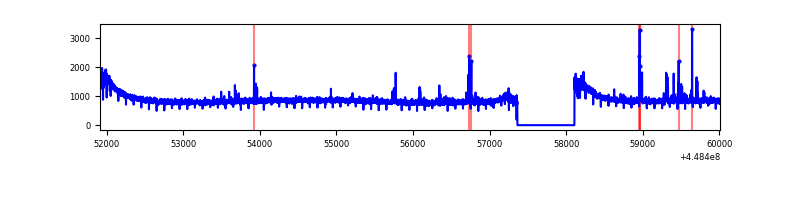 |
| B | 8095 | 7351 | 872 | 872 | 10.77% | 11.86% | 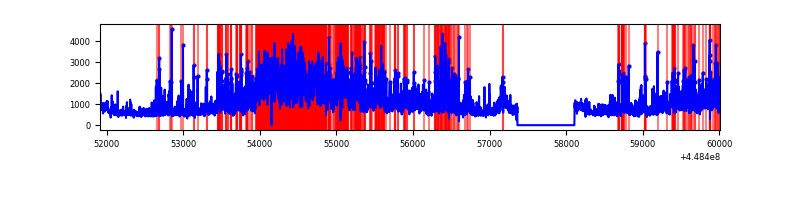 |
| C | 8095 | 7351 | 1 | 1 | 0.01% | 0.01% | 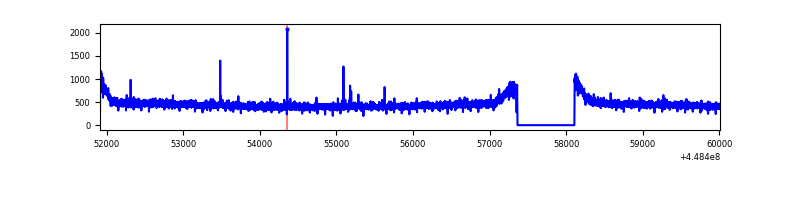 |
| D | 8094 | 7350 | 2772 | 2772 | 34.25% | 37.71% | 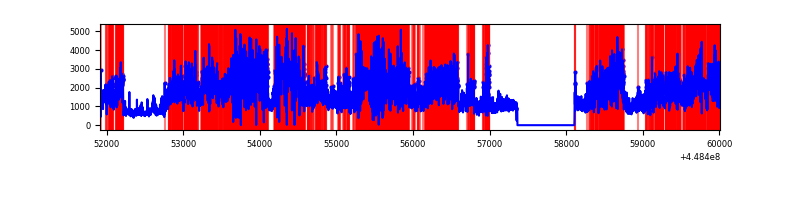 |
Top three noisy pixels from each quadrant. If the there are fewer than three noisy pixels in the level2.evt file, extra rows are filled as -1
| Pixel properties | Quadrant properties | ||||||
|---|---|---|---|---|---|---|---|
| Quadrant | DetID | PixID | Counts | Sigma | Mean | Median | Sigma |
| A | 10 | 83 | 3120823 | 17729.5 | 844 | 824 | 176.0 |
| A | 13 | 248 | 85044 | 478.58 | 844 | 824 | 176.0 |
| A | 7 | 3 | 20772 | 113.35 | 844 | 824 | 176.0 |
| B | 3 | 112 | 4295371 | 27221.19 | 809 | 783 | 157.8 |
| B | 0 | 171 | 319638 | 2021.06 | 809 | 783 | 157.8 |
| B | 4 | 171 | 137355 | 865.66 | 809 | 783 | 157.8 |
| C | 3 | 233 | 16039 | 76.38 | 852 | 856 | 198.8 |
| C | 2 | 14 | 12074 | 56.43 | 852 | 856 | 198.8 |
| C | 13 | 61 | 5679 | 24.26 | 852 | 856 | 198.8 |
| D | 1 | 47 | 6147072 | 34304.48 | 708 | 683 | 179.2 |
| D | 11 | 241 | 3264860 | 18218.16 | 708 | 683 | 179.2 |
| D | 13 | 249 | 254994 | 1419.37 | 708 | 683 | 179.2 |
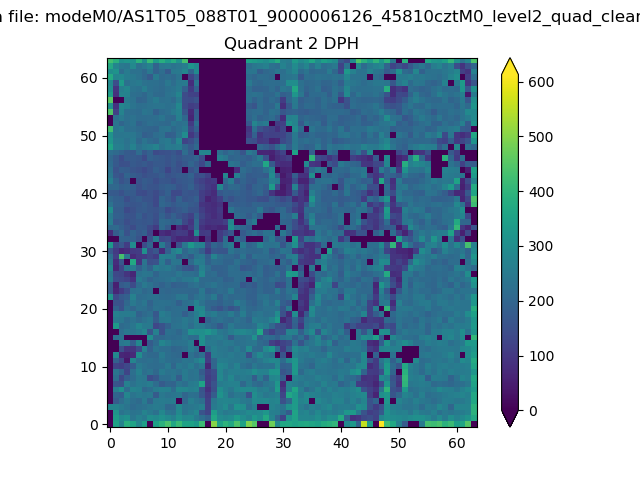
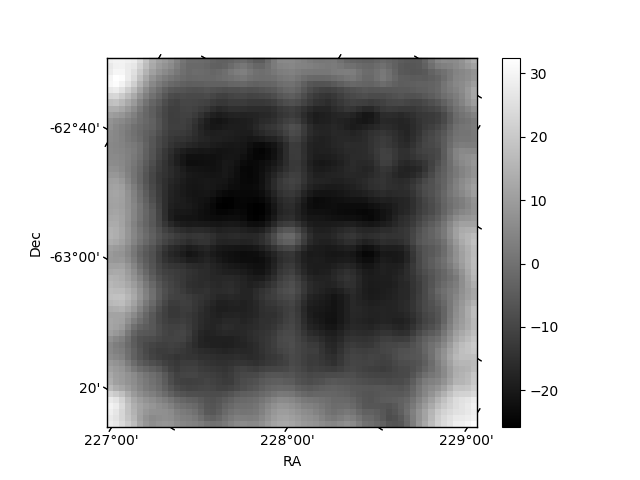
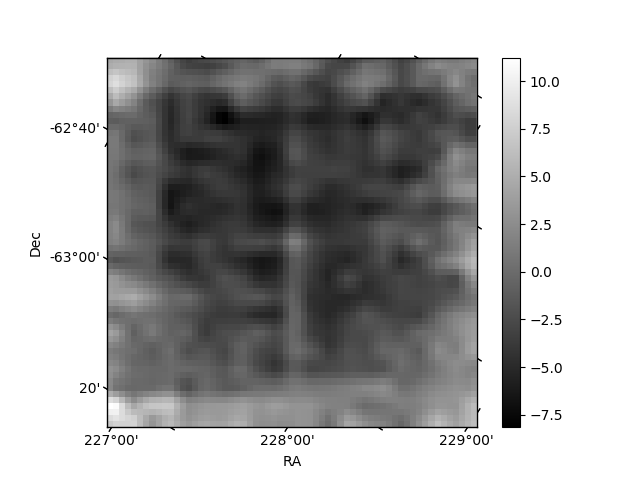
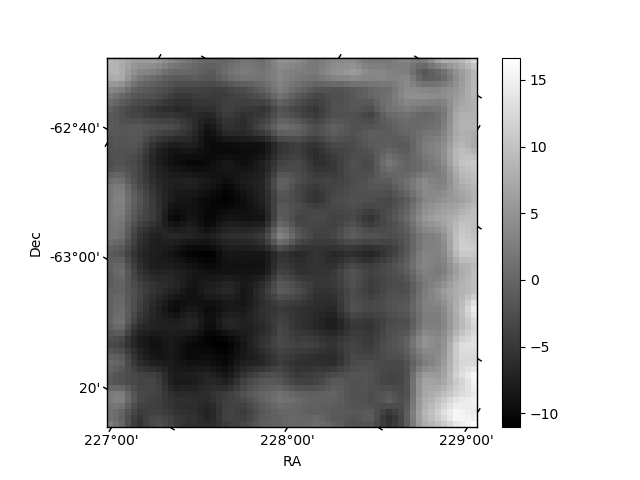
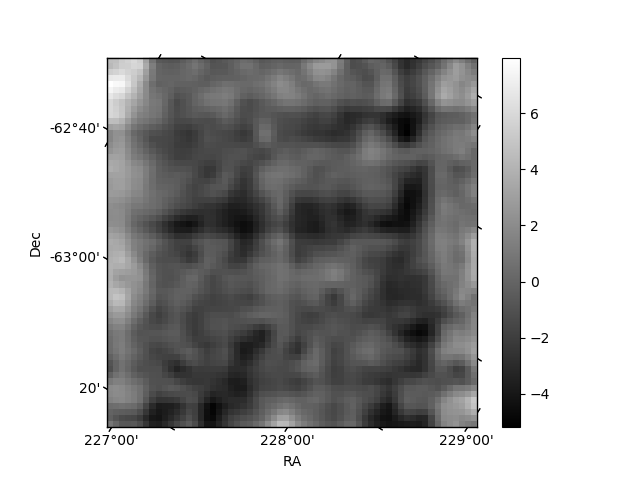
Histogram calculated using DETX and DETY for each event in the final _common_clean file
| Quadrant A | 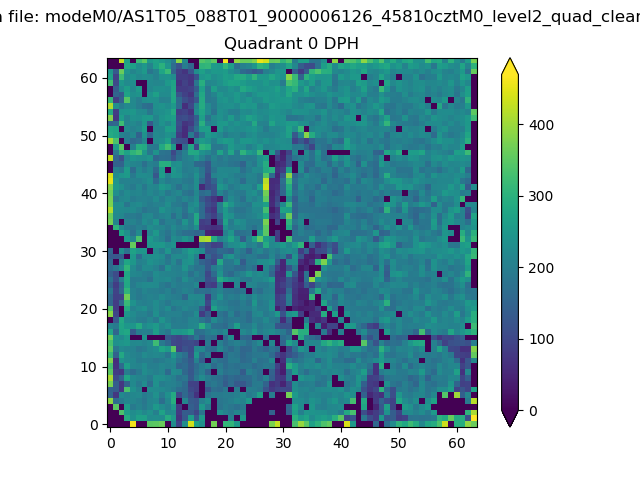 |
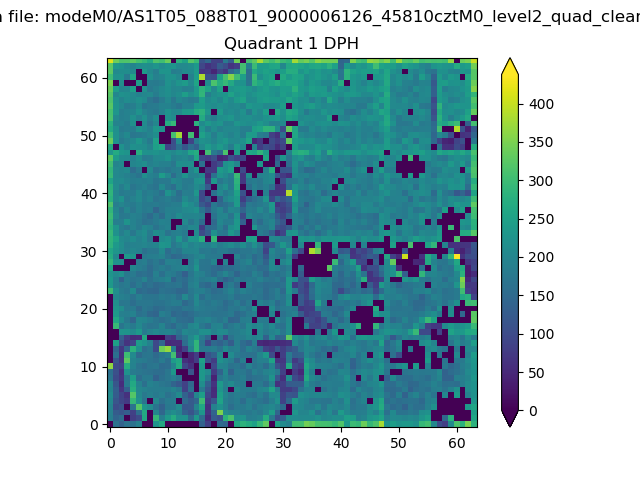 |
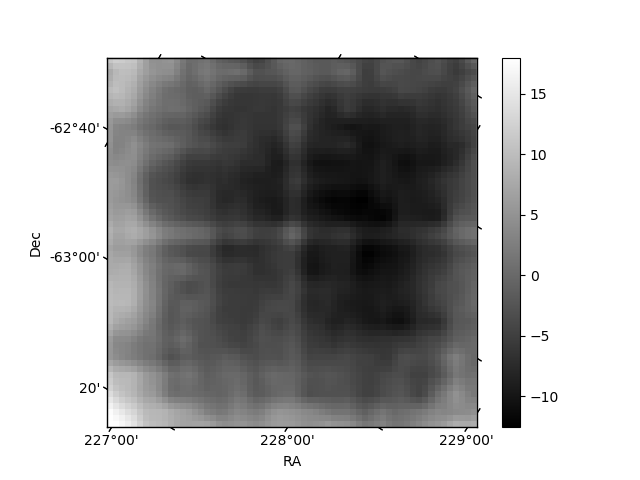
Quadrant B |
|---|---|---|---|
| Quadrant D | 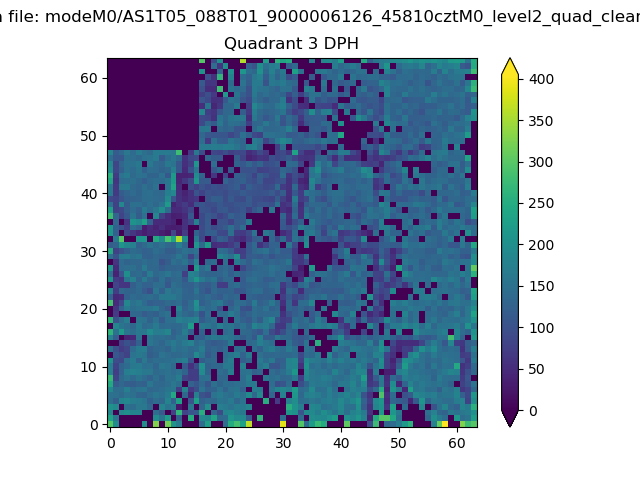 |
 |
Quadrant C |
| Plot type | Count rate plots | Images |
|---|---|---|
| Comparison with Poisson distribution Blue bars denote a histogram of data divided into 1 sec bins. Red curve is a Poisson curve with rate = median count rate of data. |
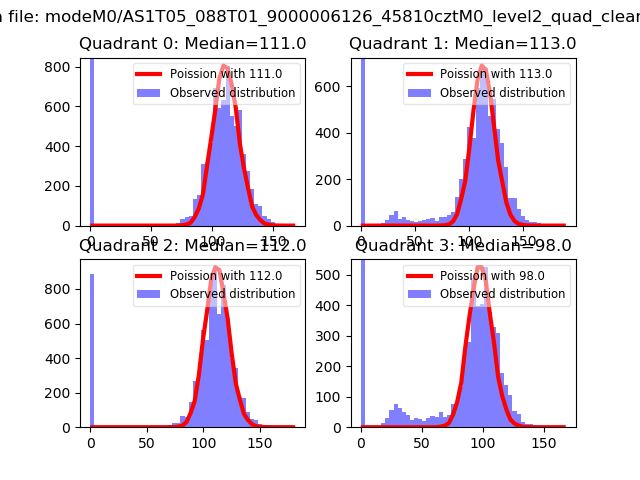 |
 |
| Quadrant-wise count rates Data is divided into 100 sec bins |
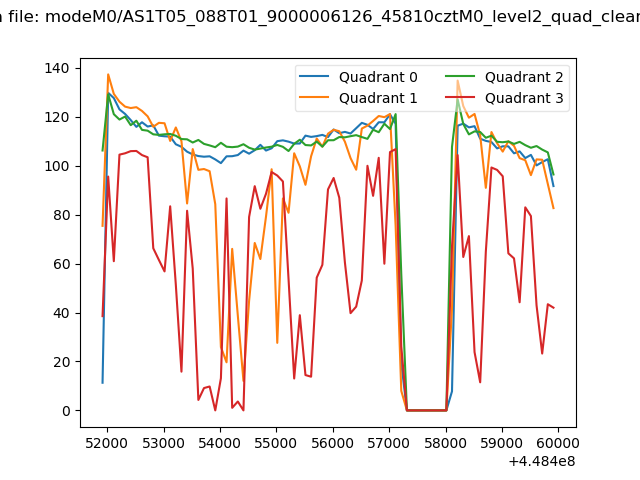 |
|
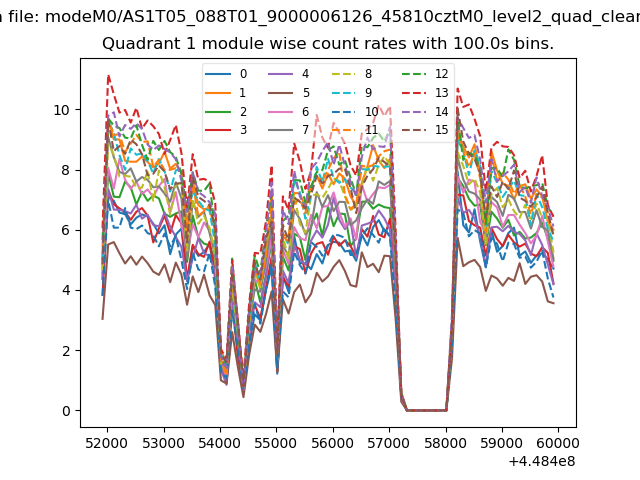
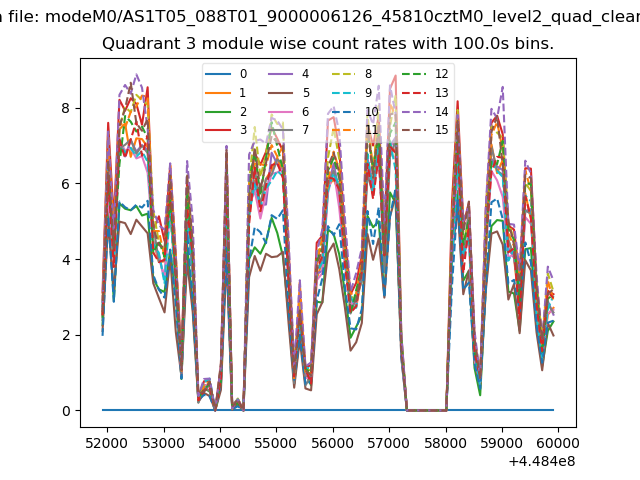
| Module-wise count rates for Quadrant A Data is divided into 100 sec bins |
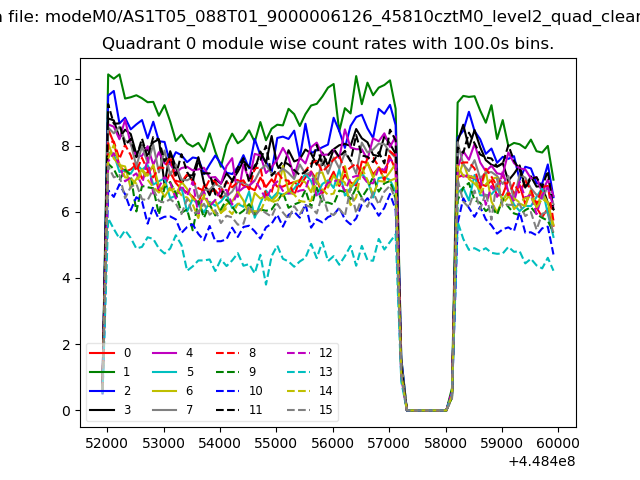 |
 |
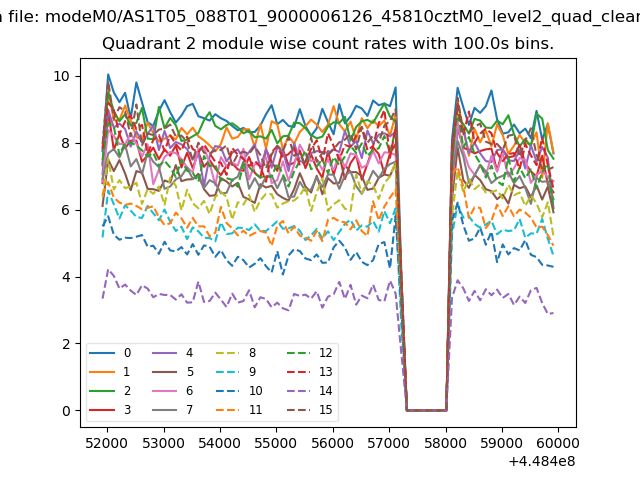
| Module-wise count rates for Quadrant B Data is divided into 100 sec bins |
 |
 |
| Module-wise count rates for Quadrant C Data is divided into 100 sec bins |
 |
 |
| Module-wise count rates for Quadrant D Data is divided into 100 sec bins |
 |
 |
| Parameter | Plot |
|---|---|
| CZT HV Monitor | 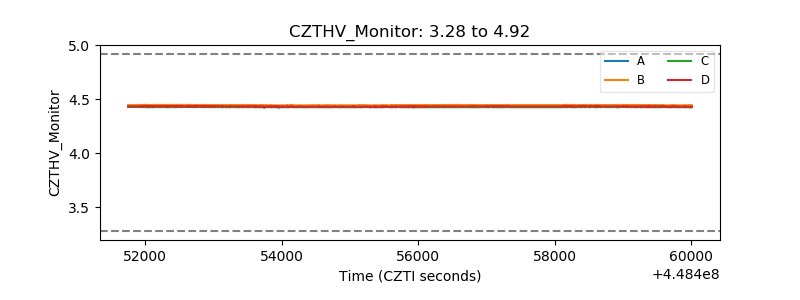 |
| D_VDD | 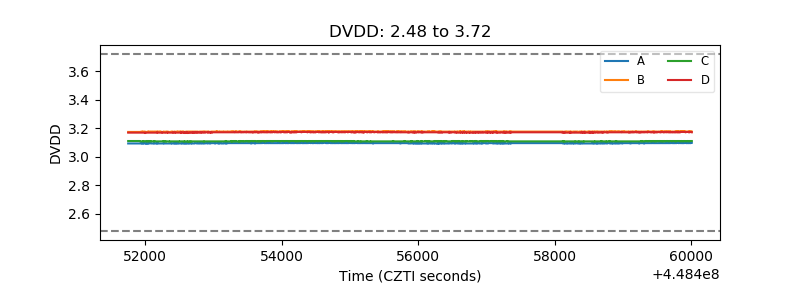 |
| Temperature 1 | 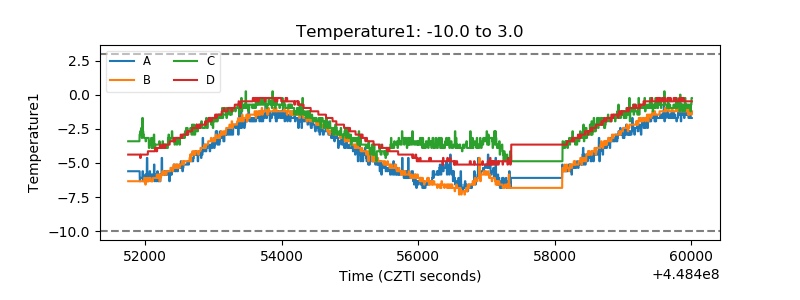 |
| Veto HV Monitor | 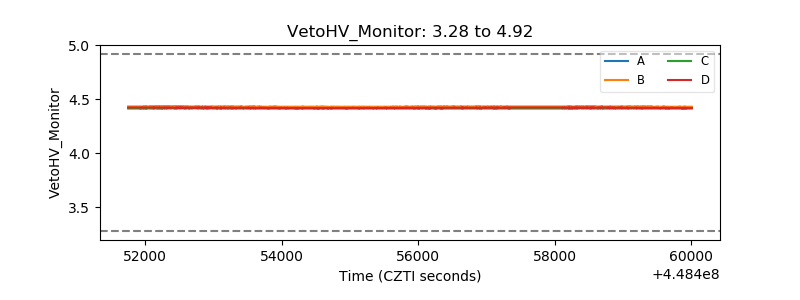 |
| Veto LLD | 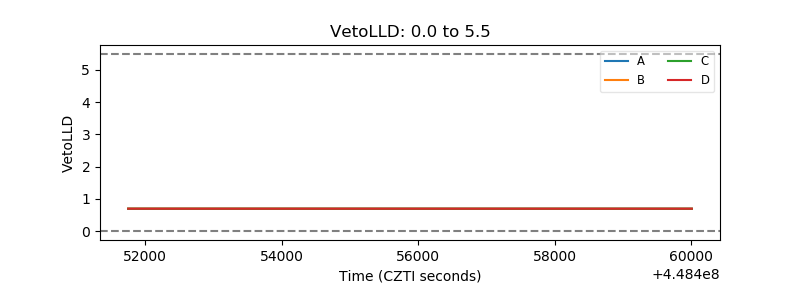 |
| Alpha Counter | 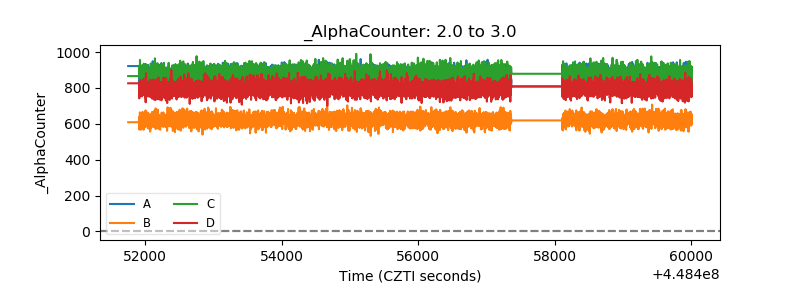 |
| _CPM_Rate | 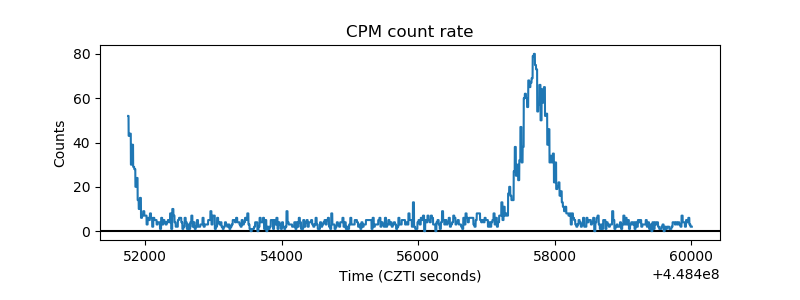 |
| CZT Counter | 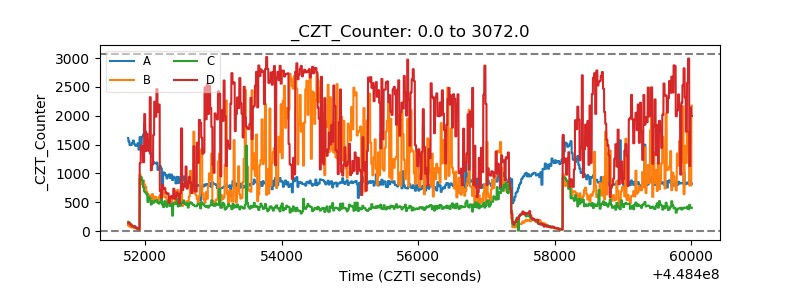 |
| +2.5 Volts monitor | 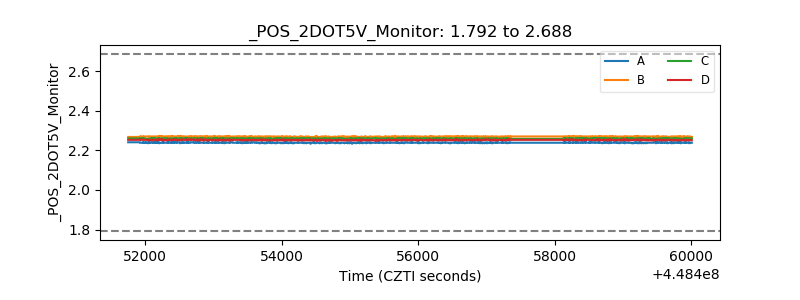 |
| +5 Volts monitor | 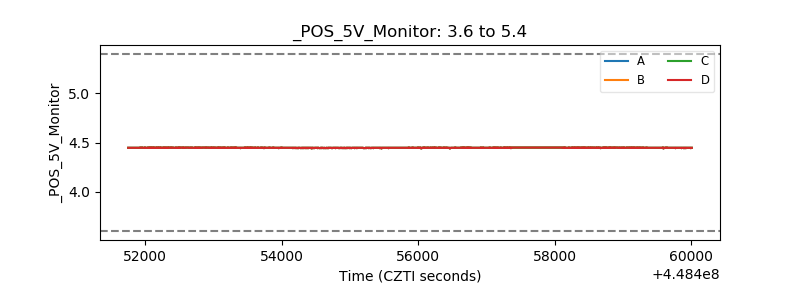 |
| _ROLL_ROT | 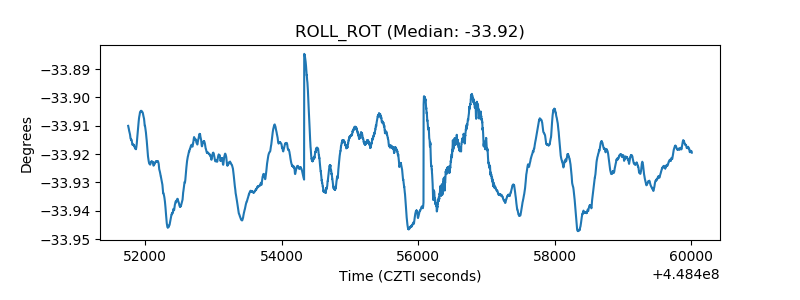 |
| _Roll_DEC | 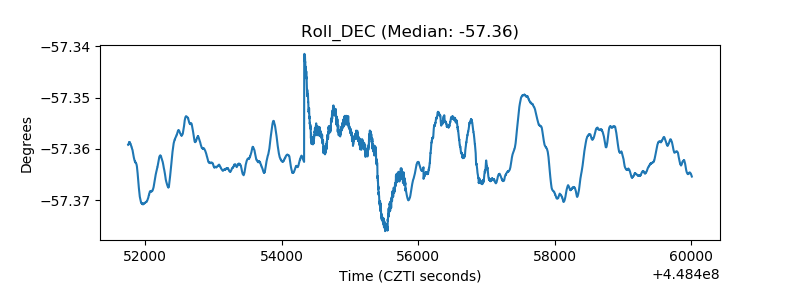 |
| _Roll_RA | 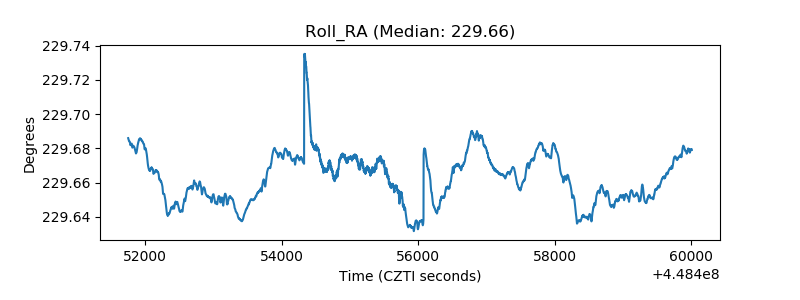 |
| Veto Counter | 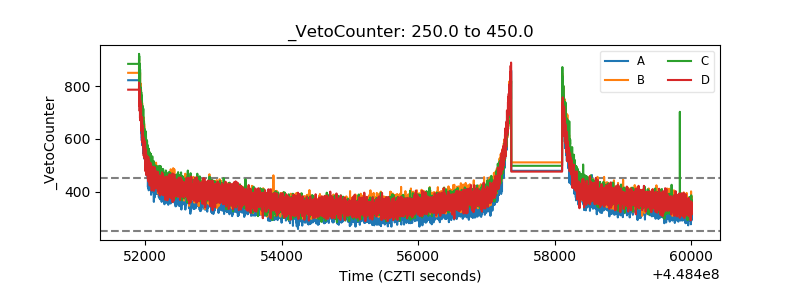 |