| Param | Original file | Final file |
|---|---|---|
| Filename | modeM0/AS1T05_088T01_9000006126_45811cztM0_level2.fits | modeM0/AS1T05_088T01_9000006126_45811cztM0_level2_quad_clean.evt |
| Size (bytes) | 752,679,360 | 116,072,640 |
| Size | 717.8 MB | 110.7 MB |
| Events in quadrant A | 6,750,342 | 784,561 |
| Events in quadrant B | 7,500,450 | 766,281 |
| Events in quadrant C | 3,424,930 | 807,881 |
| Events in quadrant D | 9,601,464 | 629,452 |
| Mode M9 | |||
|---|---|---|---|
| Quadrant | BADHDUFLAG | Total packets | Discarded packets |
| A | 0 | 3 | 0 |
| B | 0 | 3 | 0 |
| C | 0 | 3 | 0 |
| D | 0 | 3 | 0 |
| Mode M0 | |||
|---|---|---|---|
| Quadrant | BADHDUFLAG | Total packets | Discarded packets |
| A | 0 | 24561 | 3 |
| B | 0 | 27530 | 1 |
| C | 0 | 15834 | 1 |
| D | 0 | 33885 | 1 |
| Mode SS | |||
|---|---|---|---|
| Quadrant | BADHDUFLAG | Total packets | Discarded packets |
| A | 0 | 152 | 0 |
| B | 0 | 152 | 0 |
| C | 0 | 152 | 0 |
| D | 0 | 152 | 0 |
| Quadrant | Total seconds | Saturated seconds | Saturation percentage |
|---|---|---|---|
| A | 7567 | 417 | 5.510770% |
| B | 7568 | 970 | 12.817125% |
| C | 7568 | 197 | 2.603066% |
| D | 7568 | 1341 | 17.719345% |
Noise dominated data is calculated using 1-second bins in cleaned event files. If a bin has >2000 counts, and if more than 50% of those come from <1% of pixels, then it is considered to be noise-dominated and hence unusable.
| Quadrant | # 1 sec bins | Bins with >0 counts | Bins with >2000 counts | High rate bins dominated by noise | Noise dominated (total time) | Noise dominated (detector-on time) | Marked lightcurve |
|---|---|---|---|---|---|---|---|
| A | 7837 | 7568 | 45 | 45 | 0.57% | 0.59% | 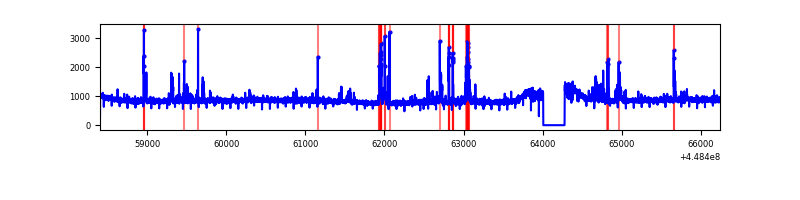 |
| B | 7838 | 7569 | 402 | 402 | 5.13% | 5.31% | 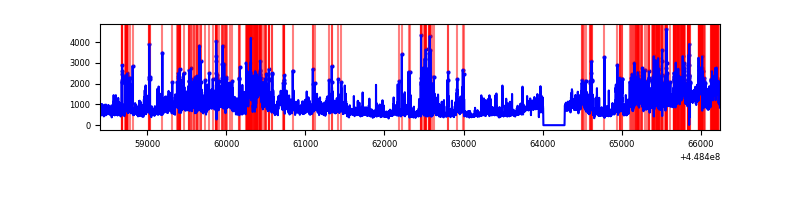 |
| C | 7838 | 7569 | 6 | 6 | 0.08% | 0.08% | 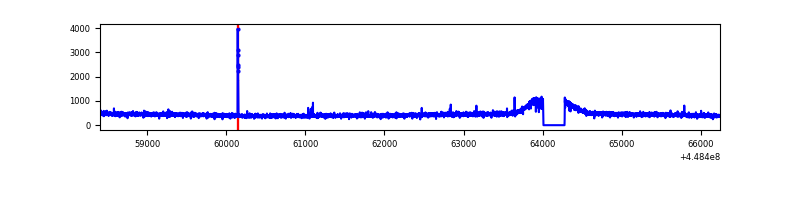 |
| D | 7838 | 7569 | 1088 | 1088 | 13.88% | 14.37% | 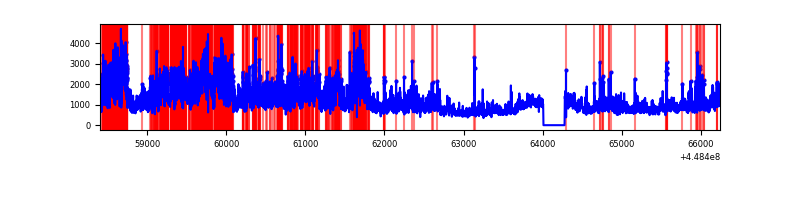 |
Top three noisy pixels from each quadrant. If the there are fewer than three noisy pixels in the level2.evt file, extra rows are filled as -1
| Pixel properties | Quadrant properties | ||||||
|---|---|---|---|---|---|---|---|
| Quadrant | DetID | PixID | Counts | Sigma | Mean | Median | Sigma |
| A | 10 | 83 | 3047497 | 16953.81 | 865 | 842 | 179.7 |
| A | 13 | 248 | 280659 | 1557.11 | 865 | 842 | 179.7 |
| A | 15 | 14 | 31606 | 171.19 | 865 | 842 | 179.7 |
| B | 3 | 112 | 3210422 | 19304.27 | 845 | 818 | 166.3 |
| B | 5 | 172 | 233803 | 1401.3 | 845 | 818 | 166.3 |
| B | 0 | 171 | 223247 | 1337.81 | 845 | 818 | 166.3 |
| C | 0 | 207 | 23883 | 112.55 | 867 | 871 | 204.5 |
| C | 3 | 233 | 14675 | 67.51 | 867 | 871 | 204.5 |
| C | 2 | 14 | 7268 | 31.29 | 867 | 871 | 204.5 |
| D | 11 | 241 | 4175320 | 20004.78 | 823 | 797 | 208.7 |
| D | 1 | 47 | 1148110 | 5498.05 | 823 | 797 | 208.7 |
| D | 12 | 2 | 538036 | 2574.51 | 823 | 797 | 208.7 |
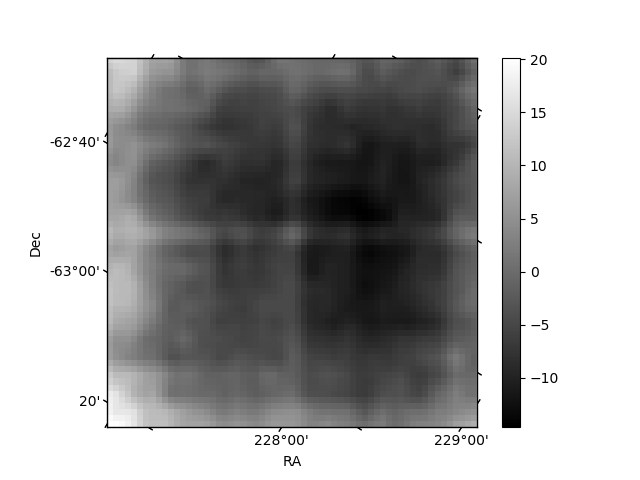
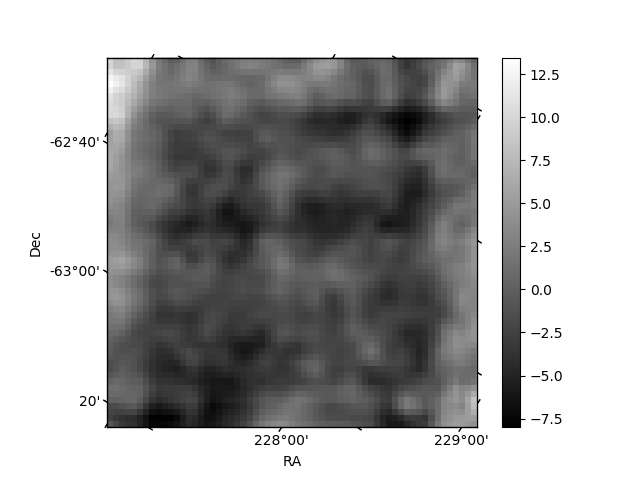
Histogram calculated using DETX and DETY for each event in the final _common_clean file
| Quadrant A | 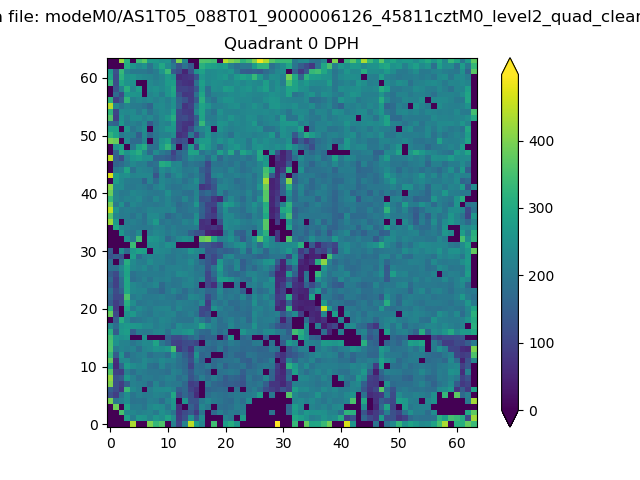 |
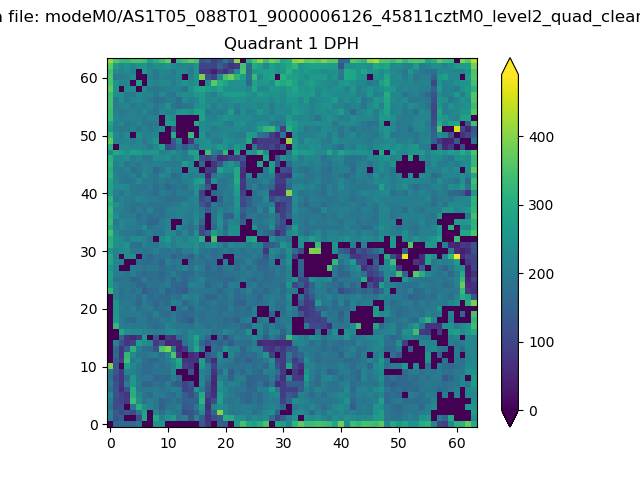 |
Quadrant B |
|---|---|---|---|
| Quadrant D | 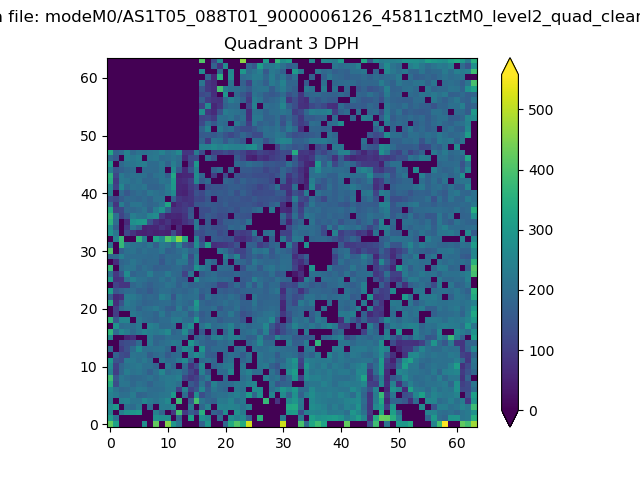 |
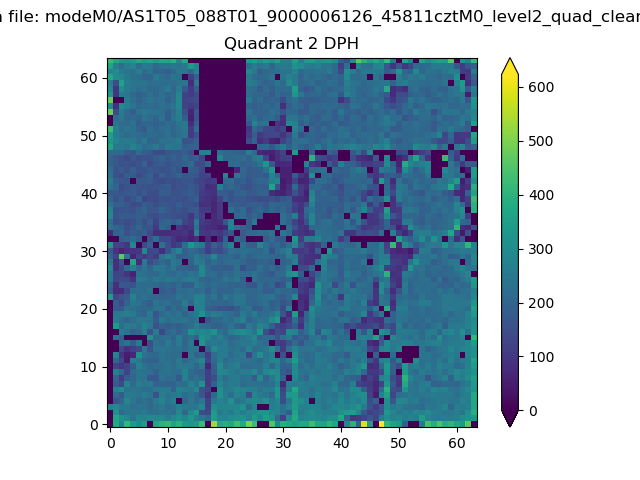 |
Quadrant C |
| Plot type | Count rate plots | Images |
|---|---|---|
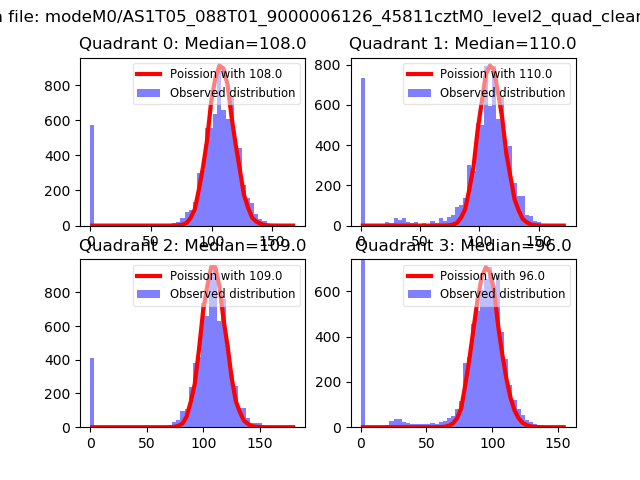
| Comparison with Poisson distribution Blue bars denote a histogram of data divided into 1 sec bins. Red curve is a Poisson curve with rate = median count rate of data. |
 |
 |
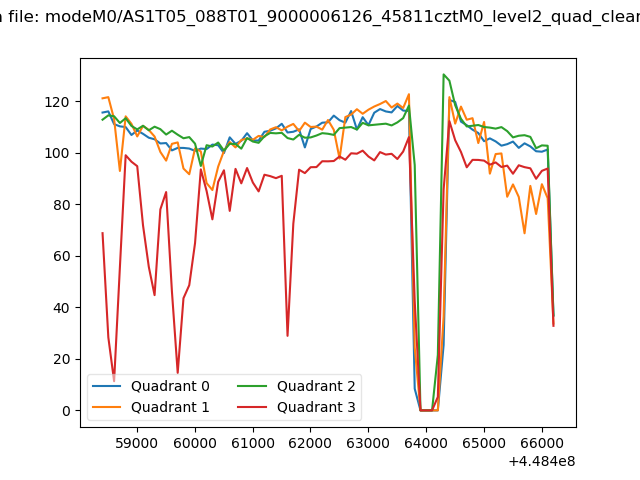
| Quadrant-wise count rates Data is divided into 100 sec bins |
 |
|
| Module-wise count rates for Quadrant A Data is divided into 100 sec bins |
 |
 |
| Module-wise count rates for Quadrant B Data is divided into 100 sec bins |
 |
 |
| Module-wise count rates for Quadrant C Data is divided into 100 sec bins |
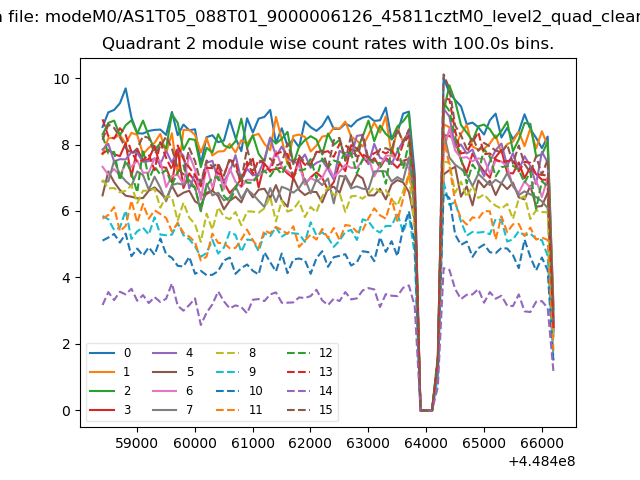 |
 |
| Module-wise count rates for Quadrant D Data is divided into 100 sec bins |
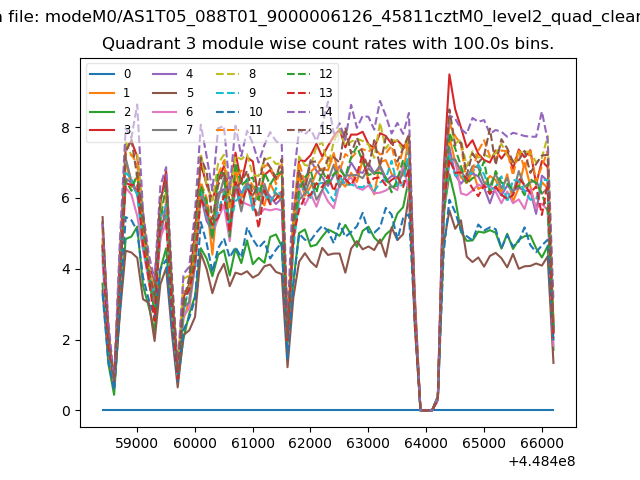 |
 |
| Parameter | Plot |
|---|---|
| CZT HV Monitor | 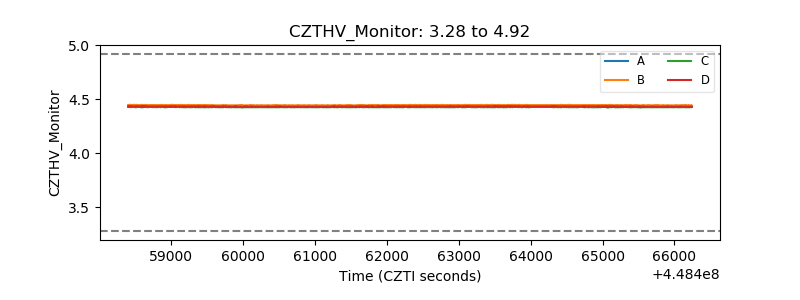 |
| D_VDD | 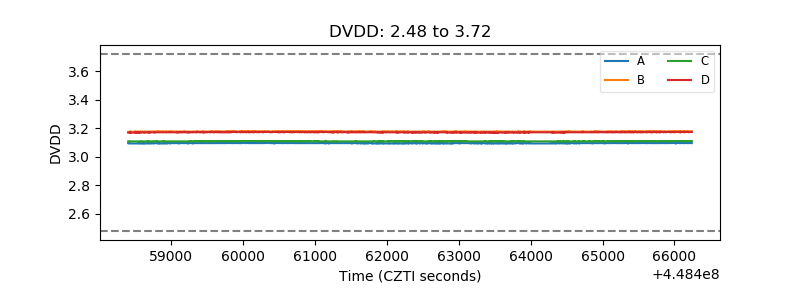 |
| Temperature 1 | 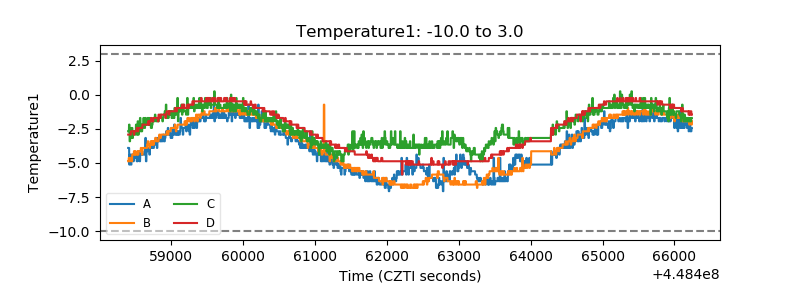 |
| Veto HV Monitor | 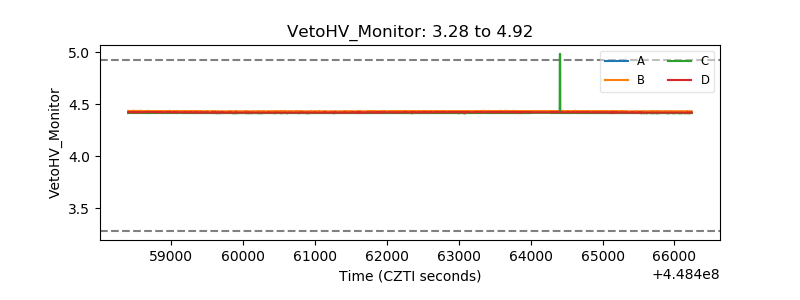 |
| Veto LLD | 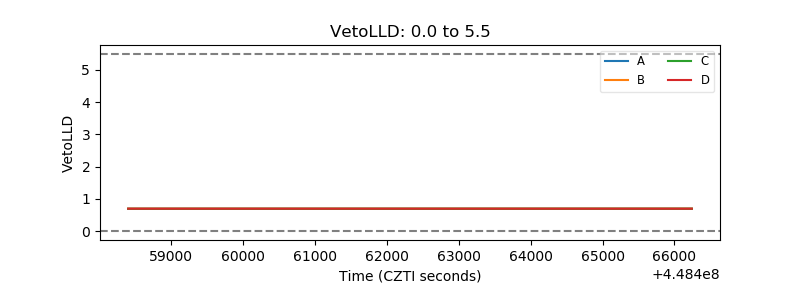 |
| Alpha Counter | 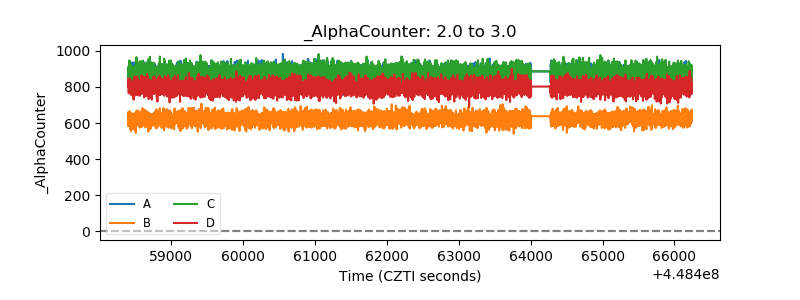 |
| _CPM_Rate | 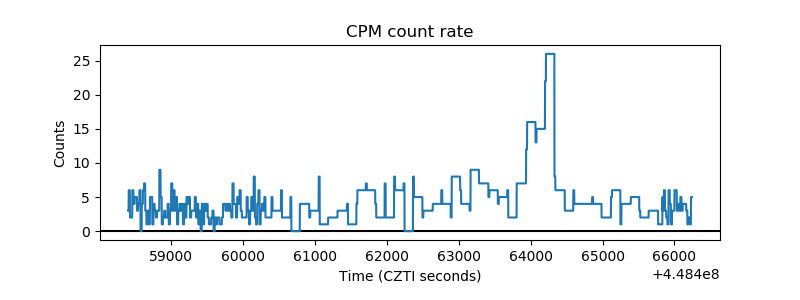 |
| CZT Counter | 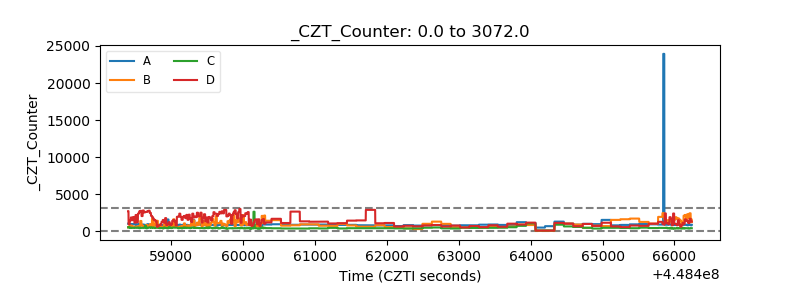 |
| +2.5 Volts monitor | 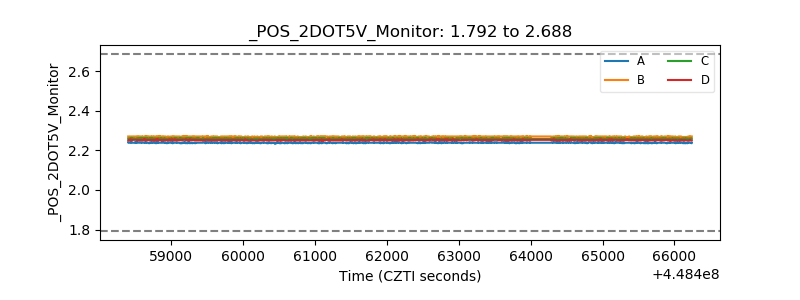 |
| +5 Volts monitor | 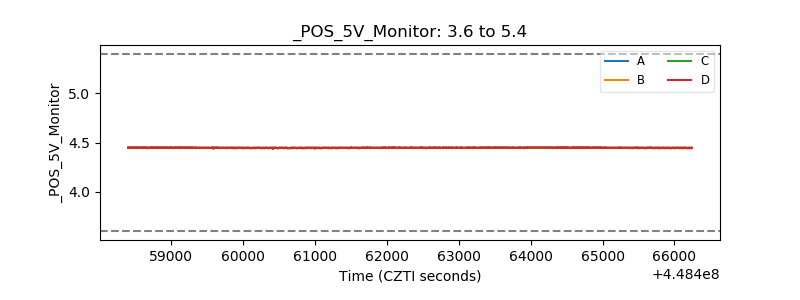 |
| _ROLL_ROT | 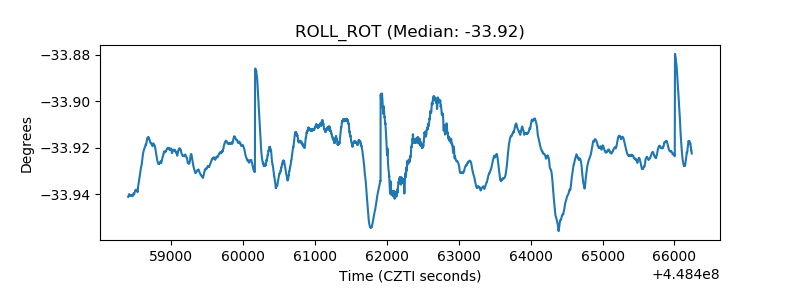 |
| _Roll_DEC | 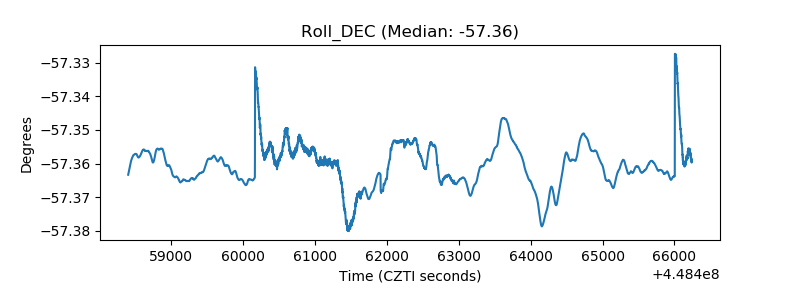 |
| _Roll_RA | 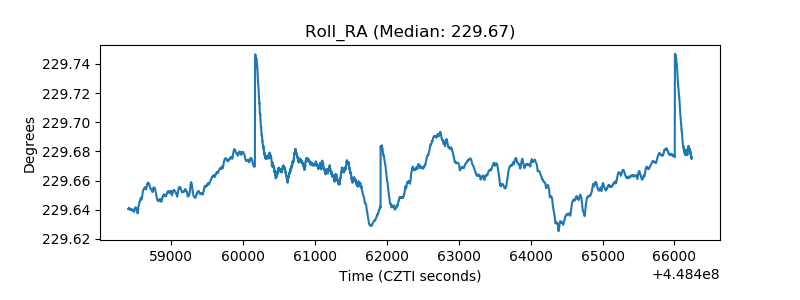 |
| Veto Counter | 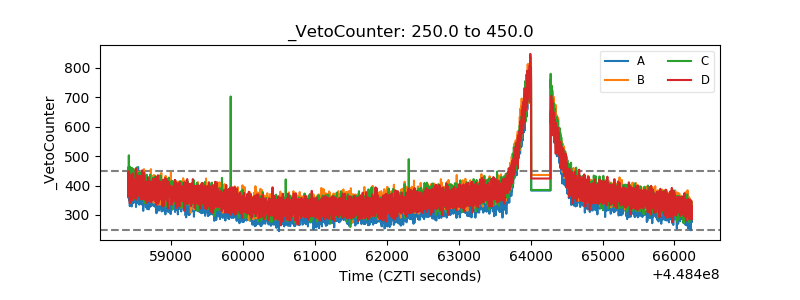 |