| Param | Original file | Final file |
|---|---|---|
| Filename | modeM0/AS1T05_185T01_9000006128_45819cztM0_level2.fits | modeM0/AS1T05_185T01_9000006128_45819cztM0_level2_quad_clean.evt |
| Size (bytes) | 649,054,080 | 104,598,720 |
| Size | 619.0 MB | 99.8 MB |
| Events in quadrant A | 5,938,356 | 733,574 |
| Events in quadrant B | 4,416,647 | 767,538 |
| Events in quadrant C | 3,034,276 | 737,032 |
| Events in quadrant D | 10,111,992 | 456,698 |
| Mode SS | |||
|---|---|---|---|
| Quadrant | BADHDUFLAG | Total packets | Discarded packets |
| A | 0 | 138 | 0 |
| B | 0 | 138 | 0 |
| C | 0 | 138 | 0 |
| D | 0 | 138 | 0 |
| Mode M0 | |||
|---|---|---|---|
| Quadrant | BADHDUFLAG | Total packets | Discarded packets |
| A | 0 | 22312 | 2 |
| B | 0 | 17840 | 2 |
| C | 0 | 13913 | 2 |
| D | 0 | 34715 | 2 |
| Mode M9 | |||
|---|---|---|---|
| Quadrant | BADHDUFLAG | Total packets | Discarded packets |
| A | 0 | 10 | 0 |
| B | 0 | 11 | 0 |
| C | 0 | 11 | 0 |
| D | 0 | 11 | 0 |
| Quadrant | Total seconds | Saturated seconds | Saturation percentage |
|---|---|---|---|
| A | 6771 | 176 | 2.599321% |
| B | 6771 | 128 | 1.890415% |
| C | 6771 | 31 | 0.457835% |
| D | 6771 | 2393 | 35.341899% |
Noise dominated data is calculated using 1-second bins in cleaned event files. If a bin has >2000 counts, and if more than 50% of those come from <1% of pixels, then it is considered to be noise-dominated and hence unusable.
| Quadrant | # 1 sec bins | Bins with >0 counts | Bins with >2000 counts | High rate bins dominated by noise | Noise dominated (total time) | Noise dominated (detector-on time) | Marked lightcurve |
|---|---|---|---|---|---|---|---|
| A | 7771 | 6772 | 29 | 29 | 0.37% | 0.43% | 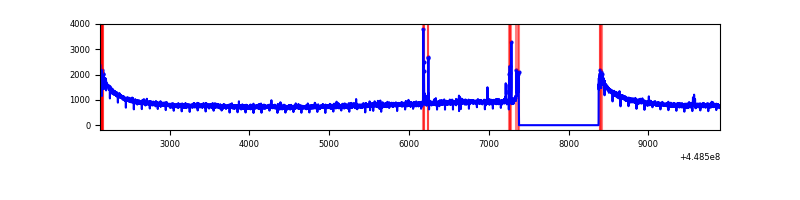 |
| B | 7771 | 6772 | 44 | 44 | 0.57% | 0.65% | 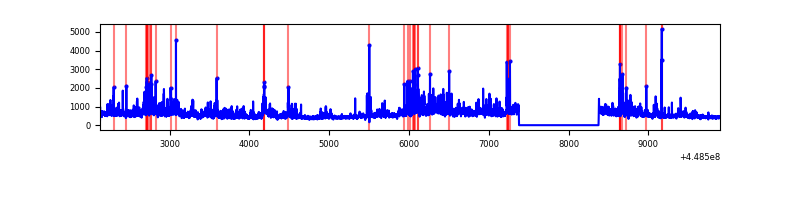 |
| C | 7771 | 6772 | 15 | 15 | 0.19% | 0.22% | 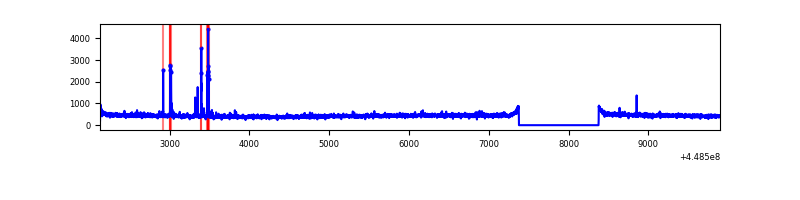 |
| D | 7771 | 6772 | 2027 | 2027 | 26.08% | 29.93% | 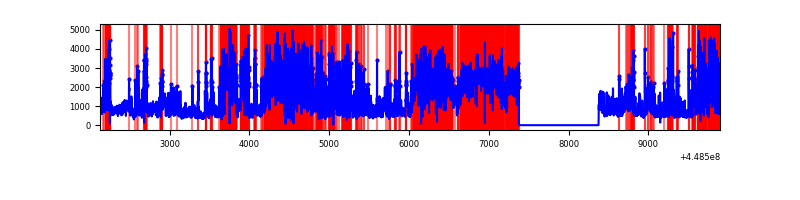 |
Top three noisy pixels from each quadrant. If the there are fewer than three noisy pixels in the level2.evt file, extra rows are filled as -1
| Pixel properties | Quadrant properties | ||||||
|---|---|---|---|---|---|---|---|
| Quadrant | DetID | PixID | Counts | Sigma | Mean | Median | Sigma |
| A | 10 | 83 | 2950910 | 19022.72 | 747 | 730 | 155.1 |
| A | 15 | 14 | 40319 | 255.27 | 747 | 730 | 155.1 |
| A | 4 | 0 | 25389 | 159.0 | 747 | 730 | 155.1 |
| B | 3 | 112 | 863284 | 5794.19 | 756 | 733 | 148.9 |
| B | 0 | 171 | 296597 | 1987.47 | 756 | 733 | 148.9 |
| B | 4 | 171 | 106757 | 712.22 | 756 | 733 | 148.9 |
| C | 12 | 250 | 60854 | 341.68 | 750 | 753 | 175.9 |
| C | 2 | 14 | 34852 | 193.86 | 750 | 753 | 175.9 |
| C | 3 | 233 | 12989 | 69.56 | 750 | 753 | 175.9 |
| D | 11 | 241 | 2118375 | 13599.68 | 613 | 595 | 155.7 |
| D | 12 | 2 | 2007370 | 12886.85 | 613 | 595 | 155.7 |
| D | 1 | 47 | 1657468 | 10639.89 | 613 | 595 | 155.7 |
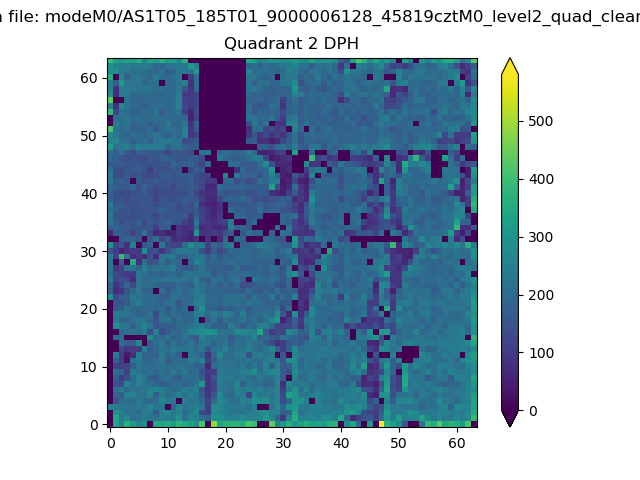
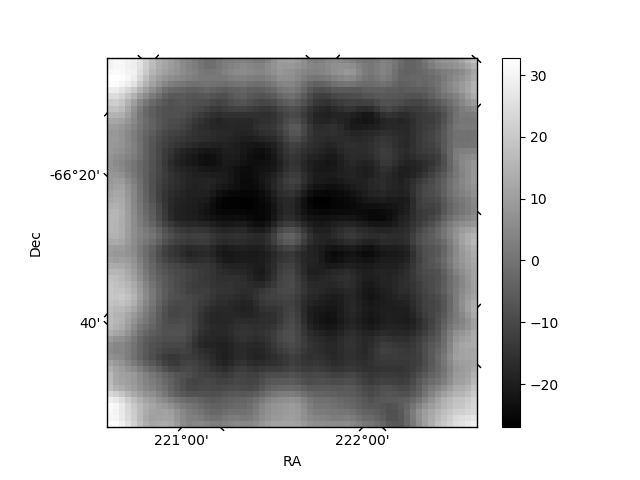
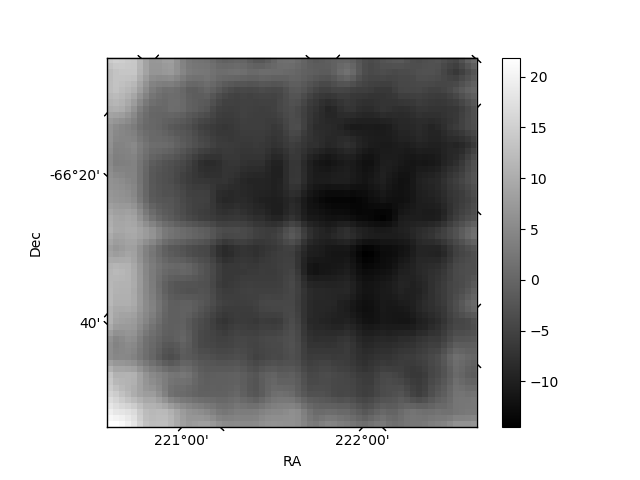
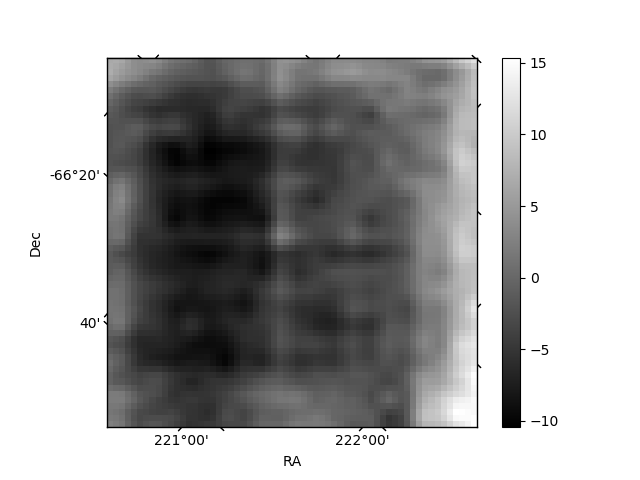
Histogram calculated using DETX and DETY for each event in the final _common_clean file
| Quadrant A | 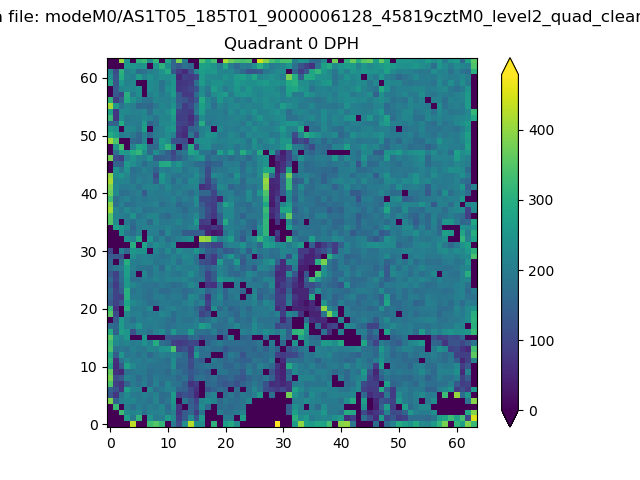 |
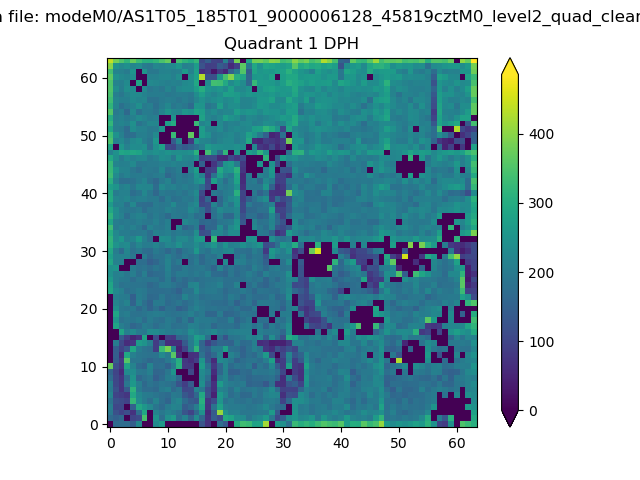 |
Quadrant B |
|---|---|---|---|
| Quadrant D | 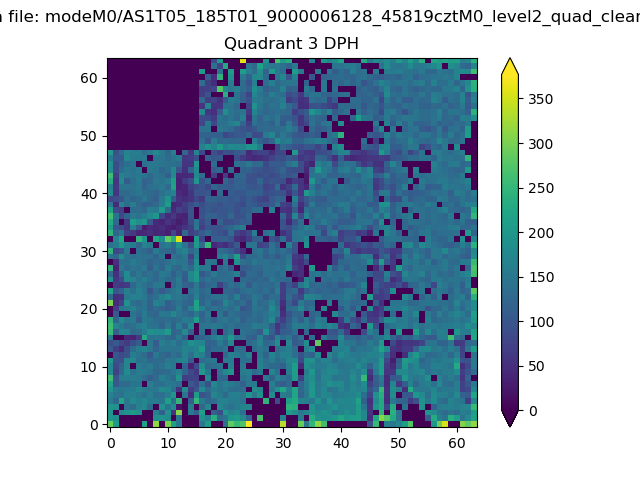 |
 |
Quadrant C |
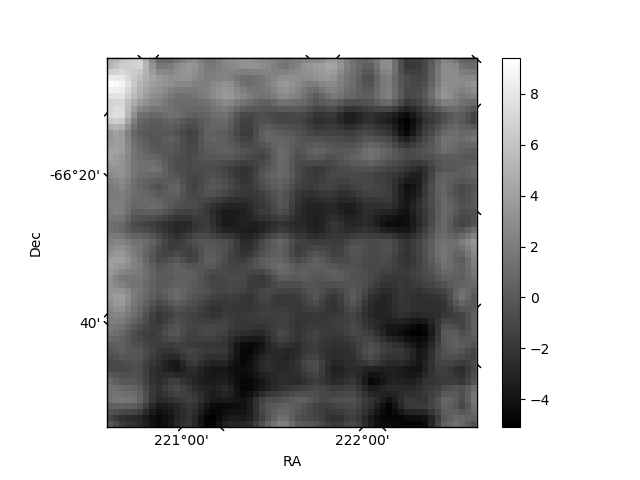
| Plot type | Count rate plots | Images |
|---|---|---|
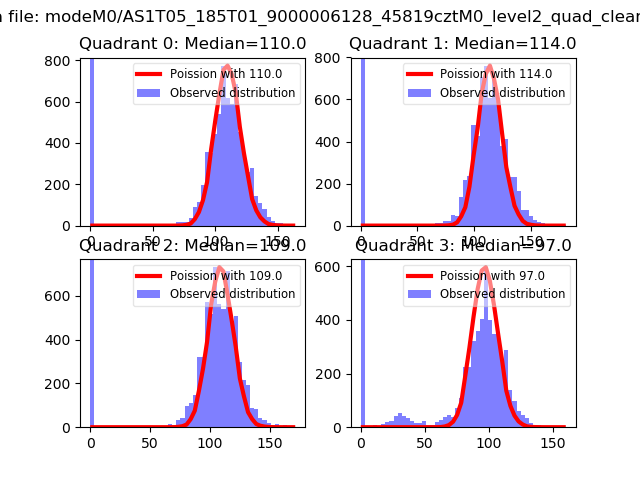
| Comparison with Poisson distribution Blue bars denote a histogram of data divided into 1 sec bins. Red curve is a Poisson curve with rate = median count rate of data. |
 |
 |
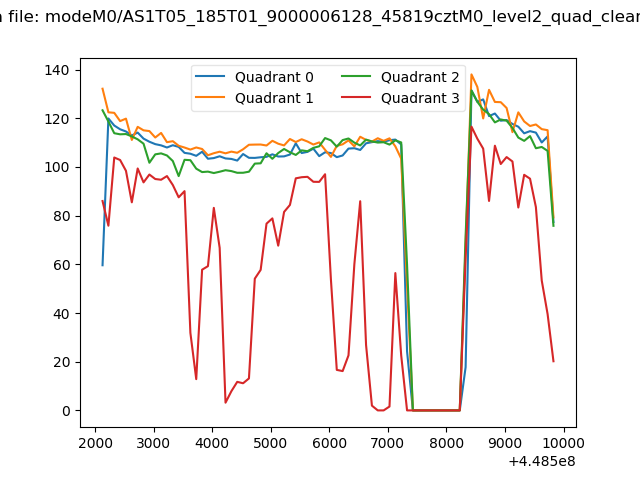
| Quadrant-wise count rates Data is divided into 100 sec bins |
 |
|
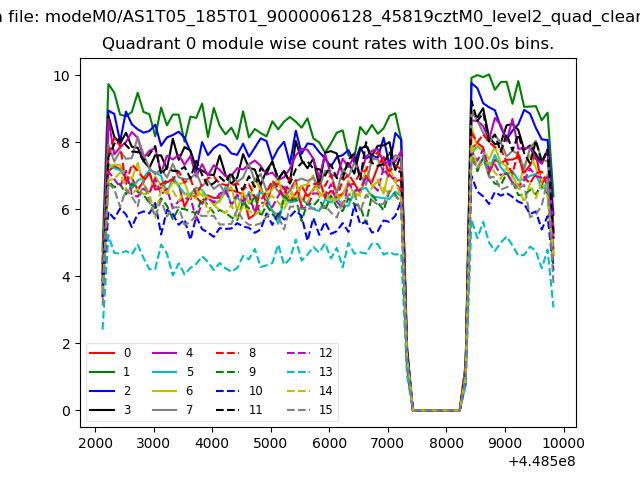
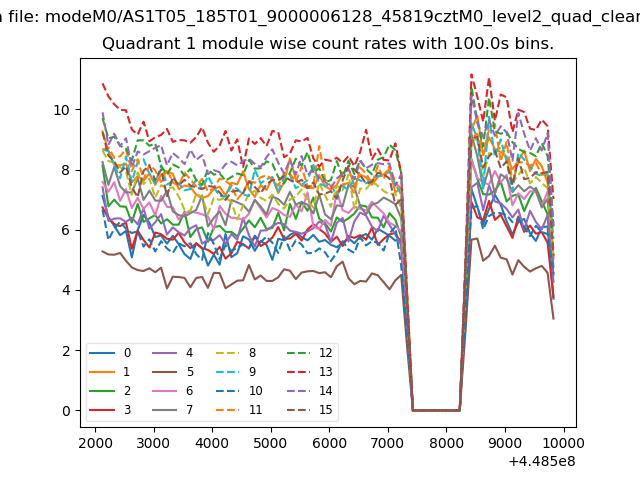
| Module-wise count rates for Quadrant A Data is divided into 100 sec bins |
 |
 |
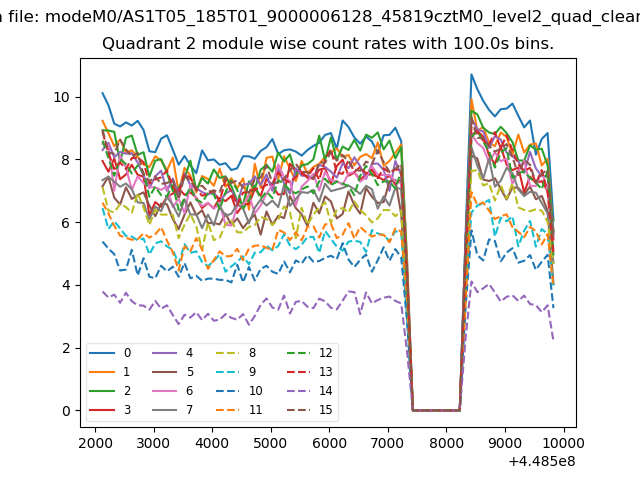
| Module-wise count rates for Quadrant B Data is divided into 100 sec bins |
 |
 |
| Module-wise count rates for Quadrant C Data is divided into 100 sec bins |
 |
 |
| Module-wise count rates for Quadrant D Data is divided into 100 sec bins |
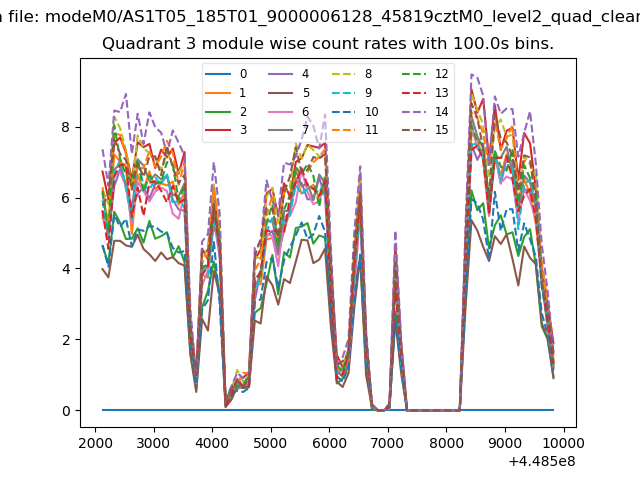 |
 |
| Parameter | Plot |
|---|---|
| CZT HV Monitor | 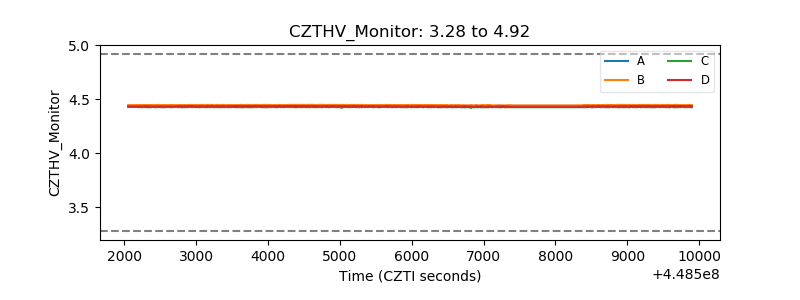 |
| D_VDD | 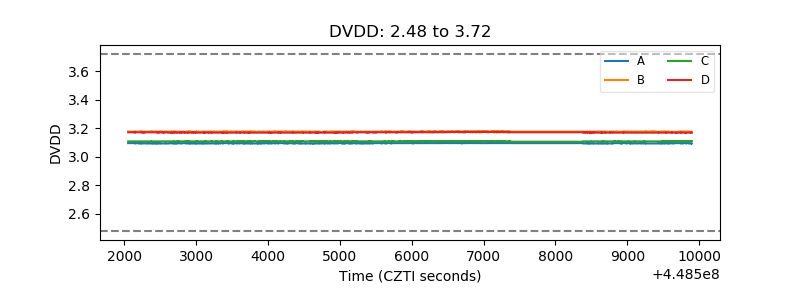 |
| Temperature 1 | 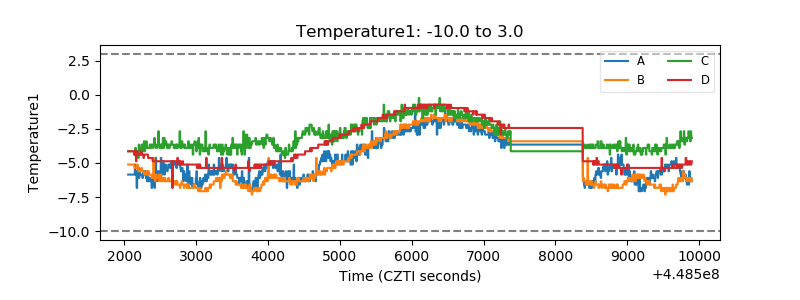 |
| Veto HV Monitor | 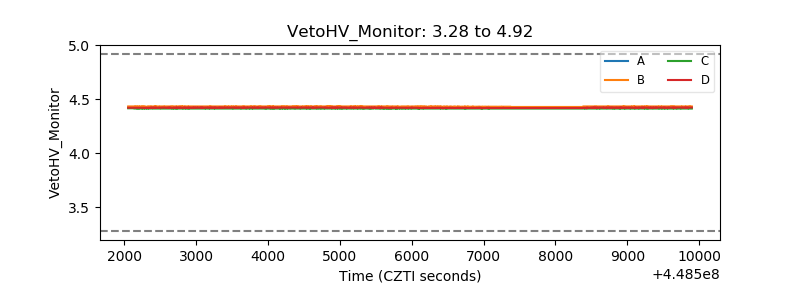 |
| Veto LLD | 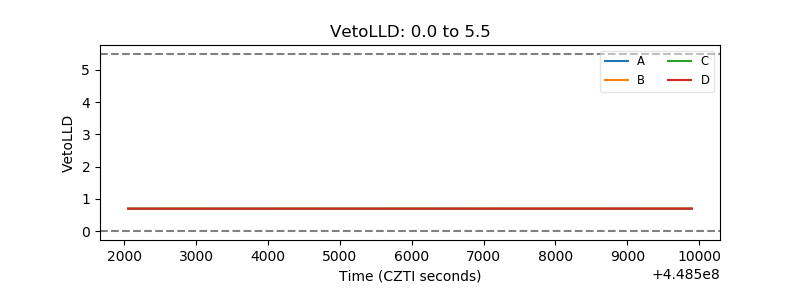 |
| Alpha Counter | 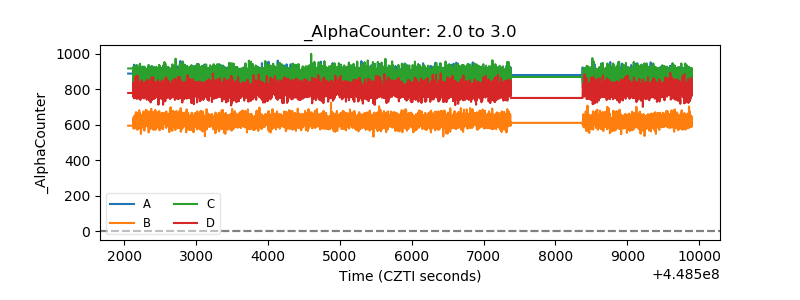 |
| _CPM_Rate | 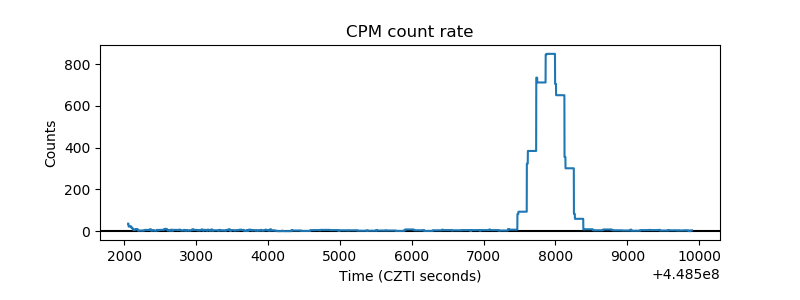 |
| CZT Counter |  |
| +2.5 Volts monitor | 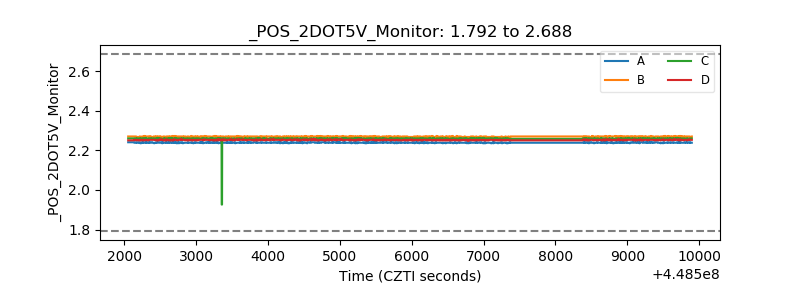 |
| +5 Volts monitor | 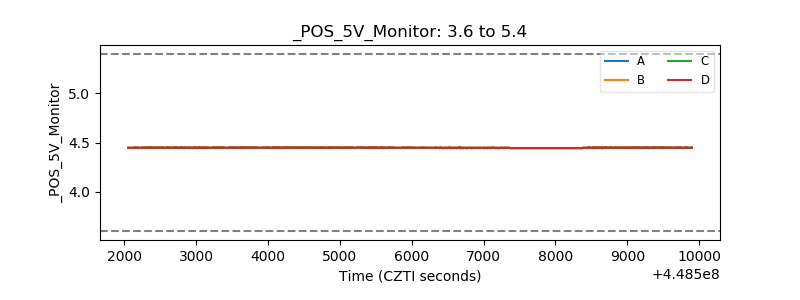 |
| _ROLL_ROT | 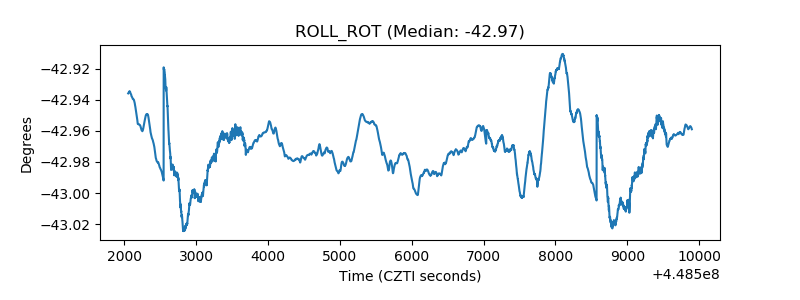 |
| _Roll_DEC | 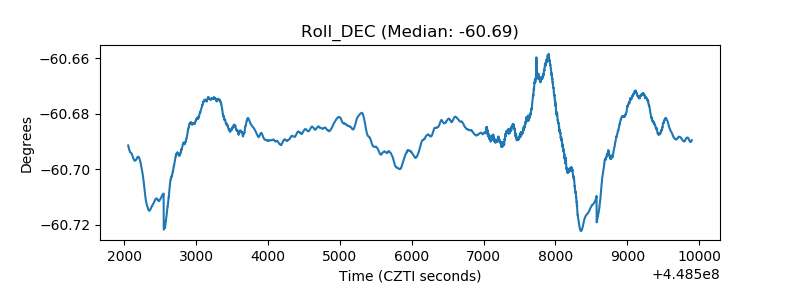 |
| _Roll_RA | 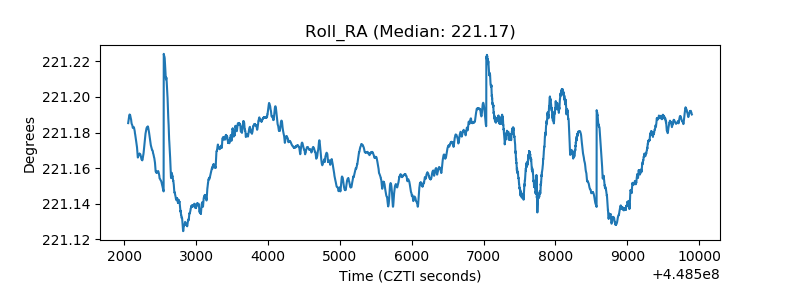 |
| Veto Counter | 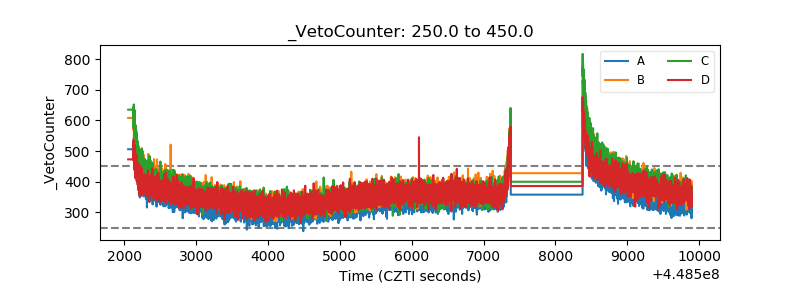 |