| Param | Original file | Final file |
|---|---|---|
| Filename | modeM0/AS1T05_185T01_9000006128_45820cztM0_level2.fits | modeM0/AS1T05_185T01_9000006128_45820cztM0_level2_quad_clean.evt |
| Size (bytes) | 564,321,600 | 97,709,760 |
| Size | 538.2 MB | 93.2 MB |
| Events in quadrant A | 5,588,591 | 673,904 |
| Events in quadrant B | 4,351,081 | 690,847 |
| Events in quadrant C | 2,851,040 | 683,279 |
| Events in quadrant D | 7,625,728 | 484,919 |
| Mode SS | |||
|---|---|---|---|
| Quadrant | BADHDUFLAG | Total packets | Discarded packets |
| A | 0 | 122 | 0 |
| B | 0 | 122 | 0 |
| C | 0 | 122 | 0 |
| D | 0 | 122 | 0 |
| Mode M0 | |||
|---|---|---|---|
| Quadrant | BADHDUFLAG | Total packets | Discarded packets |
| A | 0 | 20660 | 1 |
| B | 0 | 17011 | 1 |
| C | 0 | 12734 | 1 |
| D | 0 | 26773 | 1 |
| Mode M9 | |||
|---|---|---|---|
| Quadrant | BADHDUFLAG | Total packets | Discarded packets |
| A | 0 | 12 | 0 |
| B | 0 | 12 | 0 |
| C | 0 | 12 | 0 |
| D | 0 | 12 | 0 |
| Quadrant | Total seconds | Saturated seconds | Saturation percentage |
|---|---|---|---|
| A | 6099 | 224 | 3.672733% |
| B | 6099 | 334 | 5.476308% |
| C | 6099 | 42 | 0.688637% |
| D | 6099 | 1537 | 25.200853% |
Noise dominated data is calculated using 1-second bins in cleaned event files. If a bin has >2000 counts, and if more than 50% of those come from <1% of pixels, then it is considered to be noise-dominated and hence unusable.
| Quadrant | # 1 sec bins | Bins with >0 counts | Bins with >2000 counts | High rate bins dominated by noise | Noise dominated (total time) | Noise dominated (detector-on time) | Marked lightcurve |
|---|---|---|---|---|---|---|---|
| A | 7219 | 6100 | 123 | 123 | 1.70% | 2.02% | 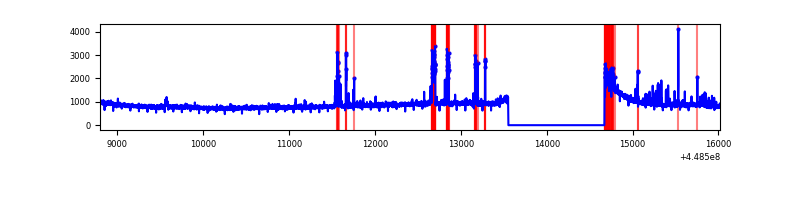 |
| B | 7219 | 6100 | 163 | 163 | 2.26% | 2.67% | 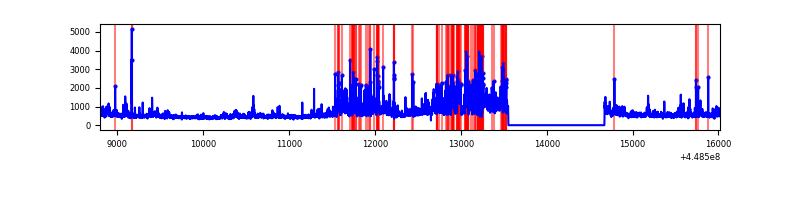 |
| C | 7219 | 6100 | 6 | 6 | 0.08% | 0.10% | 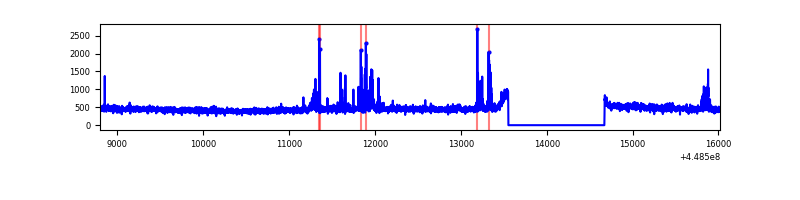 |
| D | 7219 | 6100 | 1317 | 1317 | 18.24% | 21.59% | 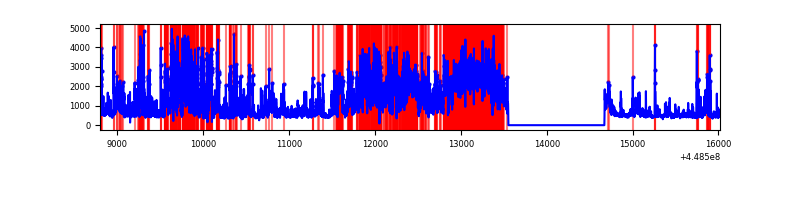 |
Top three noisy pixels from each quadrant. If the there are fewer than three noisy pixels in the level2.evt file, extra rows are filled as -1
| Pixel properties | Quadrant properties | ||||||
|---|---|---|---|---|---|---|---|
| Quadrant | DetID | PixID | Counts | Sigma | Mean | Median | Sigma |
| A | 10 | 83 | 2579128 | 18319.02 | 679 | 666 | 140.8 |
| A | 15 | 14 | 189430 | 1341.1 | 679 | 666 | 140.8 |
| A | 13 | 248 | 168633 | 1193.34 | 679 | 666 | 140.8 |
| B | 3 | 112 | 1068437 | 8067.6 | 679 | 659 | 132.4 |
| B | 0 | 171 | 275035 | 2073.05 | 679 | 659 | 132.4 |
| B | 4 | 171 | 129133 | 970.69 | 679 | 659 | 132.4 |
| C | 2 | 14 | 143408 | 881.24 | 690 | 694 | 161.9 |
| C | 3 | 233 | 13696 | 80.29 | 690 | 694 | 161.9 |
| C | 13 | 61 | 4742 | 25.0 | 690 | 694 | 161.9 |
| D | 13 | 249 | 1733479 | 11050.0 | 613 | 593 | 156.8 |
| D | 11 | 241 | 1615614 | 10298.42 | 613 | 593 | 156.8 |
| D | 12 | 2 | 1448793 | 9234.66 | 613 | 593 | 156.8 |
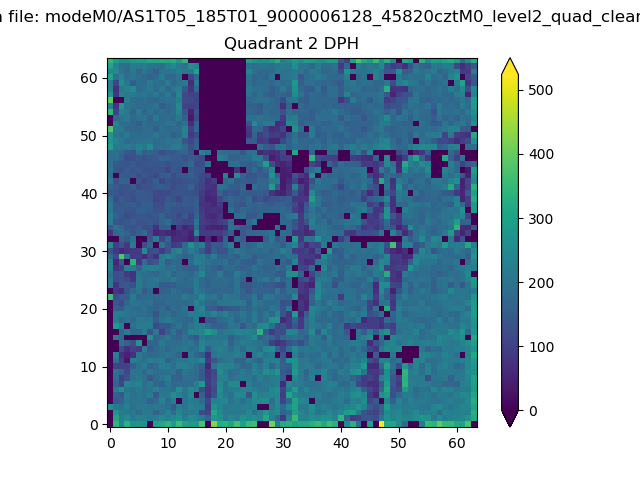
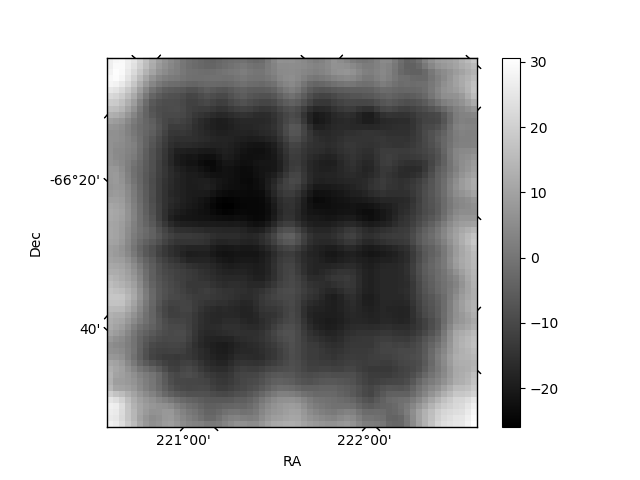
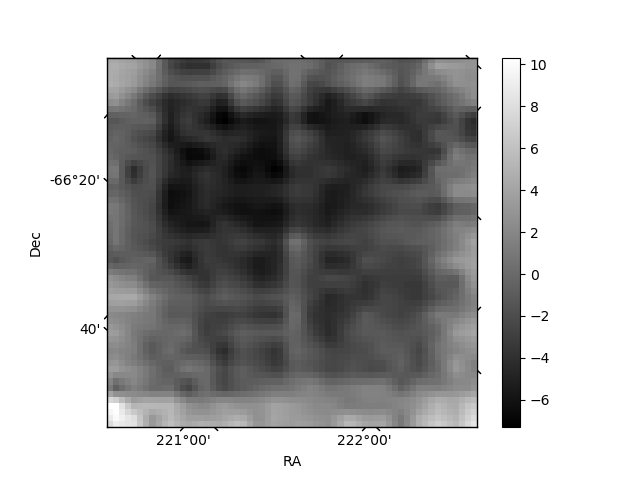
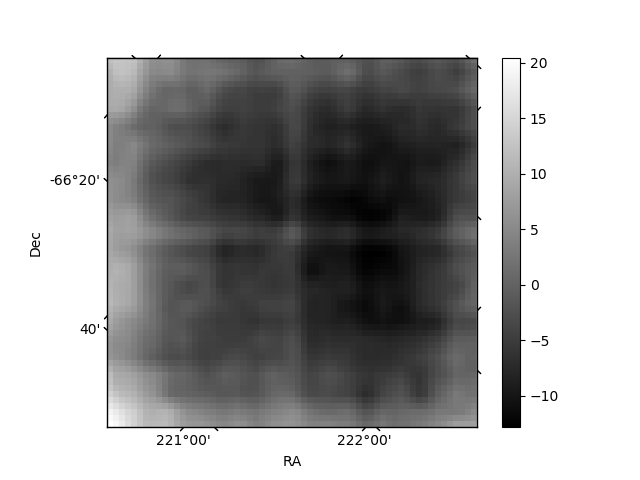
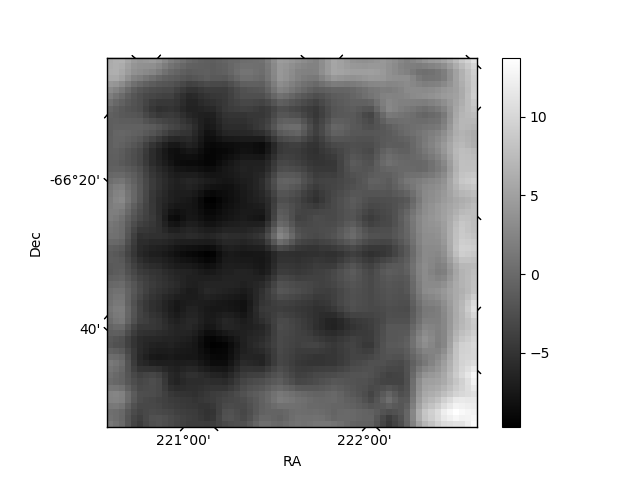
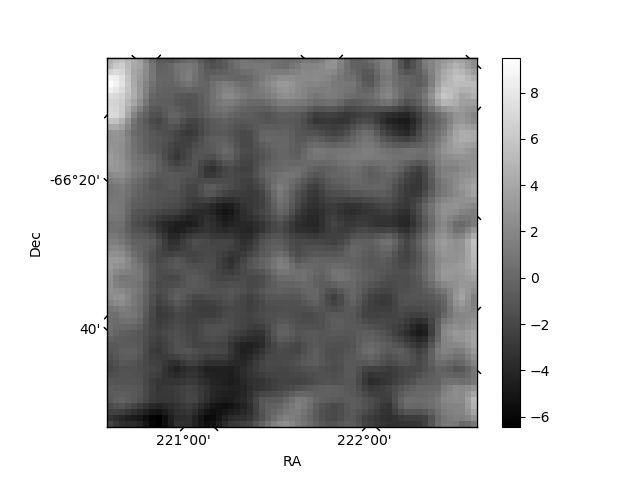
Histogram calculated using DETX and DETY for each event in the final _common_clean file
| Quadrant A | 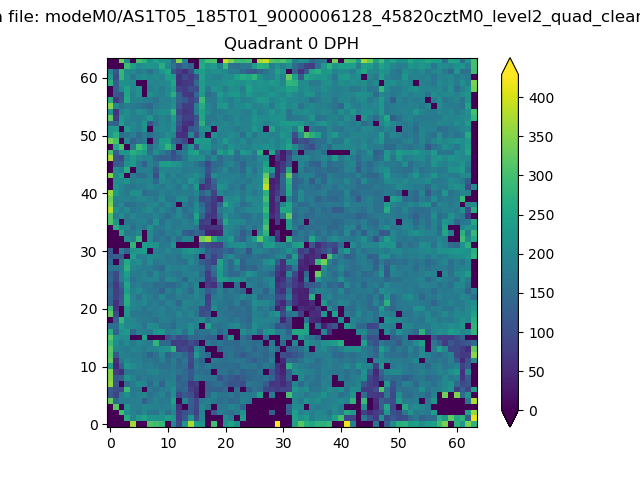 |
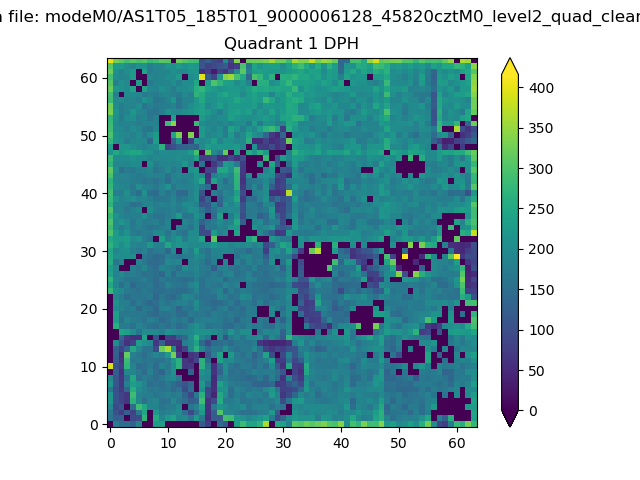 |
Quadrant B |
|---|---|---|---|
| Quadrant D | 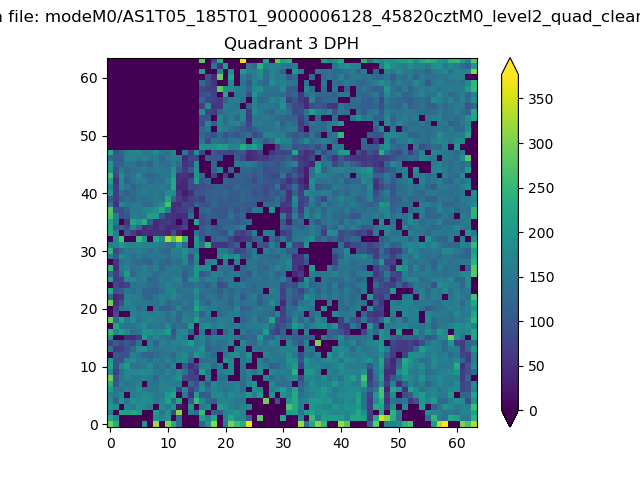 |
 |
Quadrant C |
| Plot type | Count rate plots | Images |
|---|---|---|
| Comparison with Poisson distribution Blue bars denote a histogram of data divided into 1 sec bins. Red curve is a Poisson curve with rate = median count rate of data. |
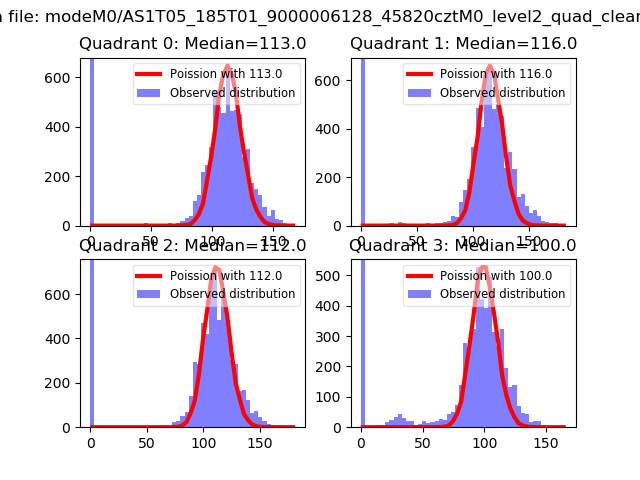 |
 |
| Quadrant-wise count rates Data is divided into 100 sec bins |
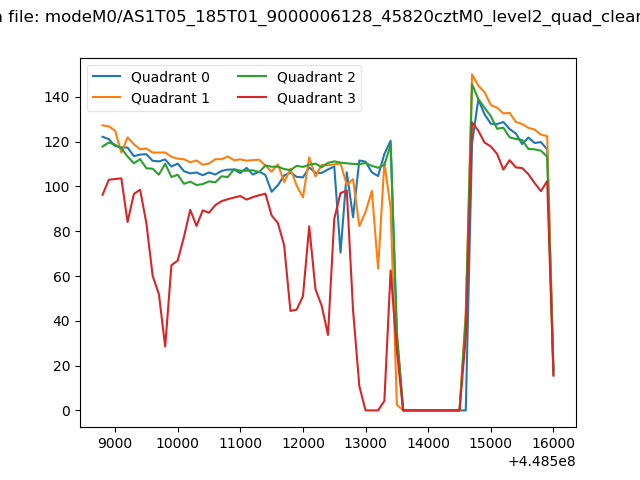 |
|
| Module-wise count rates for Quadrant A Data is divided into 100 sec bins |
 |
 |
| Module-wise count rates for Quadrant B Data is divided into 100 sec bins |
 |
 |
| Module-wise count rates for Quadrant C Data is divided into 100 sec bins |
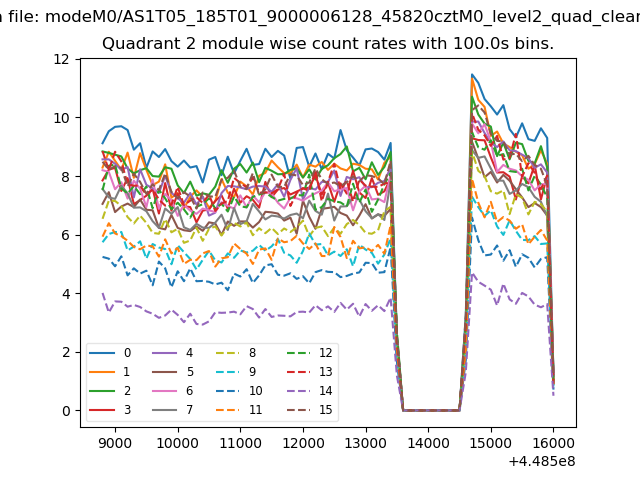 |
 |
| Module-wise count rates for Quadrant D Data is divided into 100 sec bins |
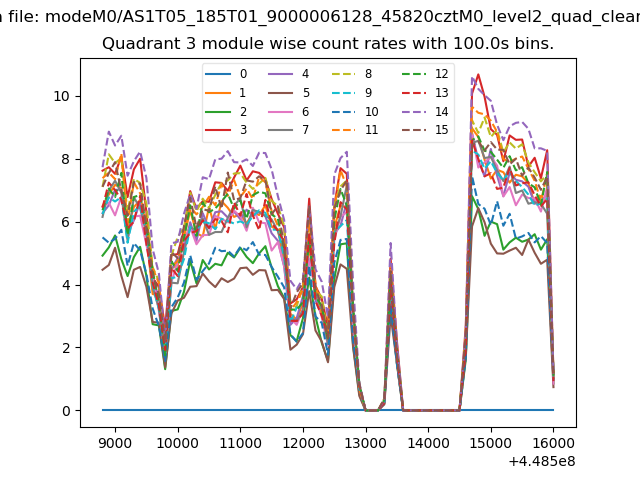 |
 |
| Parameter | Plot |
|---|---|
| CZT HV Monitor | 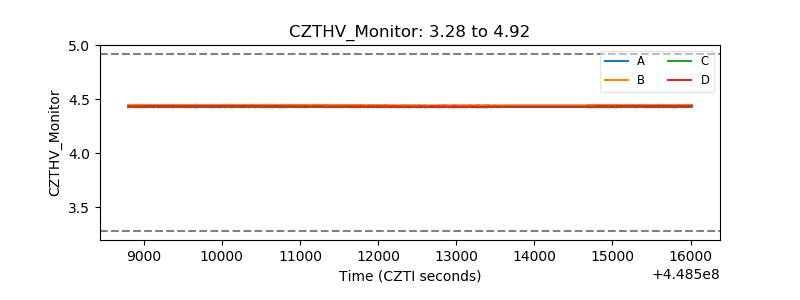 |
| D_VDD | 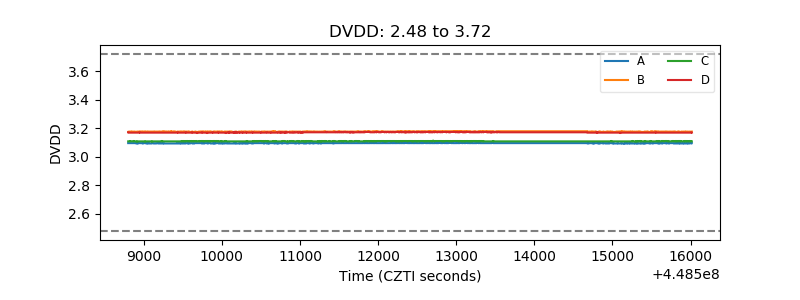 |
| Temperature 1 | 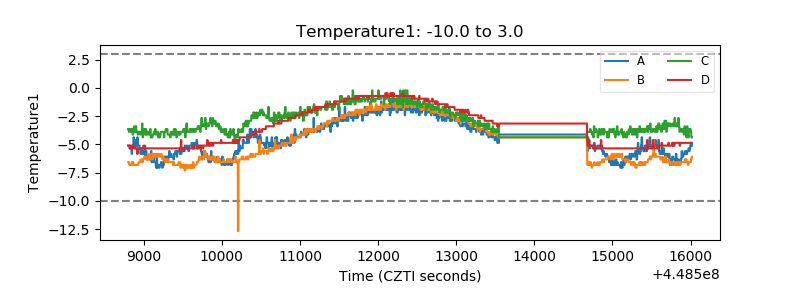 |
| Veto HV Monitor | 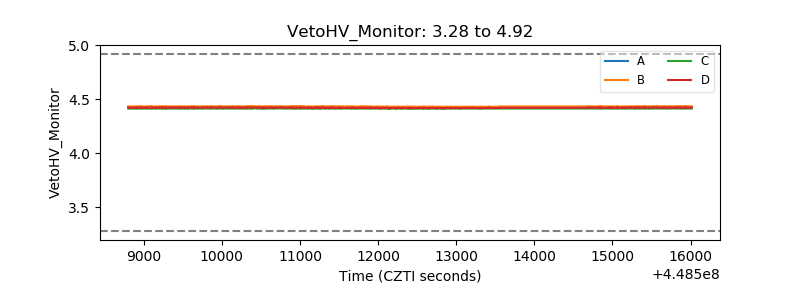 |
| Veto LLD | 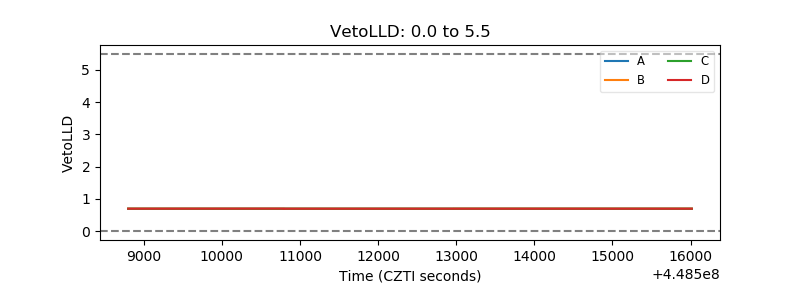 |
| Alpha Counter | 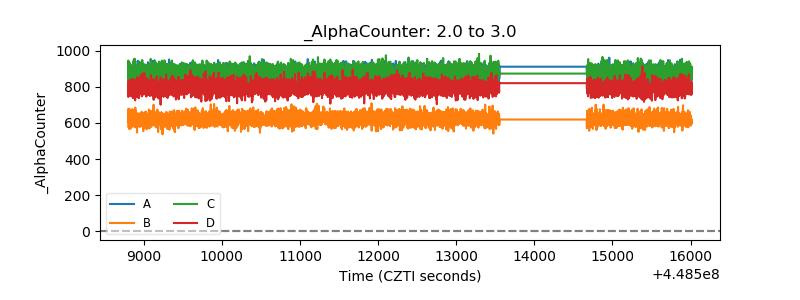 |
| _CPM_Rate | 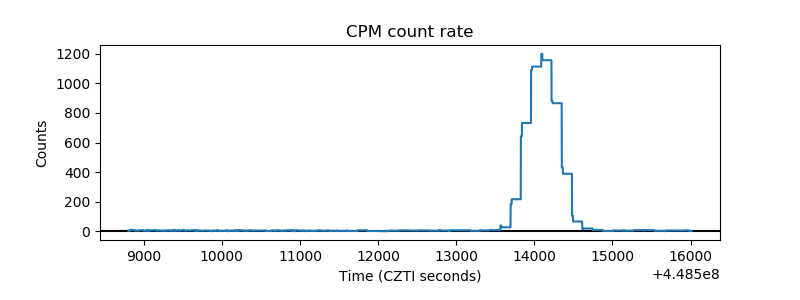 |
| CZT Counter | 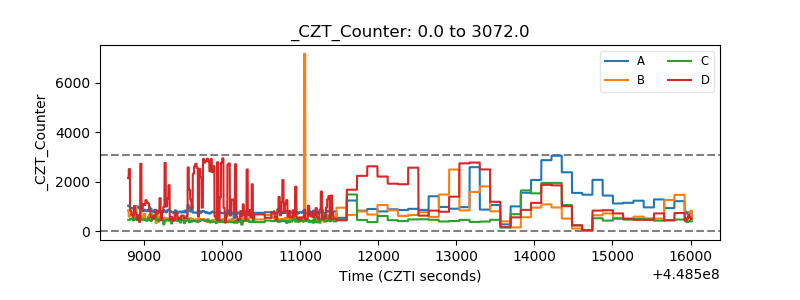 |
| +2.5 Volts monitor | 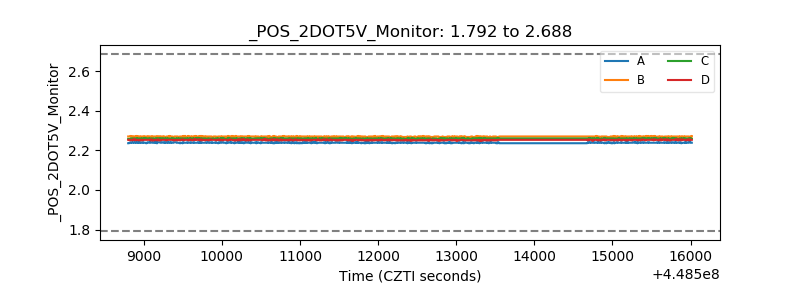 |
| +5 Volts monitor | 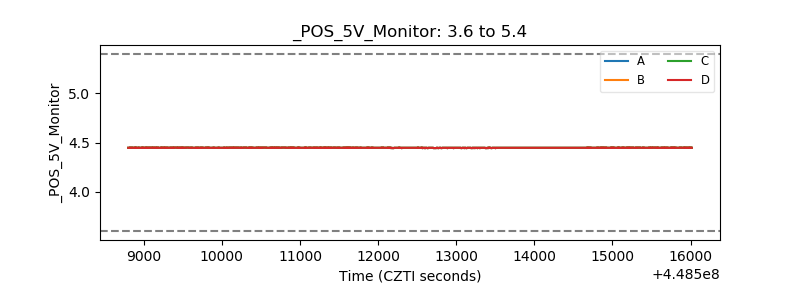 |
| _ROLL_ROT | 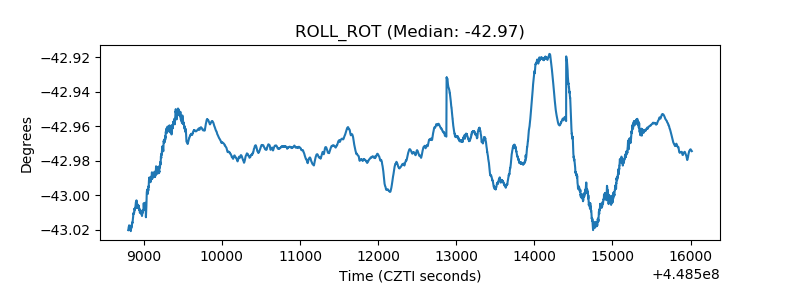 |
| _Roll_DEC | 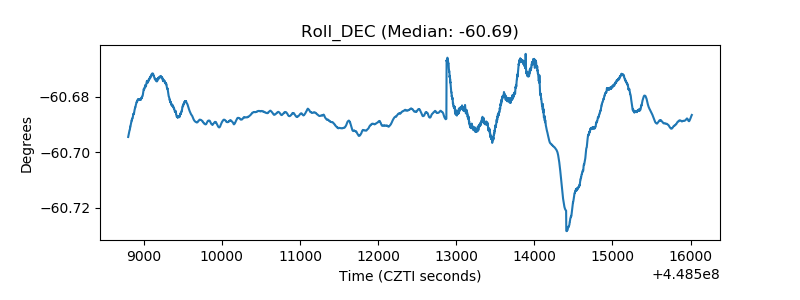 |
| _Roll_RA | 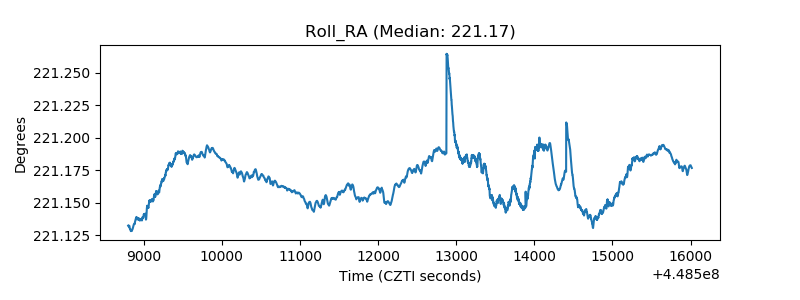 |
| Veto Counter |  |