| Param | Original file | Final file |
|---|---|---|
| Filename | modeM0/AS1T05_185T01_9000006128_45821cztM0_level2.fits | modeM0/AS1T05_185T01_9000006128_45821cztM0_level2_quad_clean.evt |
| Size (bytes) | 545,411,520 | 109,748,160 |
| Size | 520.1 MB | 104.7 MB |
| Events in quadrant A | 6,080,782 | 739,765 |
| Events in quadrant B | 5,044,818 | 746,105 |
| Events in quadrant C | 3,231,802 | 748,283 |
| Events in quadrant D | 5,339,203 | 645,368 |
| Mode SS | |||
|---|---|---|---|
| Quadrant | BADHDUFLAG | Total packets | Discarded packets |
| A | 0 | 128 | 0 |
| B | 0 | 128 | 0 |
| C | 0 | 128 | 0 |
| D | 0 | 128 | 0 |
| Mode M0 | |||
|---|---|---|---|
| Quadrant | BADHDUFLAG | Total packets | Discarded packets |
| A | 0 | 22063 | 2 |
| B | 0 | 19256 | 2 |
| C | 0 | 13797 | 2 |
| D | 0 | 20097 | 2 |
| Mode M9 | |||
|---|---|---|---|
| Quadrant | BADHDUFLAG | Total packets | Discarded packets |
| A | 0 | 17 | 1 |
| B | 0 | 17 | 0 |
| C | 0 | 18 | 1 |
| D | 0 | 18 | 1 |
| Quadrant | Total seconds | Saturated seconds | Saturation percentage |
|---|---|---|---|
| A | 6361 | 184 | 2.892627% |
| B | 6361 | 466 | 7.325892% |
| C | 6361 | 85 | 1.336268% |
| D | 6361 | 428 | 6.728502% |
Noise dominated data is calculated using 1-second bins in cleaned event files. If a bin has >2000 counts, and if more than 50% of those come from <1% of pixels, then it is considered to be noise-dominated and hence unusable.
| Quadrant | # 1 sec bins | Bins with >0 counts | Bins with >2000 counts | High rate bins dominated by noise | Noise dominated (total time) | Noise dominated (detector-on time) | Marked lightcurve |
|---|---|---|---|---|---|---|---|
| A | 7546 | 6362 | 80 | 80 | 1.06% | 1.26% | 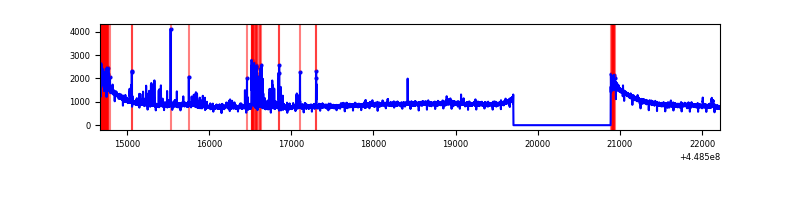 |
| B | 7546 | 6362 | 237 | 237 | 3.14% | 3.73% | 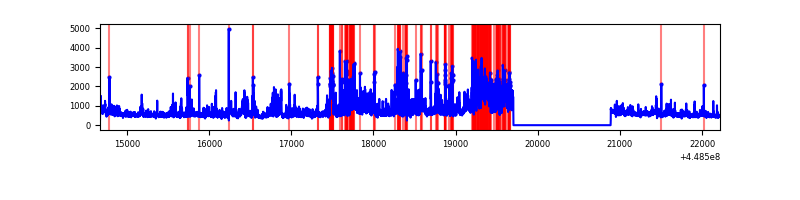 |
| C | 7546 | 6362 | 56 | 56 | 0.74% | 0.88% | 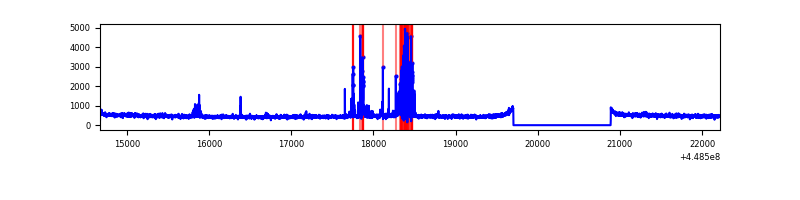 |
| D | 7546 | 6362 | 411 | 411 | 5.45% | 6.46% | 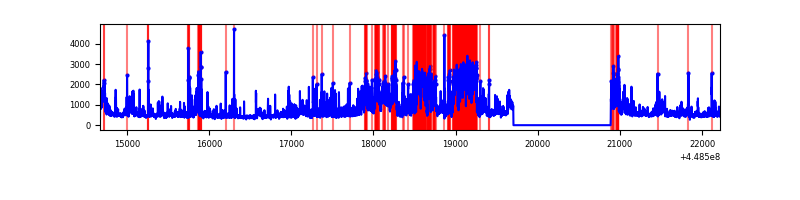 |
Top three noisy pixels from each quadrant. If the there are fewer than three noisy pixels in the level2.evt file, extra rows are filled as -1
| Pixel properties | Quadrant properties | ||||||
|---|---|---|---|---|---|---|---|
| Quadrant | DetID | PixID | Counts | Sigma | Mean | Median | Sigma |
| A | 10 | 83 | 2948537 | 19609.11 | 734 | 720 | 150.3 |
| A | 13 | 248 | 260733 | 1729.63 | 734 | 720 | 150.3 |
| A | 15 | 14 | 25981 | 168.04 | 734 | 720 | 150.3 |
| B | 3 | 112 | 1137584 | 8097.05 | 726 | 705 | 140.4 |
| B | 4 | 171 | 586900 | 4174.98 | 726 | 705 | 140.4 |
| B | 0 | 171 | 230231 | 1634.72 | 726 | 705 | 140.4 |
| C | 0 | 207 | 271786 | 1572.21 | 741 | 744 | 172.4 |
| C | 3 | 233 | 43663 | 248.96 | 741 | 744 | 172.4 |
| C | 2 | 14 | 22343 | 125.29 | 741 | 744 | 172.4 |
| D | 11 | 241 | 1748476 | 9758.05 | 724 | 703 | 179.1 |
| D | 1 | 52 | 226516 | 1260.74 | 724 | 703 | 179.1 |
| D | 12 | 2 | 209502 | 1165.75 | 724 | 703 | 179.1 |
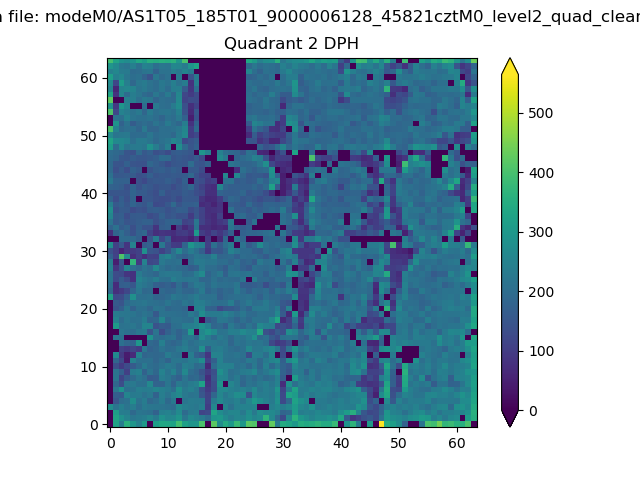
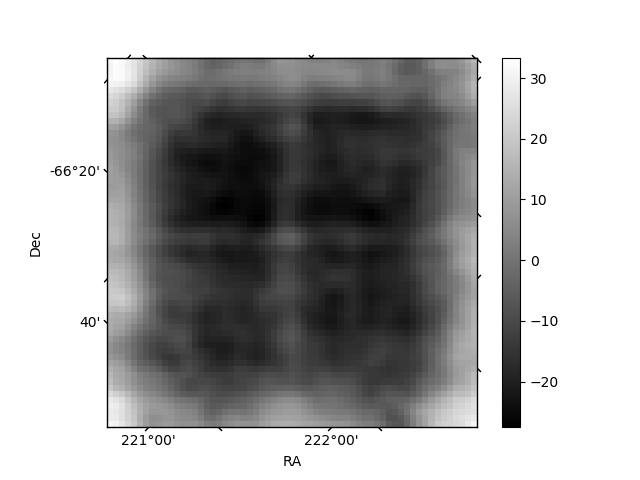
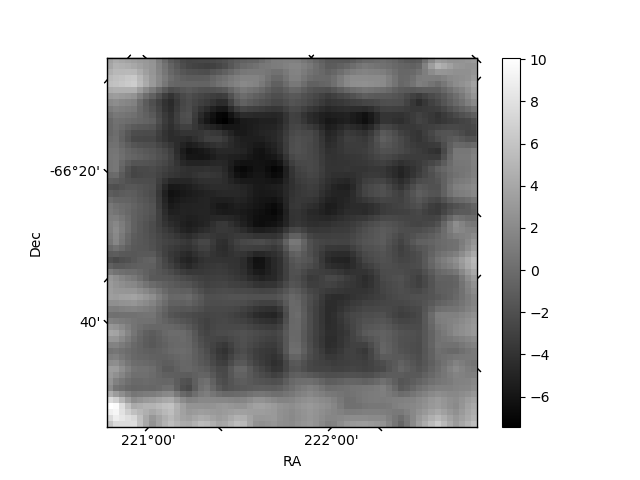
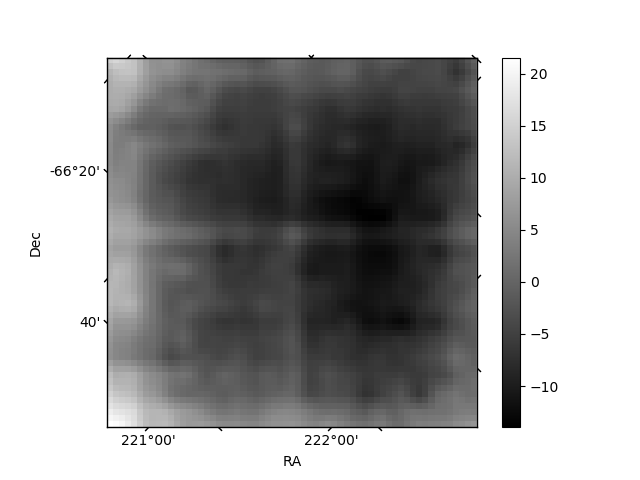
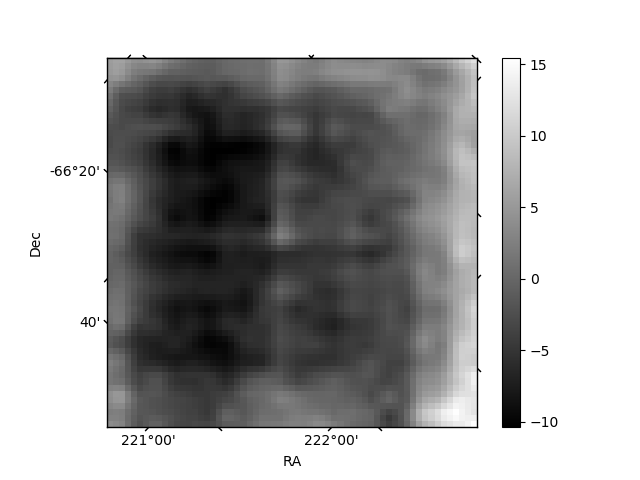
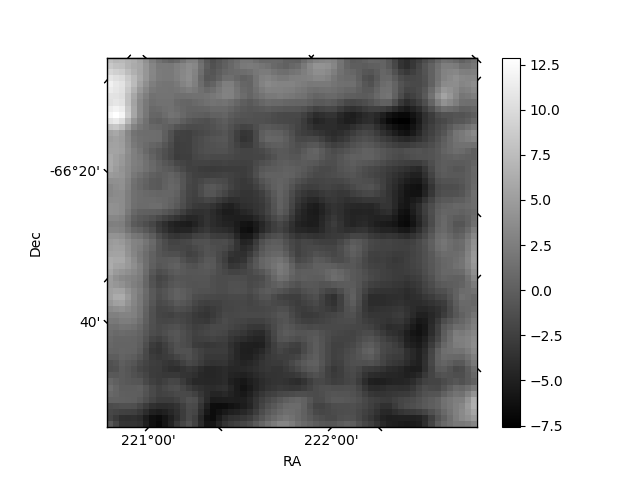
Histogram calculated using DETX and DETY for each event in the final _common_clean file
| Quadrant A | 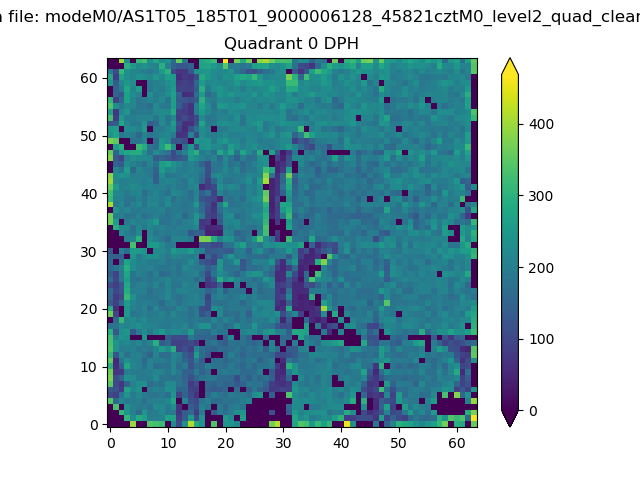 |
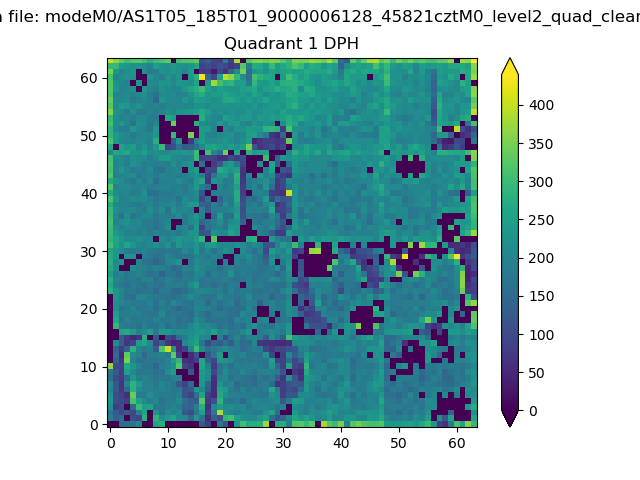 |
Quadrant B |
|---|---|---|---|
| Quadrant D | 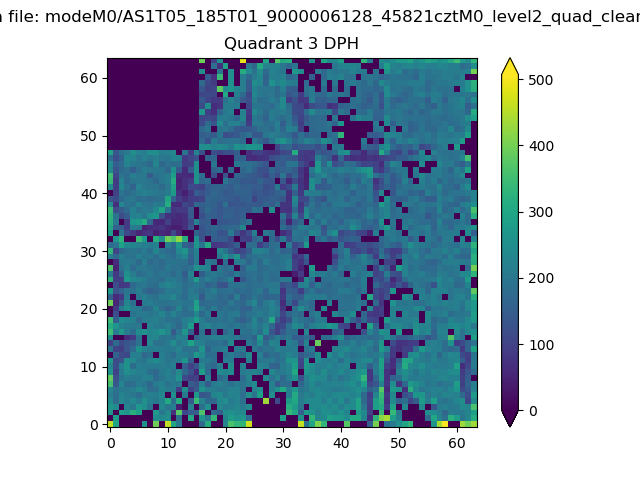 |
 |
Quadrant C |
| Plot type | Count rate plots | Images |
|---|---|---|
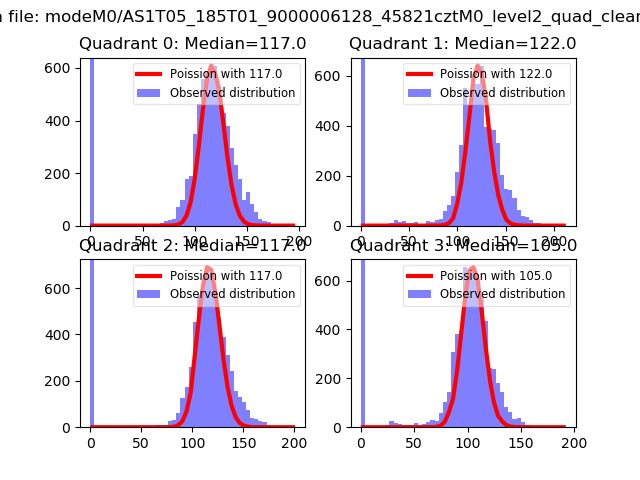
| Comparison with Poisson distribution Blue bars denote a histogram of data divided into 1 sec bins. Red curve is a Poisson curve with rate = median count rate of data. |
 |
 |
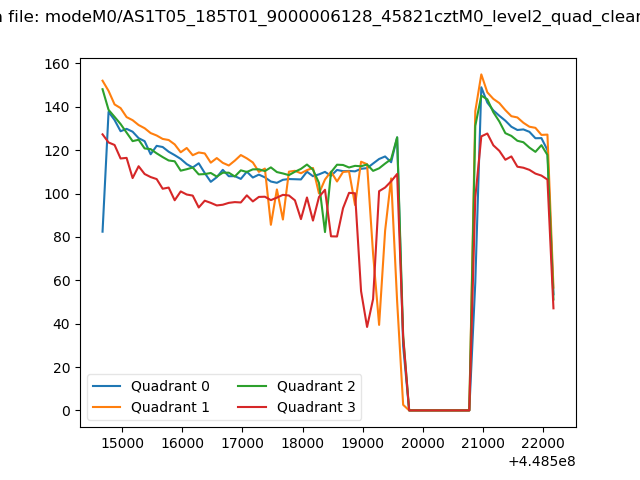
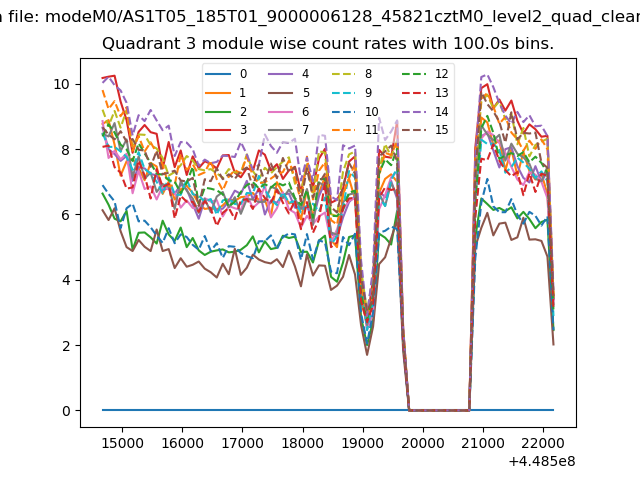
| Quadrant-wise count rates Data is divided into 100 sec bins |
 |
|
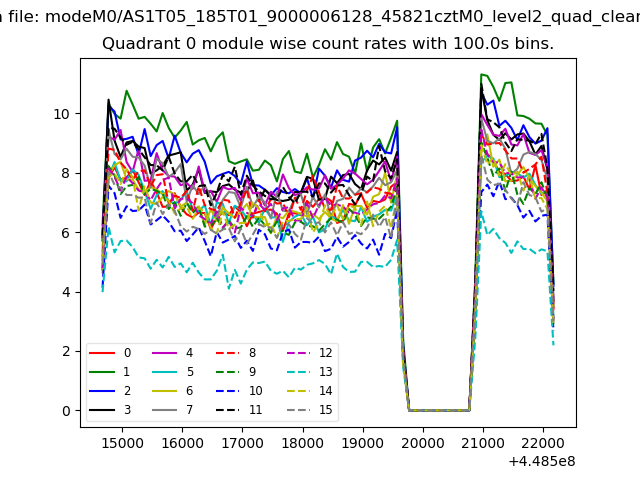
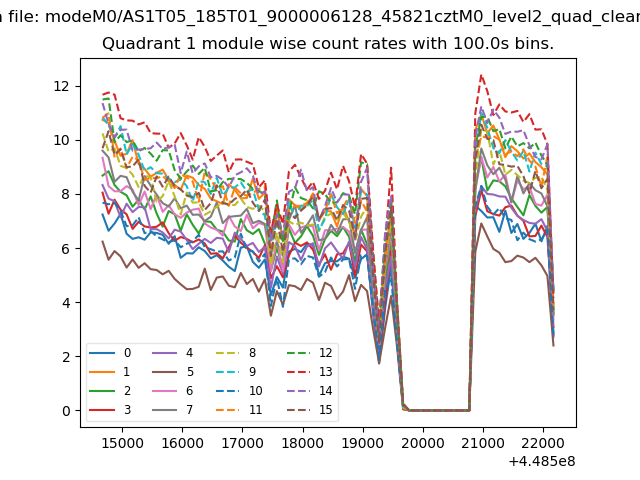
| Module-wise count rates for Quadrant A Data is divided into 100 sec bins |
 |
 |
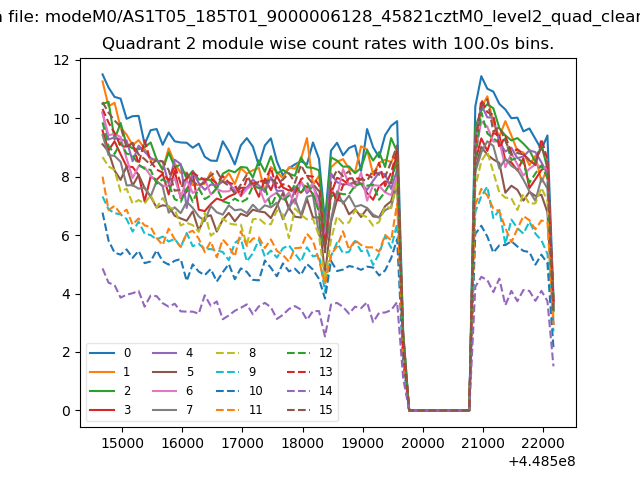
| Module-wise count rates for Quadrant B Data is divided into 100 sec bins |
 |
 |
| Module-wise count rates for Quadrant C Data is divided into 100 sec bins |
 |
 |
| Module-wise count rates for Quadrant D Data is divided into 100 sec bins |
 |
 |
| Parameter | Plot |
|---|---|
| CZT HV Monitor | 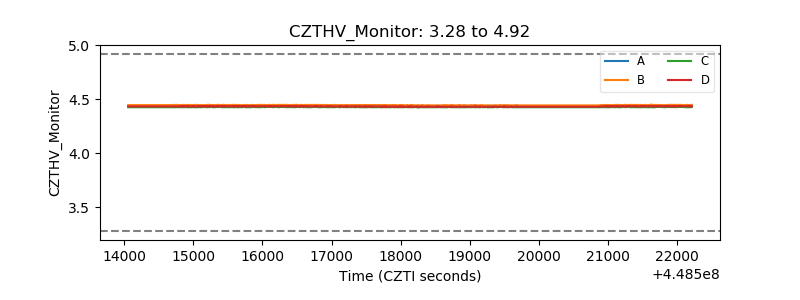 |
| D_VDD | 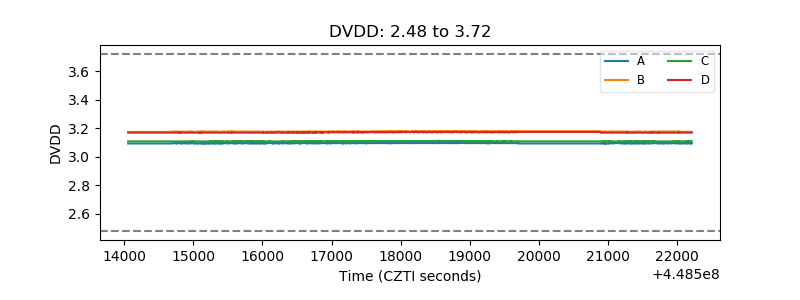 |
| Temperature 1 | 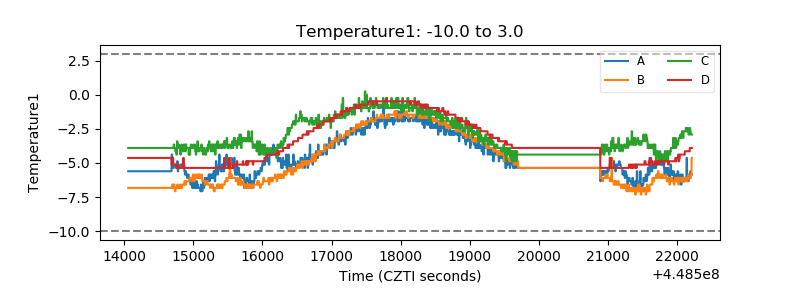 |
| Veto HV Monitor | 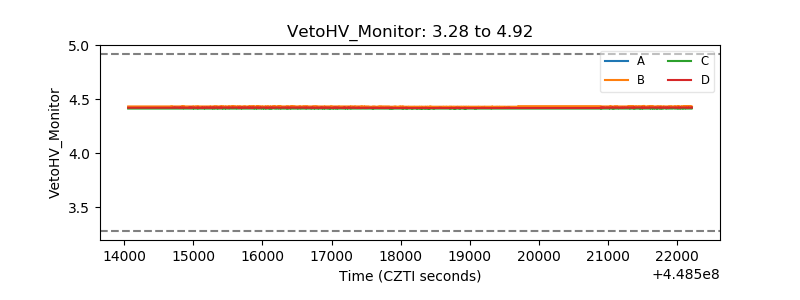 |
| Veto LLD | 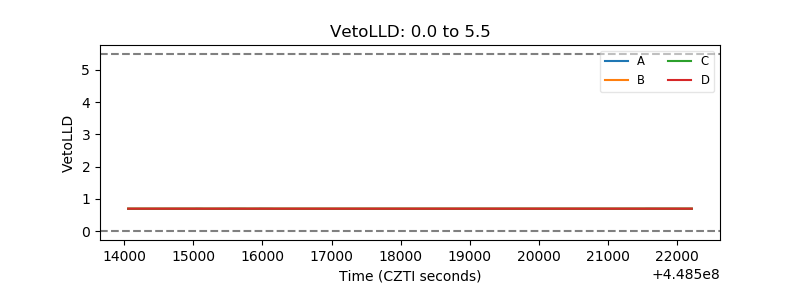 |
| Alpha Counter | 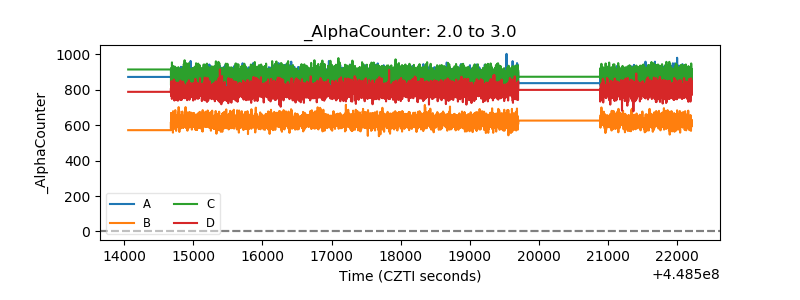 |
| _CPM_Rate | 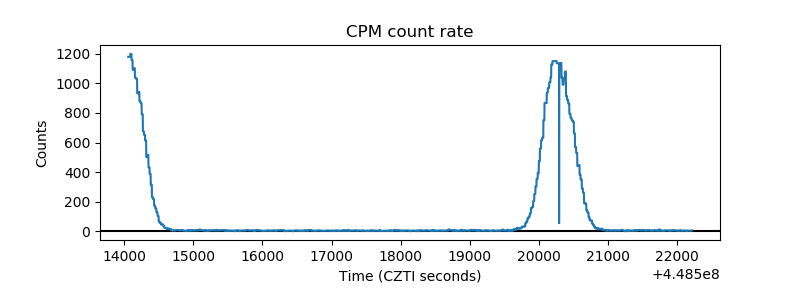 |
| CZT Counter | 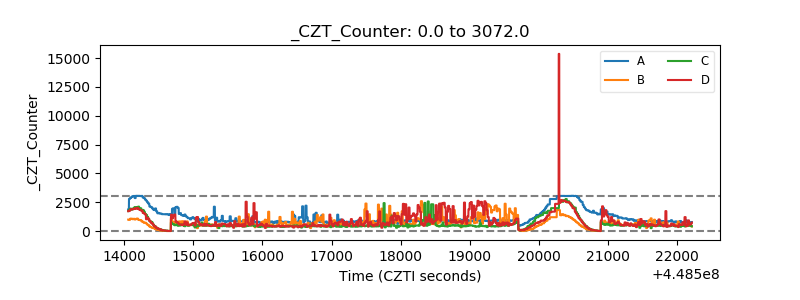 |
| +2.5 Volts monitor | 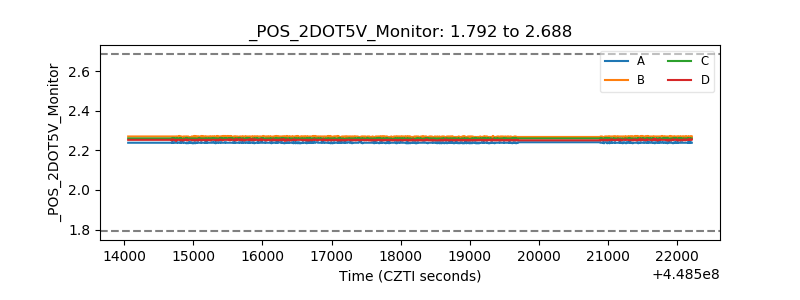 |
| +5 Volts monitor | 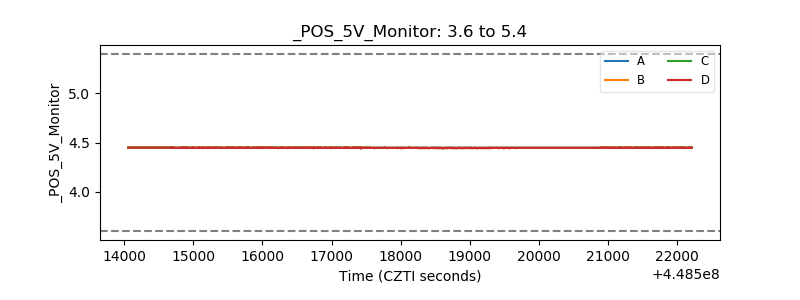 |
| _ROLL_ROT | 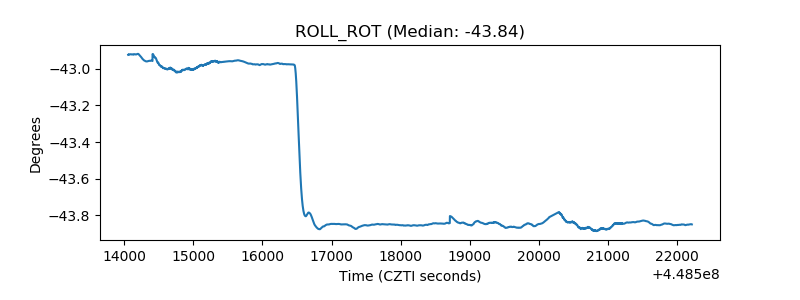 |
| _Roll_DEC | 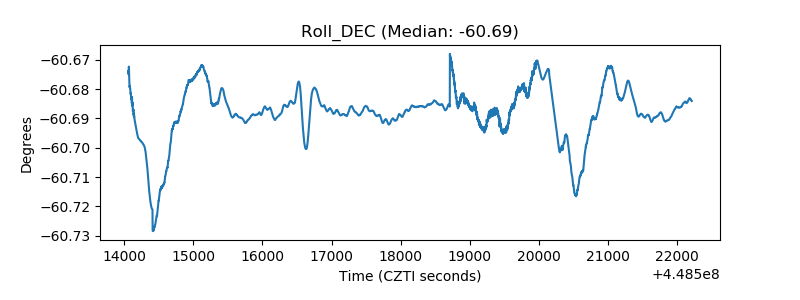 |
| _Roll_RA | 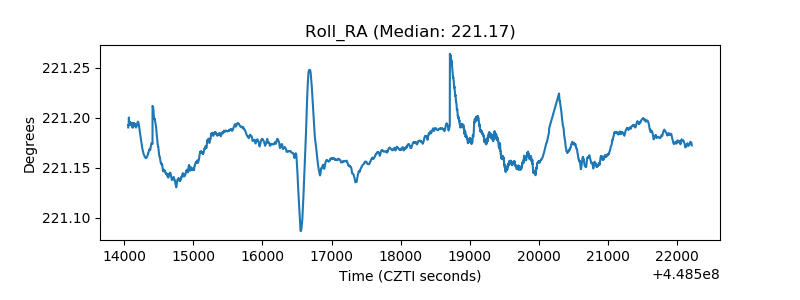 |
| Veto Counter | 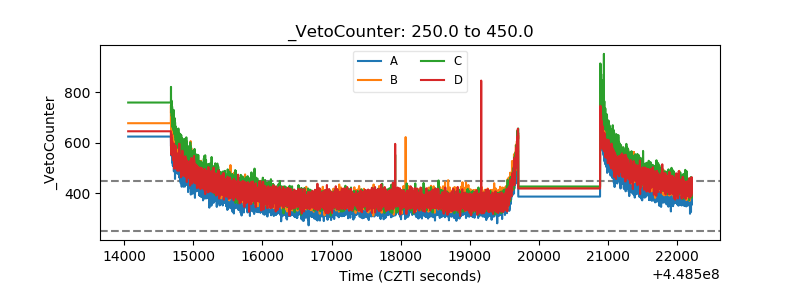 |