| Param | Original file | Final file |
|---|---|---|
| Filename | modeM0/AS1T05_185T01_9000006128_45824cztM0_level2.fits | modeM0/AS1T05_185T01_9000006128_45824cztM0_level2_quad_clean.evt |
| Size (bytes) | 529,453,440 | 109,756,800 |
| Size | 504.9 MB | 104.7 MB |
| Events in quadrant A | 6,117,311 | 710,431 |
| Events in quadrant B | 5,335,979 | 744,496 |
| Events in quadrant C | 2,992,666 | 745,882 |
| Events in quadrant D | 4,637,338 | 659,432 |
| Mode SS | |||
|---|---|---|---|
| Quadrant | BADHDUFLAG | Total packets | Discarded packets |
| A | 0 | 134 | 0 |
| B | 0 | 134 | 0 |
| C | 0 | 134 | 0 |
| D | 0 | 134 | 0 |
| Mode M0 | |||
|---|---|---|---|
| Quadrant | BADHDUFLAG | Total packets | Discarded packets |
| A | 0 | 22271 | 1 |
| B | 0 | 20280 | 1 |
| C | 0 | 13665 | 1 |
| D | 0 | 18151 | 1 |
| Mode M9 | |||
|---|---|---|---|
| Quadrant | BADHDUFLAG | Total packets | Discarded packets |
| A | 0 | 9 | 0 |
| B | 0 | 9 | 0 |
| C | 0 | 9 | 0 |
| D | 0 | 9 | 0 |
| Quadrant | Total seconds | Saturated seconds | Saturation percentage |
|---|---|---|---|
| A | 6645 | 392 | 5.899172% |
| B | 6645 | 492 | 7.404063% |
| C | 6645 | 96 | 1.444695% |
| D | 6646 | 302 | 4.544087% |
Noise dominated data is calculated using 1-second bins in cleaned event files. If a bin has >2000 counts, and if more than 50% of those come from <1% of pixels, then it is considered to be noise-dominated and hence unusable.
| Quadrant | # 1 sec bins | Bins with >0 counts | Bins with >2000 counts | High rate bins dominated by noise | Noise dominated (total time) | Noise dominated (detector-on time) | Marked lightcurve |
|---|---|---|---|---|---|---|---|
| A | 7570 | 6646 | 75 | 75 | 0.99% | 1.13% | 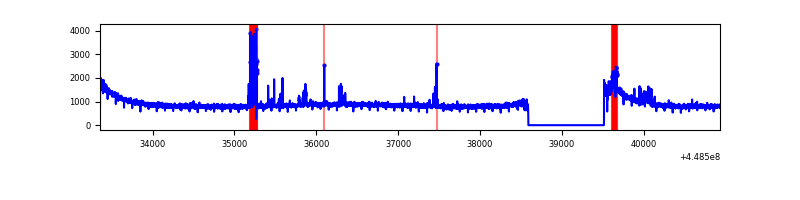 |
| B | 7570 | 6646 | 215 | 215 | 2.84% | 3.24% | 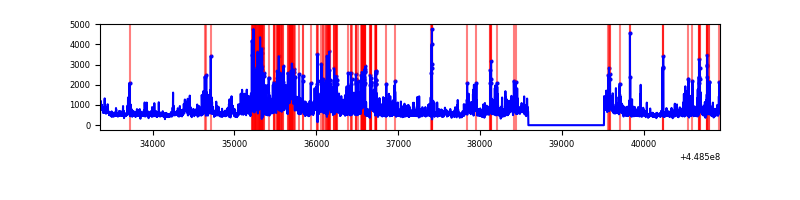 |
| C | 7570 | 6646 | 0 | 0 | 0.00% | 0.00% | 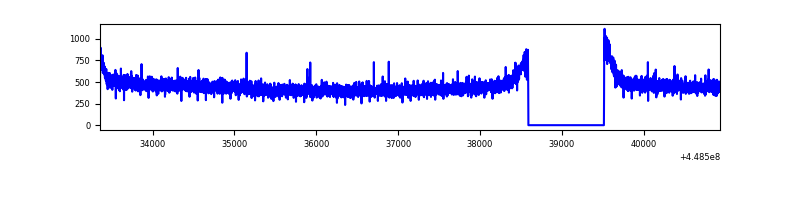 |
| D | 7571 | 6647 | 164 | 164 | 2.17% | 2.47% | 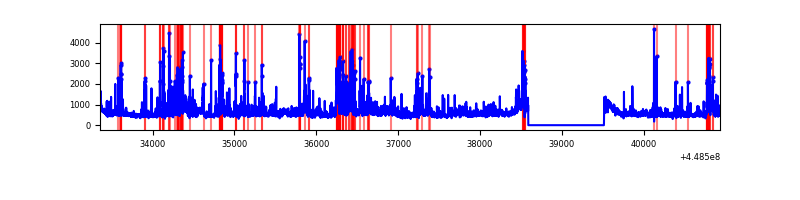 |
Top three noisy pixels from each quadrant. If the there are fewer than three noisy pixels in the level2.evt file, extra rows are filled as -1
| Pixel properties | Quadrant properties | ||||||
|---|---|---|---|---|---|---|---|
| Quadrant | DetID | PixID | Counts | Sigma | Mean | Median | Sigma |
| A | 10 | 83 | 2848619 | 18224.73 | 757 | 740 | 156.3 |
| A | 15 | 14 | 172093 | 1096.56 | 757 | 740 | 156.3 |
| A | 13 | 248 | 167080 | 1064.48 | 757 | 740 | 156.3 |
| B | 3 | 112 | 1354518 | 9184.45 | 754 | 729 | 147.4 |
| B | 0 | 189 | 388999 | 2634.12 | 754 | 729 | 147.4 |
| B | 0 | 171 | 242294 | 1638.84 | 754 | 729 | 147.4 |
| C | 3 | 233 | 7811 | 39.15 | 765 | 768 | 179.9 |
| C | 13 | 61 | 5174 | 24.49 | 765 | 768 | 179.9 |
| C | 12 | 2 | 2331 | 8.69 | 765 | 768 | 179.9 |
| D | 11 | 241 | 629388 | 3341.09 | 752 | 730 | 188.2 |
| D | 1 | 47 | 301749 | 1599.81 | 752 | 730 | 188.2 |
| D | 6 | 143 | 266596 | 1412.98 | 752 | 730 | 188.2 |
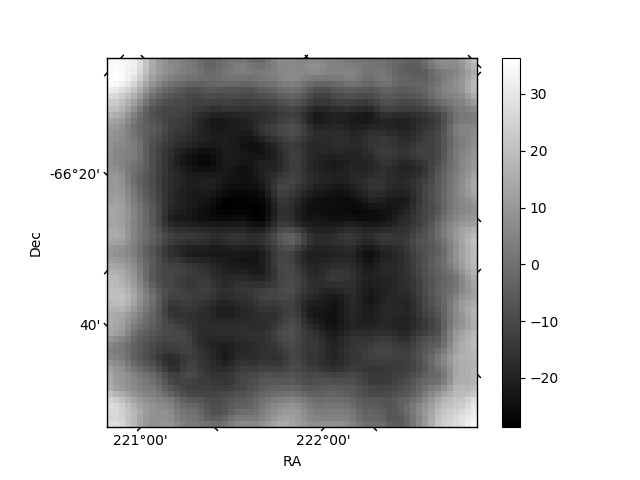
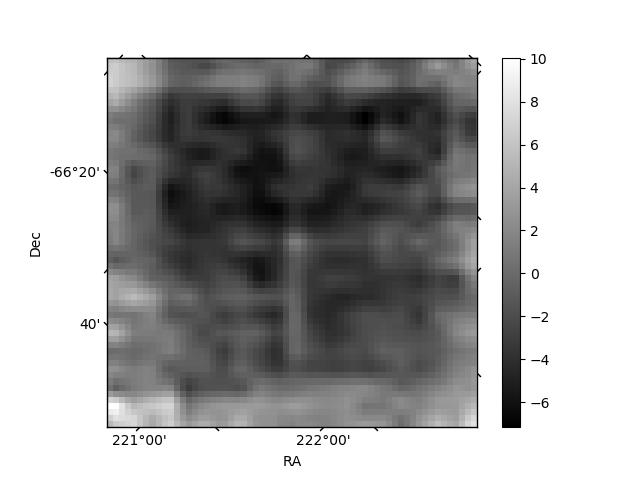
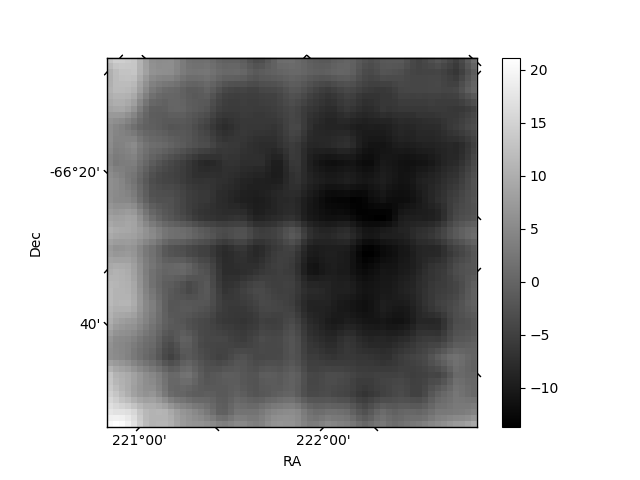
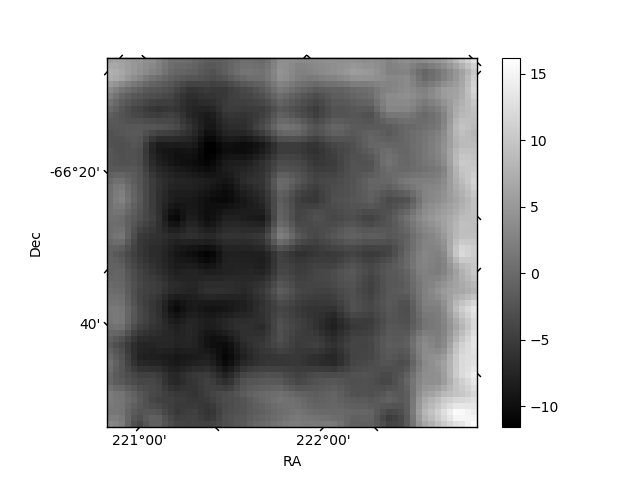
Histogram calculated using DETX and DETY for each event in the final _common_clean file
| Quadrant A | 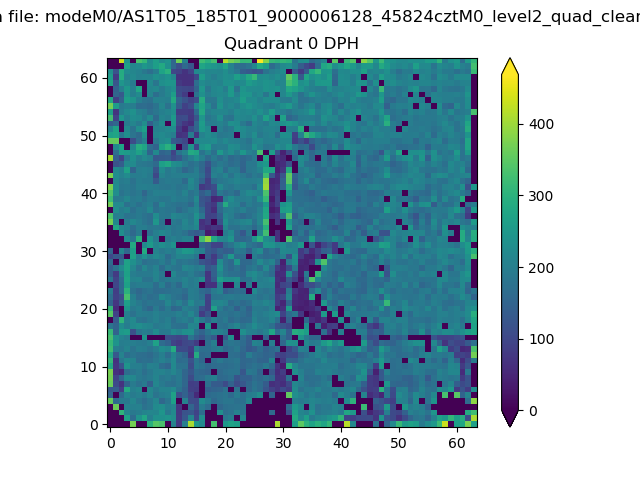 |
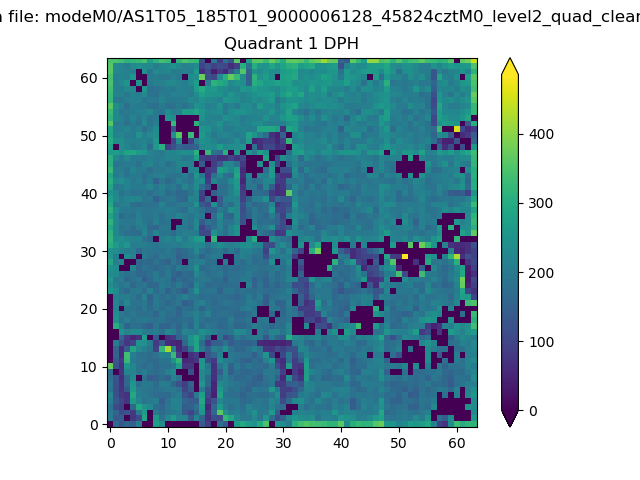 |
Quadrant B |
|---|---|---|---|
| Quadrant D | 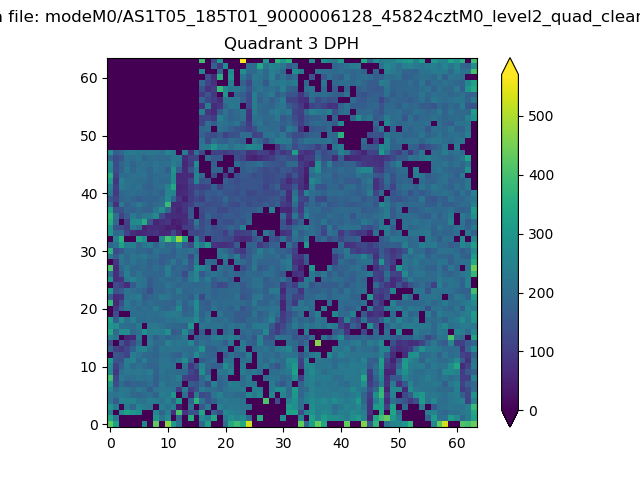 |
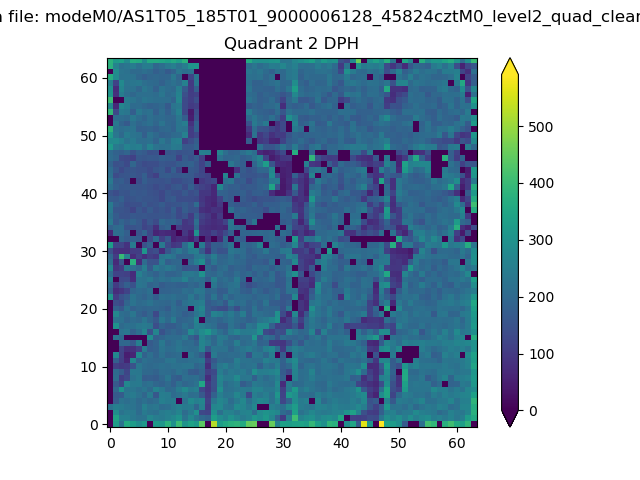 |
Quadrant C |
| Plot type | Count rate plots | Images |
|---|---|---|
| Comparison with Poisson distribution Blue bars denote a histogram of data divided into 1 sec bins. Red curve is a Poisson curve with rate = median count rate of data. |
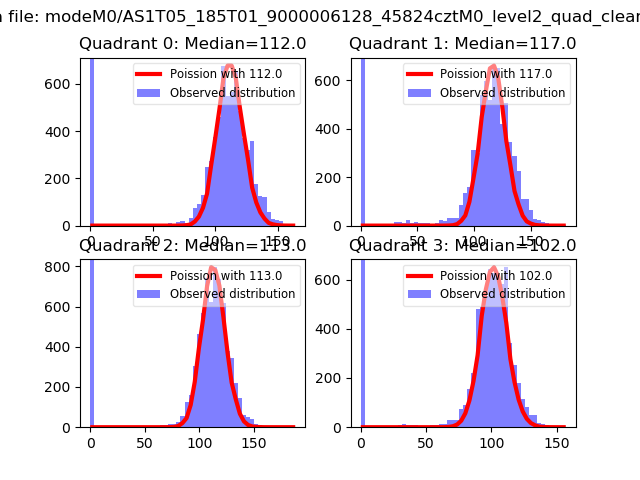 |
 |
| Quadrant-wise count rates Data is divided into 100 sec bins |
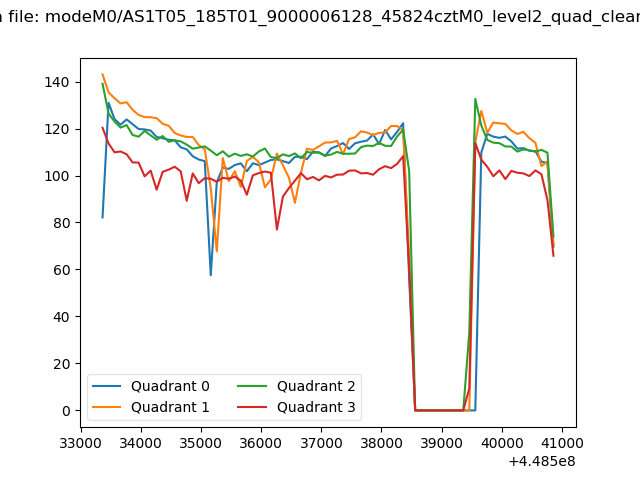 |
|
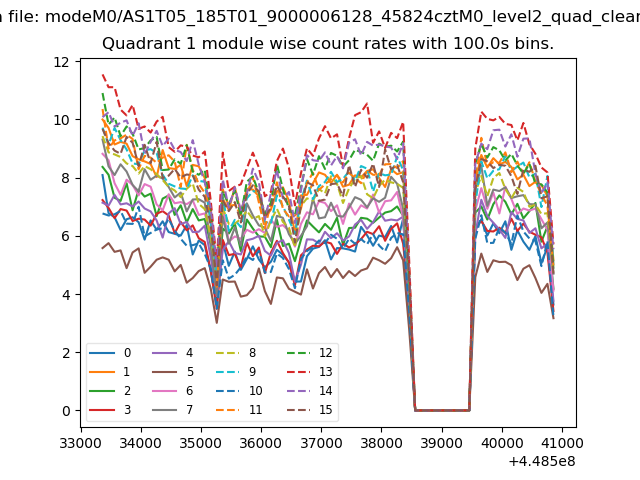
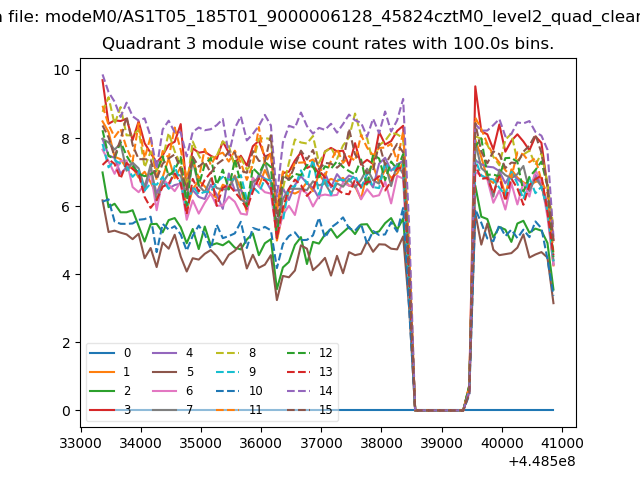
| Module-wise count rates for Quadrant A Data is divided into 100 sec bins |
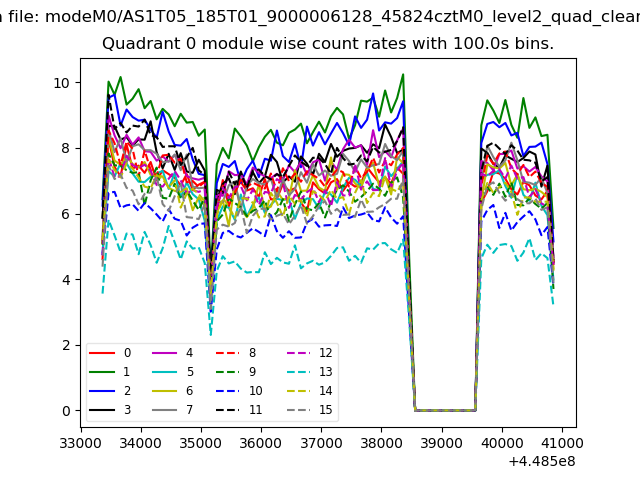 |
 |
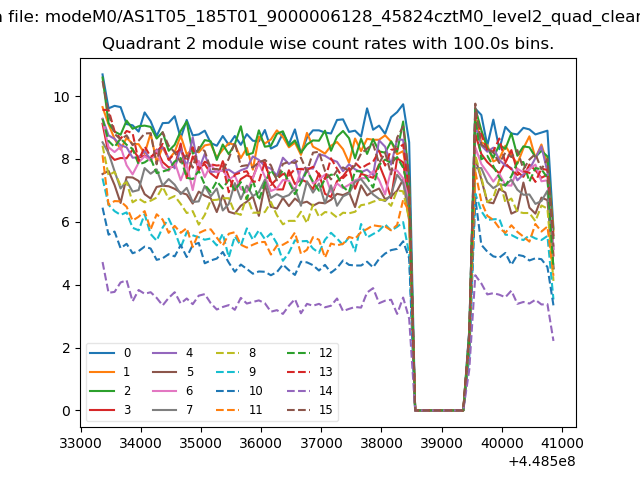
| Module-wise count rates for Quadrant B Data is divided into 100 sec bins |
 |
 |
| Module-wise count rates for Quadrant C Data is divided into 100 sec bins |
 |
 |
| Module-wise count rates for Quadrant D Data is divided into 100 sec bins |
 |
 |
| Parameter | Plot |
|---|---|
| CZT HV Monitor | 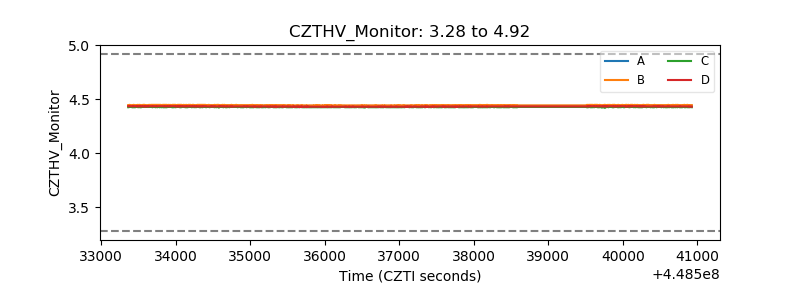 |
| D_VDD | 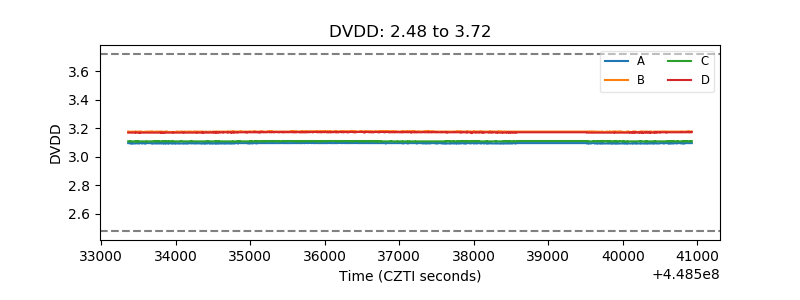 |
| Temperature 1 | 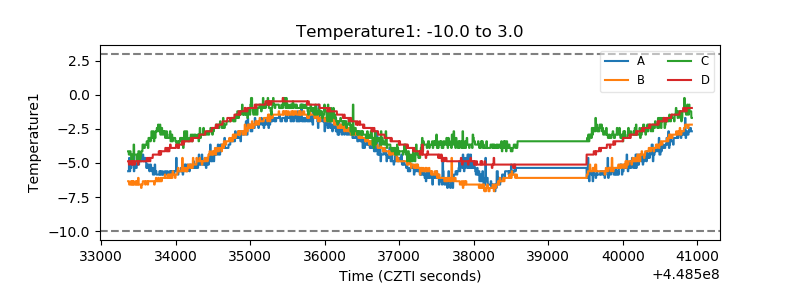 |
| Veto HV Monitor | 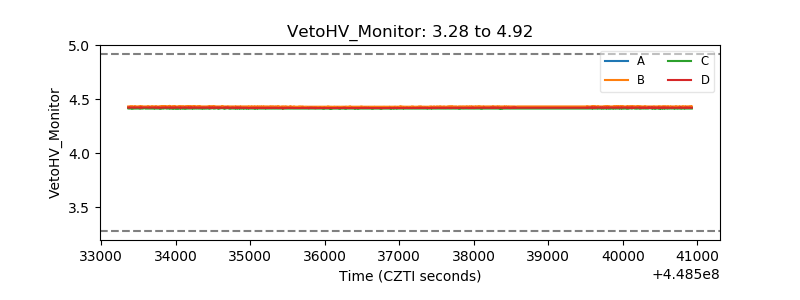 |
| Veto LLD | 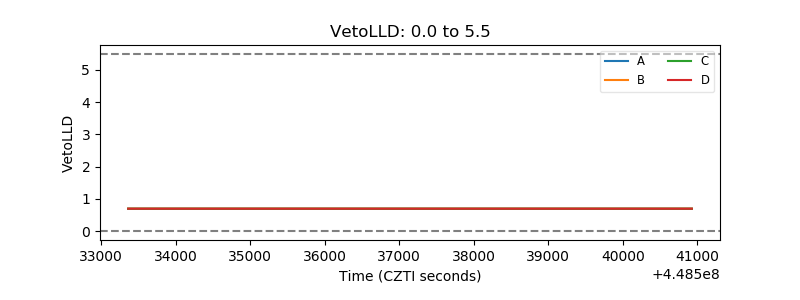 |
| Alpha Counter | 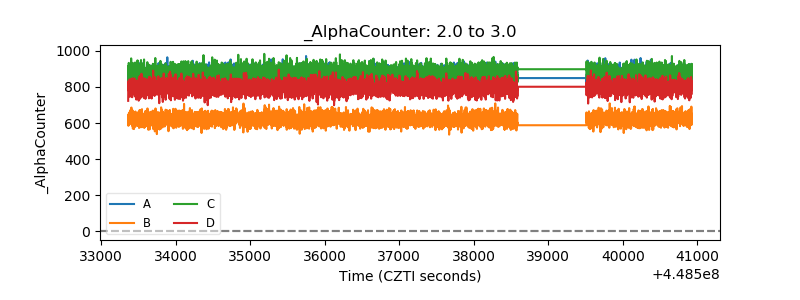 |
| _CPM_Rate | 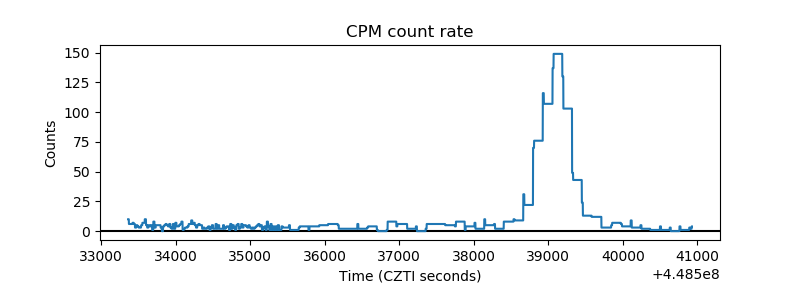 |
| CZT Counter | 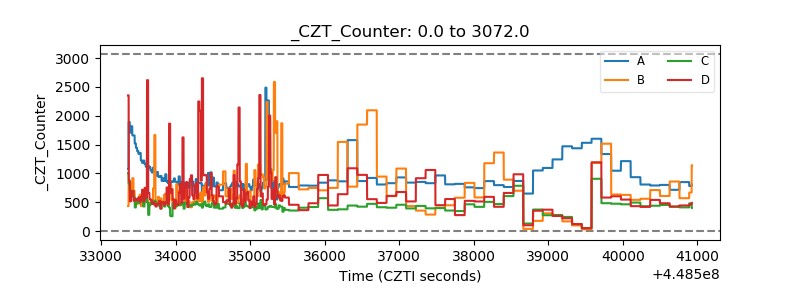 |
| +2.5 Volts monitor | 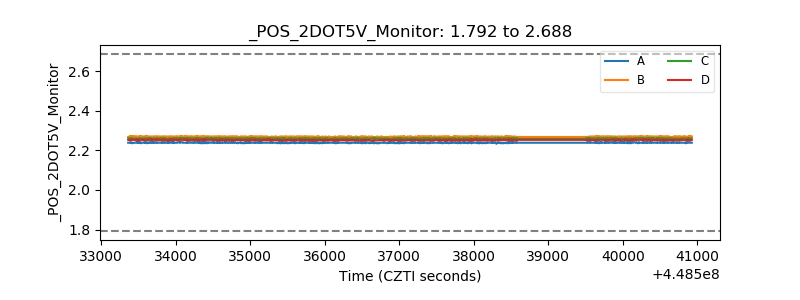 |
| +5 Volts monitor | 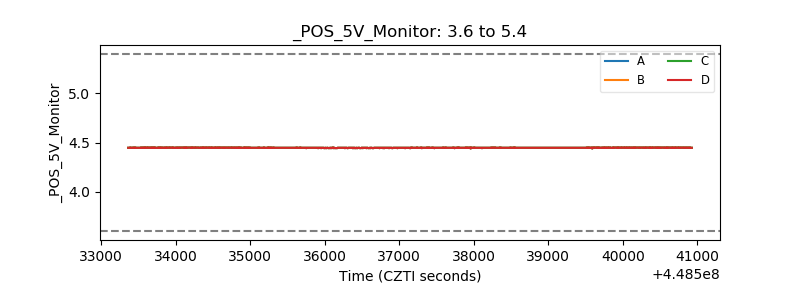 |
| _ROLL_ROT | 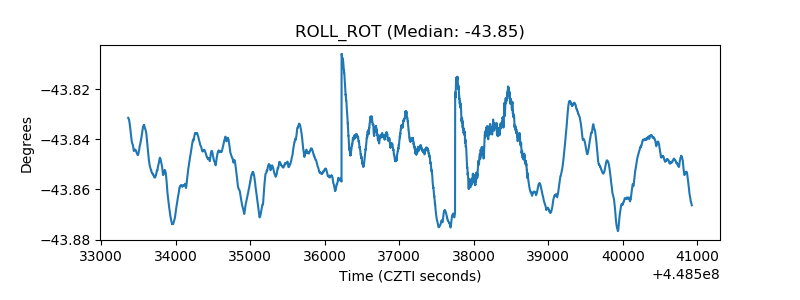 |
| _Roll_DEC | 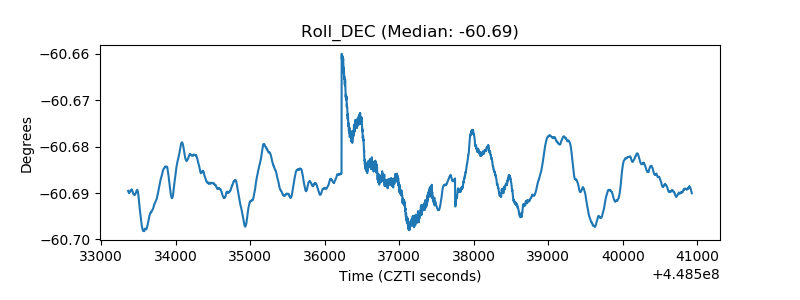 |
| _Roll_RA | 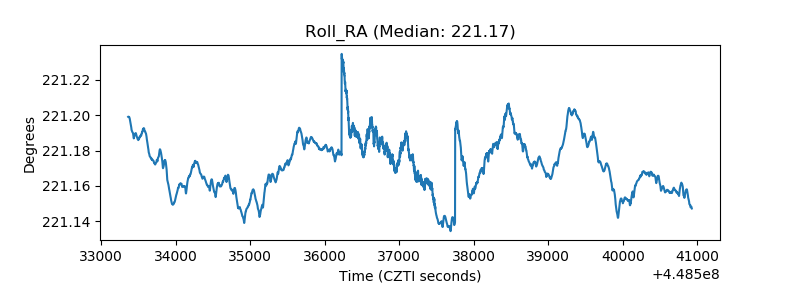 |
| Veto Counter | 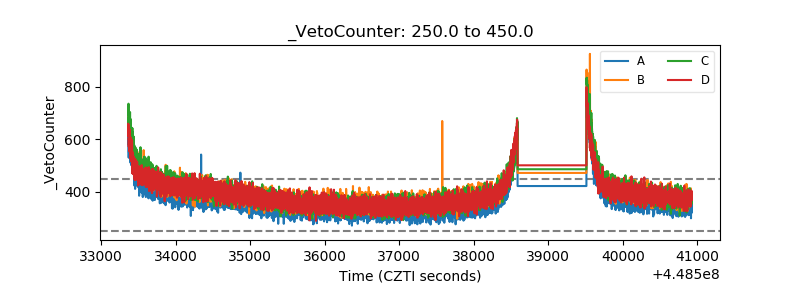 |