| Param | Original file | Final file |
|---|---|---|
| Filename | modeM0/AS1T05_185T01_9000006128_45825cztM0_level2.fits | modeM0/AS1T05_185T01_9000006128_45825cztM0_level2_quad_clean.evt |
| Size (bytes) | 690,992,640 | 116,193,600 |
| Size | 659.0 MB | 110.8 MB |
| Events in quadrant A | 8,720,779 | 664,586 |
| Events in quadrant B | 6,566,407 | 791,561 |
| Events in quadrant C | 3,582,158 | 814,782 |
| Events in quadrant D | 6,116,159 | 715,088 |
| Mode SS | |||
|---|---|---|---|
| Quadrant | BADHDUFLAG | Total packets | Discarded packets |
| A | 0 | 154 | 0 |
| B | 0 | 154 | 0 |
| C | 0 | 154 | 0 |
| D | 0 | 154 | 0 |
| Mode M0 | |||
|---|---|---|---|
| Quadrant | BADHDUFLAG | Total packets | Discarded packets |
| A | 0 | 30708 | 2 |
| B | 0 | 24639 | 2 |
| C | 0 | 16250 | 2 |
| D | 0 | 23353 | 2 |
| Mode M9 | |||
|---|---|---|---|
| Quadrant | BADHDUFLAG | Total packets | Discarded packets |
| A | 0 | 6 | 0 |
| B | 0 | 7 | 0 |
| C | 0 | 7 | 0 |
| D | 0 | 7 | 0 |
| Quadrant | Total seconds | Saturated seconds | Saturation percentage |
|---|---|---|---|
| A | 7651 | 1654 | 21.618089% |
| B | 7651 | 870 | 11.371063% |
| C | 7651 | 262 | 3.424389% |
| D | 7651 | 580 | 7.580708% |
Noise dominated data is calculated using 1-second bins in cleaned event files. If a bin has >2000 counts, and if more than 50% of those come from <1% of pixels, then it is considered to be noise-dominated and hence unusable.
| Quadrant | # 1 sec bins | Bins with >0 counts | Bins with >2000 counts | High rate bins dominated by noise | Noise dominated (total time) | Noise dominated (detector-on time) | Marked lightcurve |
|---|---|---|---|---|---|---|---|
| A | 8121 | 7652 | 1005 | 1005 | 12.38% | 13.13% | 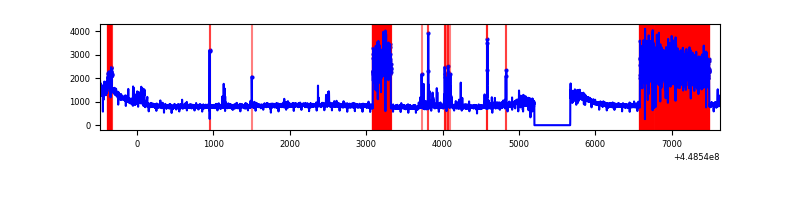 |
| B | 8121 | 7652 | 310 | 310 | 3.82% | 4.05% | 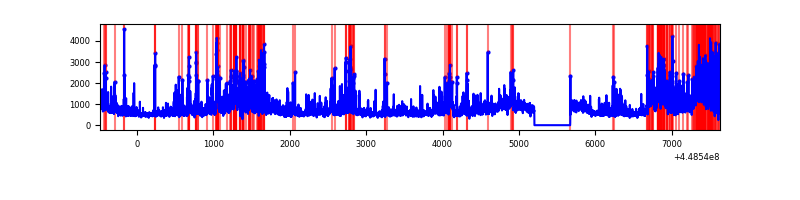 |
| C | 8121 | 7652 | 17 | 17 | 0.21% | 0.22% | 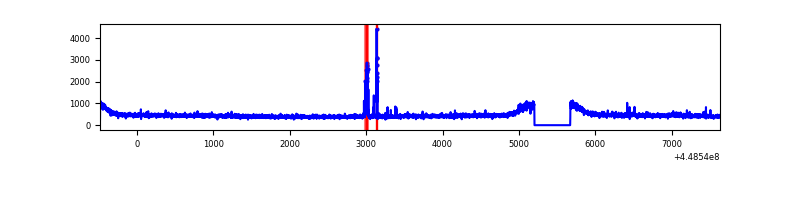 |
| D | 8121 | 7652 | 316 | 316 | 3.89% | 4.13% | 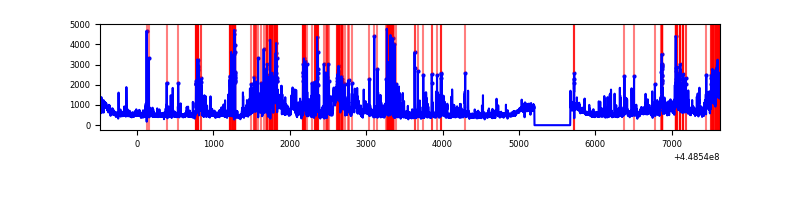 |
Top three noisy pixels from each quadrant. If the there are fewer than three noisy pixels in the level2.evt file, extra rows are filled as -1
| Pixel properties | Quadrant properties | ||||||
|---|---|---|---|---|---|---|---|
| Quadrant | DetID | PixID | Counts | Sigma | Mean | Median | Sigma |
| A | 10 | 83 | 2954366 | 17427.62 | 815 | 796 | 169.5 |
| A | 15 | 14 | 2385651 | 14071.9 | 815 | 796 | 169.5 |
| A | 13 | 248 | 201444 | 1183.93 | 815 | 796 | 169.5 |
| B | 3 | 112 | 2415715 | 14036.6 | 867 | 838 | 172.0 |
| B | 0 | 171 | 175773 | 1016.82 | 867 | 838 | 172.0 |
| B | 0 | 189 | 146823 | 848.55 | 867 | 838 | 172.0 |
| C | 12 | 250 | 80894 | 381.62 | 888 | 891 | 209.6 |
| C | 3 | 233 | 32241 | 149.54 | 888 | 891 | 209.6 |
| C | 1 | 3 | 6798 | 28.18 | 888 | 891 | 209.6 |
| D | 11 | 241 | 686399 | 3131.33 | 875 | 846 | 218.9 |
| D | 12 | 2 | 605854 | 2763.44 | 875 | 846 | 218.9 |
| D | 1 | 52 | 290765 | 1324.23 | 875 | 846 | 218.9 |
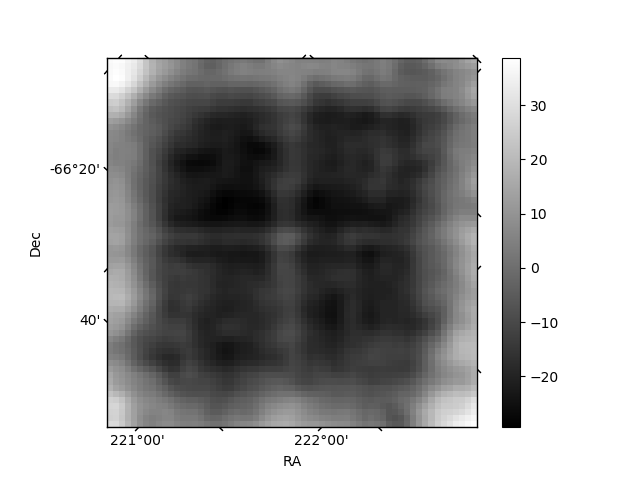
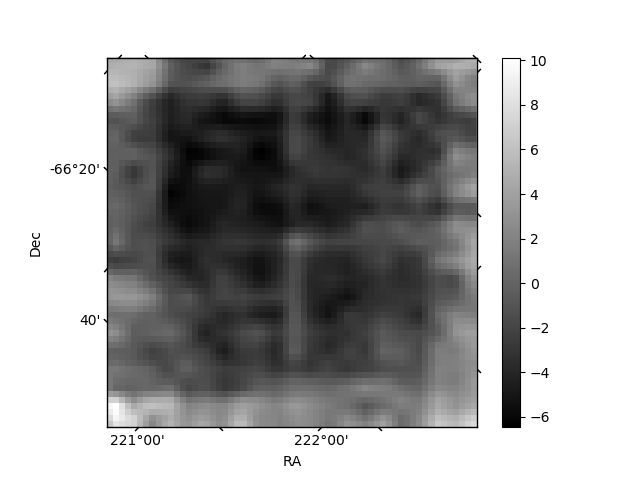
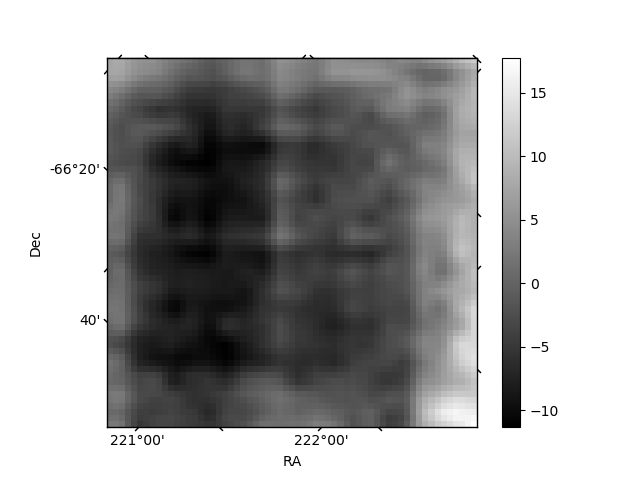
Histogram calculated using DETX and DETY for each event in the final _common_clean file
| Quadrant A | 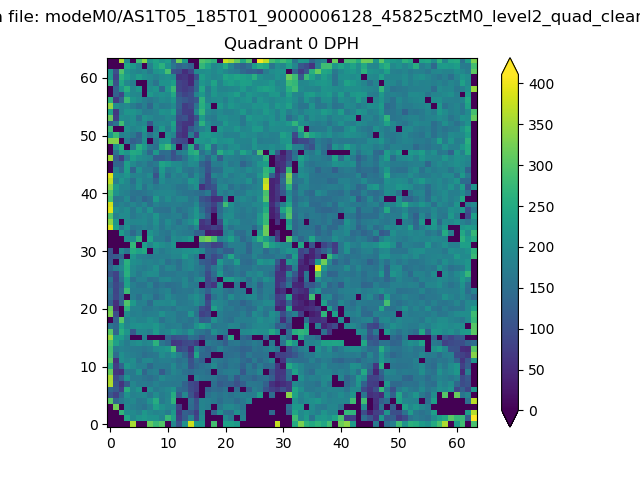 |
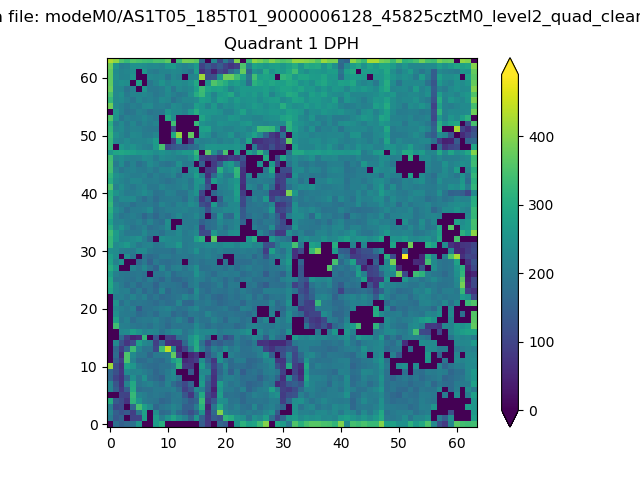 |
Quadrant B |
|---|---|---|---|
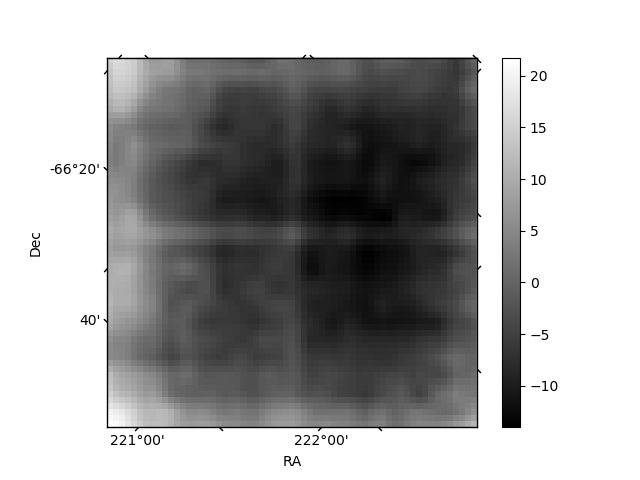
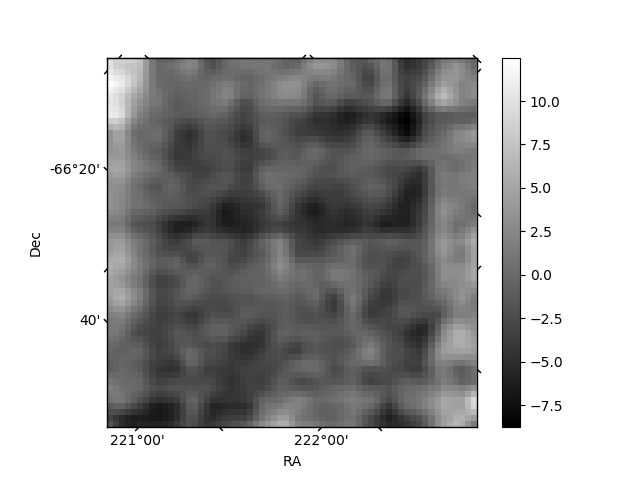
| Quadrant D | 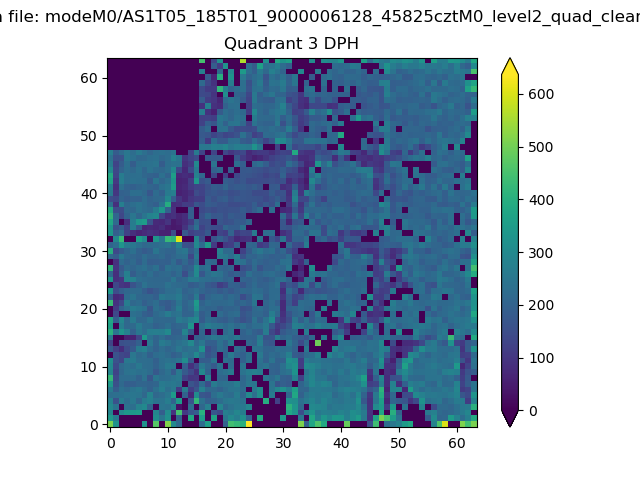 |
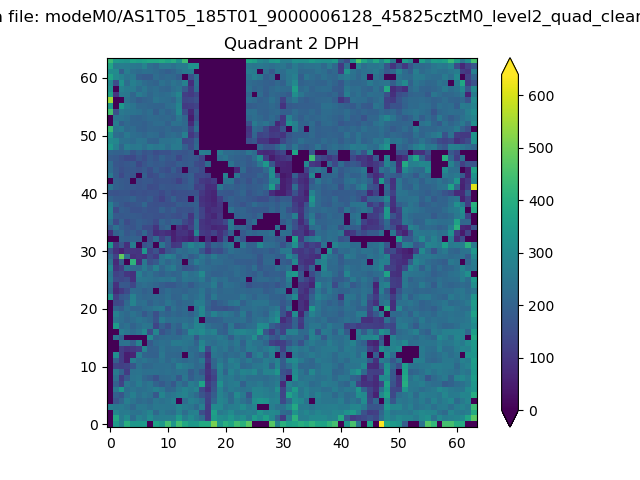 |
Quadrant C |
| Plot type | Count rate plots | Images |
|---|---|---|
| Comparison with Poisson distribution Blue bars denote a histogram of data divided into 1 sec bins. Red curve is a Poisson curve with rate = median count rate of data. |
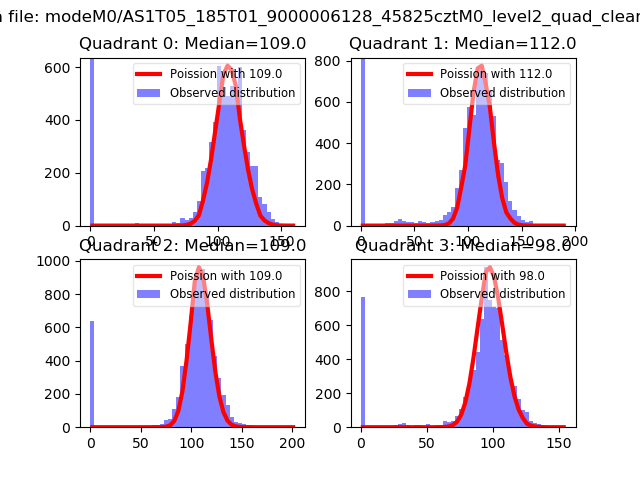 |
 |
| Quadrant-wise count rates Data is divided into 100 sec bins |
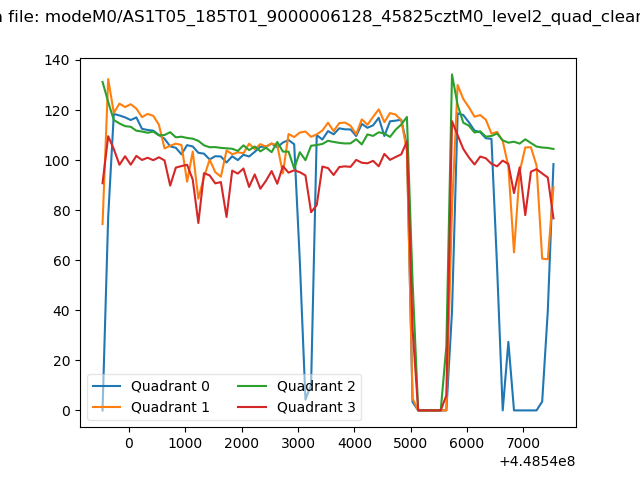 |
|
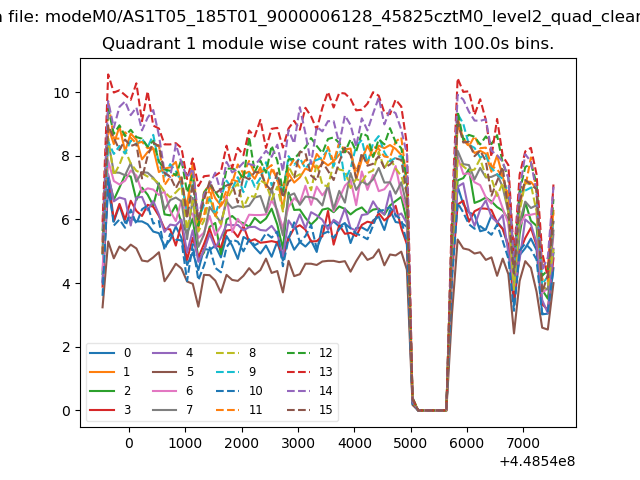
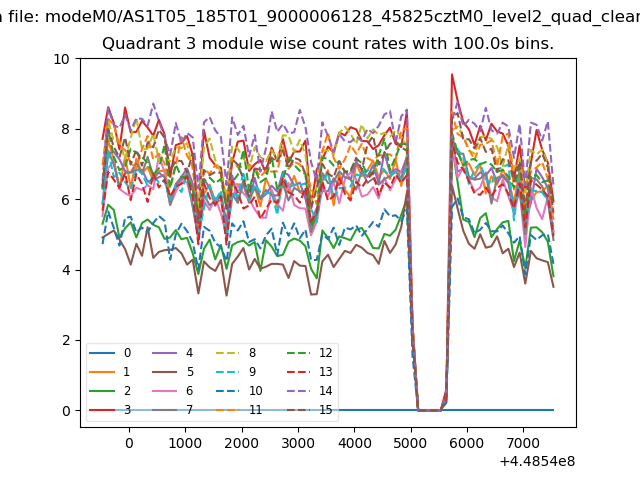
| Module-wise count rates for Quadrant A Data is divided into 100 sec bins |
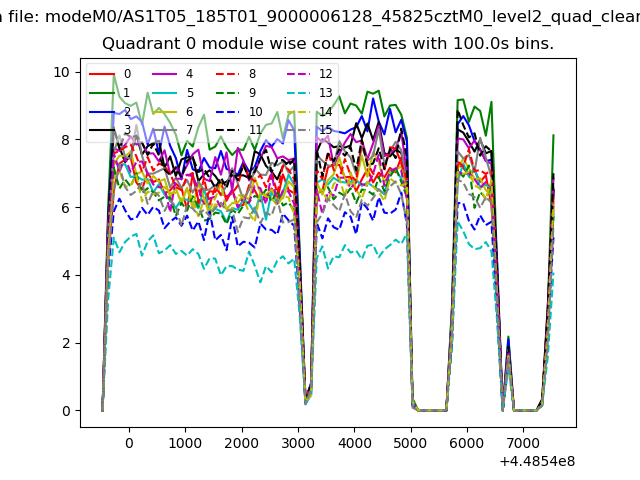 |
 |
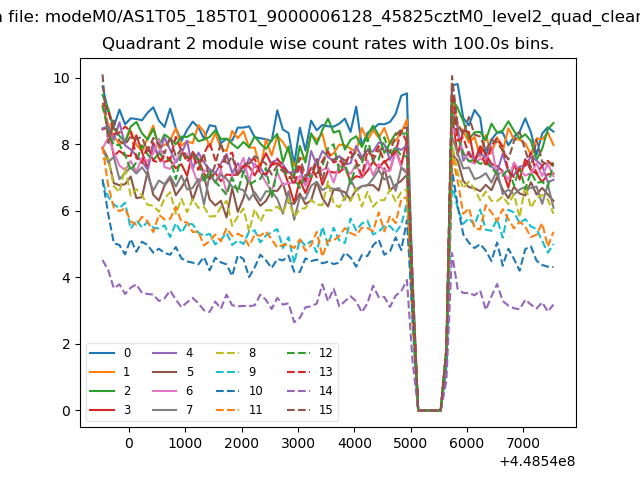
| Module-wise count rates for Quadrant B Data is divided into 100 sec bins |
 |
 |
| Module-wise count rates for Quadrant C Data is divided into 100 sec bins |
 |
 |
| Module-wise count rates for Quadrant D Data is divided into 100 sec bins |
 |
 |
| Parameter | Plot |
|---|---|
| CZT HV Monitor | 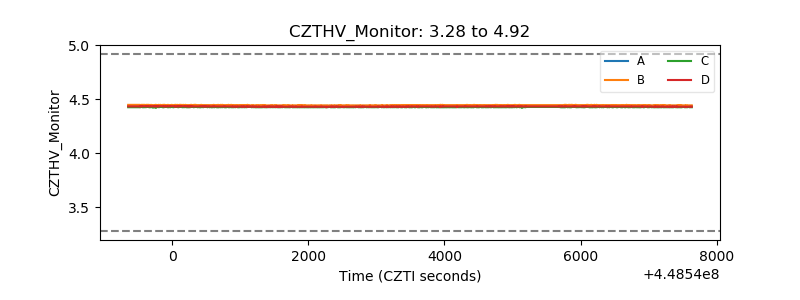 |
| D_VDD | 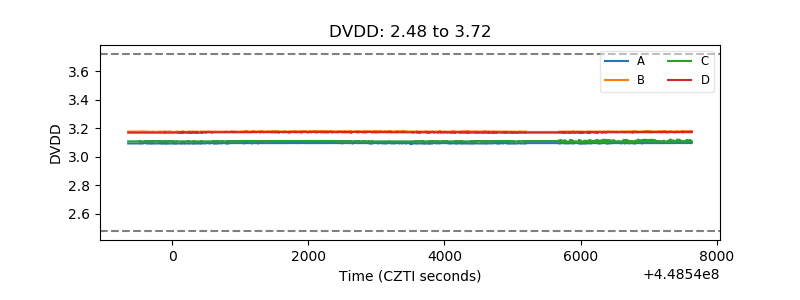 |
| Temperature 1 | 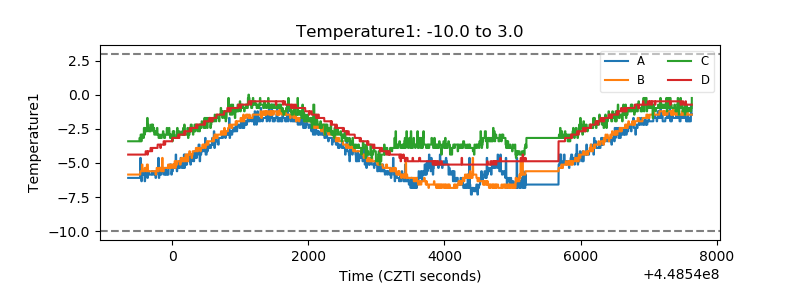 |
| Veto HV Monitor | 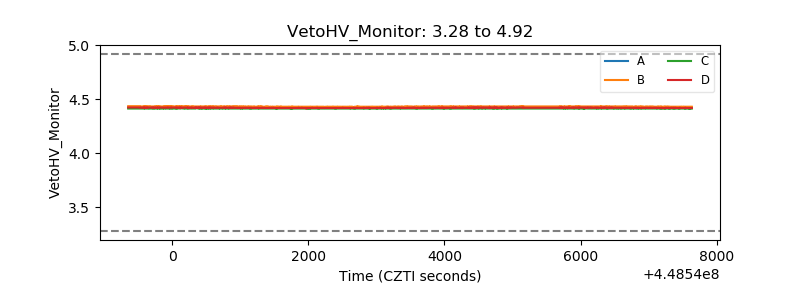 |
| Veto LLD | 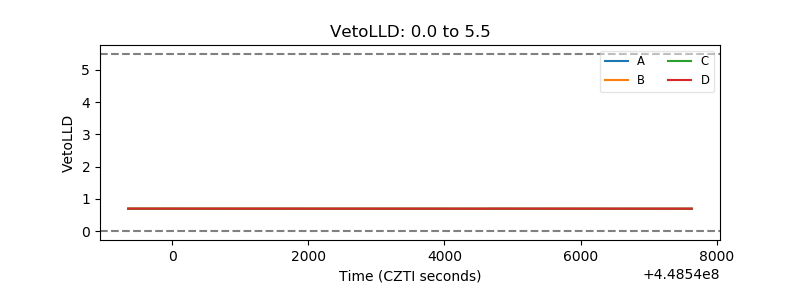 |
| Alpha Counter | 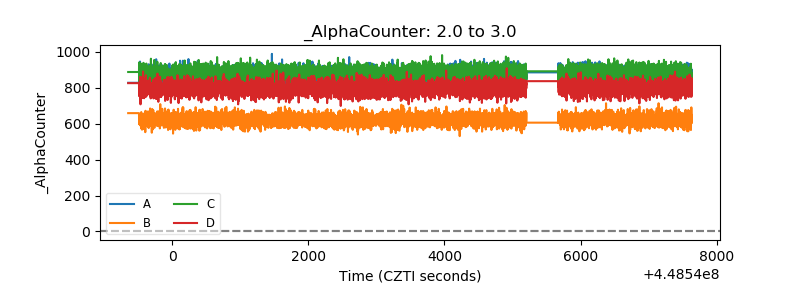 |
| _CPM_Rate | 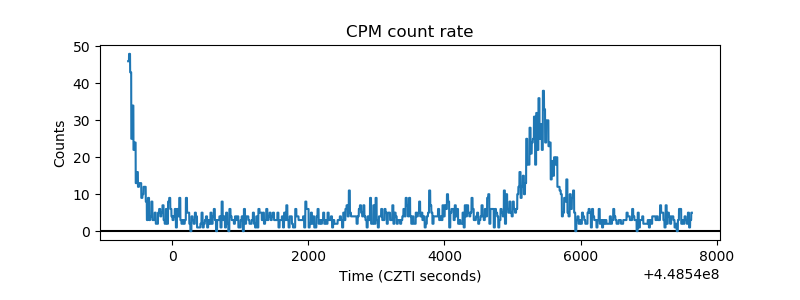 |
| CZT Counter | 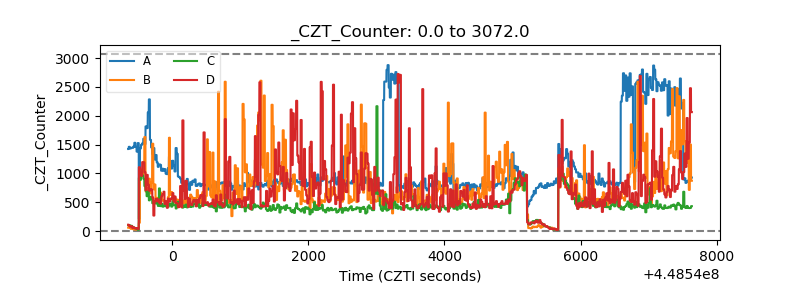 |
| +2.5 Volts monitor | 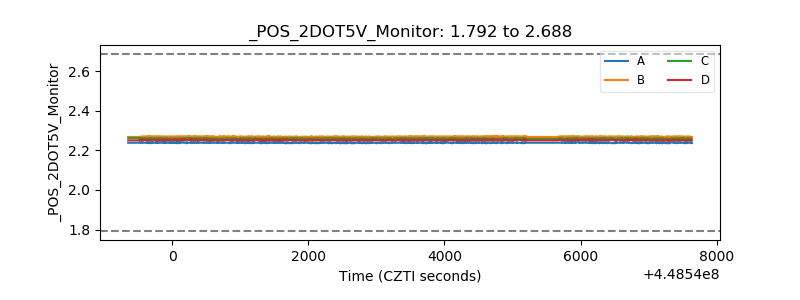 |
| +5 Volts monitor | 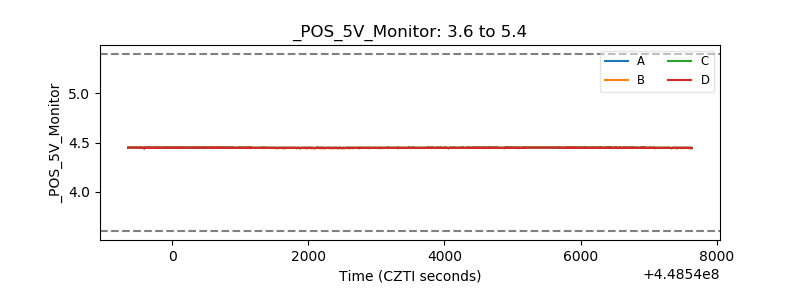 |
| _ROLL_ROT | 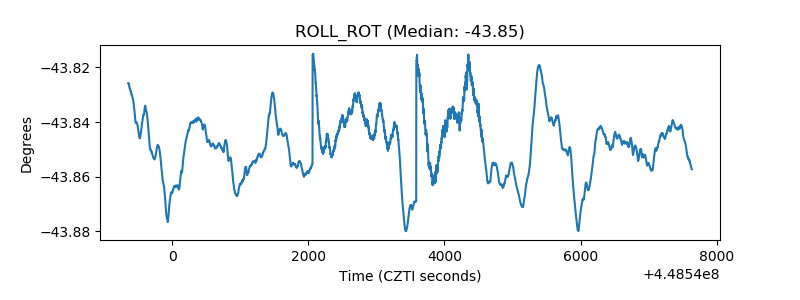 |
| _Roll_DEC | 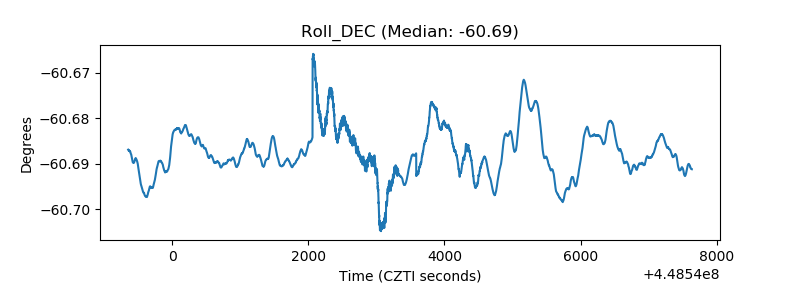 |
| _Roll_RA | 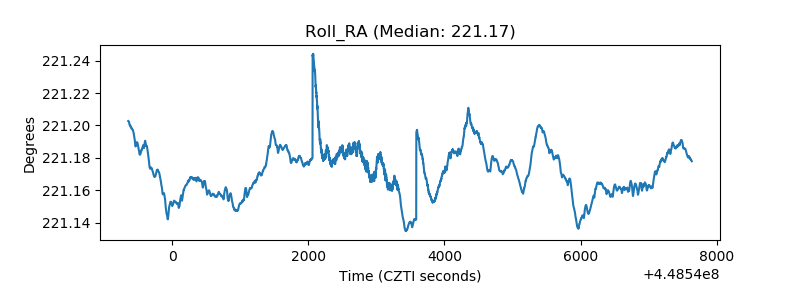 |
| Veto Counter | 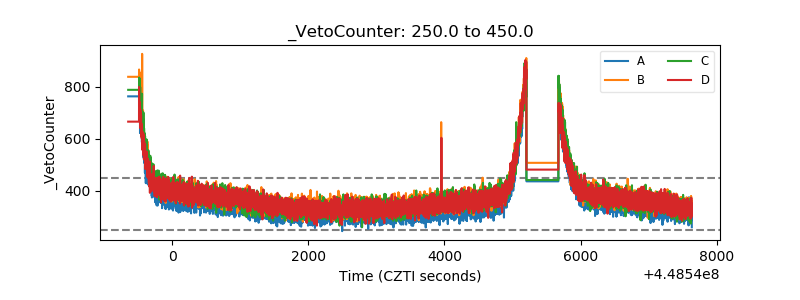 |