| Param | Original file | Final file |
|---|---|---|
| Filename | modeM0/AS1T05_185T01_9000006128_45826cztM0_level2.fits | modeM0/AS1T05_185T01_9000006128_45826cztM0_level2_quad_clean.evt |
| Size (bytes) | 831,980,160 | 117,498,240 |
| Size | 793.4 MB | 112.1 MB |
| Events in quadrant A | 9,650,808 | 674,513 |
| Events in quadrant B | 8,555,299 | 788,630 |
| Events in quadrant C | 3,748,748 | 861,570 |
| Events in quadrant D | 8,224,478 | 677,152 |
| Mode SS | |||
|---|---|---|---|
| Quadrant | BADHDUFLAG | Total packets | Discarded packets |
| A | 0 | 160 | 0 |
| B | 0 | 160 | 0 |
| C | 0 | 160 | 0 |
| D | 0 | 160 | 0 |
| Mode M0 | |||
|---|---|---|---|
| Quadrant | BADHDUFLAG | Total packets | Discarded packets |
| A | 0 | 33696 | 3 |
| B | 0 | 31066 | 1 |
| C | 0 | 16961 | 1 |
| D | 0 | 29994 | 1 |
| Quadrant | Total seconds | Saturated seconds | Saturation percentage |
|---|---|---|---|
| A | 7989 | 1953 | 24.446113% |
| B | 7990 | 1285 | 16.082603% |
| C | 7990 | 94 | 1.176471% |
| D | 7990 | 1171 | 14.655820% |
Noise dominated data is calculated using 1-second bins in cleaned event files. If a bin has >2000 counts, and if more than 50% of those come from <1% of pixels, then it is considered to be noise-dominated and hence unusable.
| Quadrant | # 1 sec bins | Bins with >0 counts | Bins with >2000 counts | High rate bins dominated by noise | Noise dominated (total time) | Noise dominated (detector-on time) | Marked lightcurve |
|---|---|---|---|---|---|---|---|
| A | 8004 | 7990 | 1373 | 1373 | 17.15% | 17.18% | 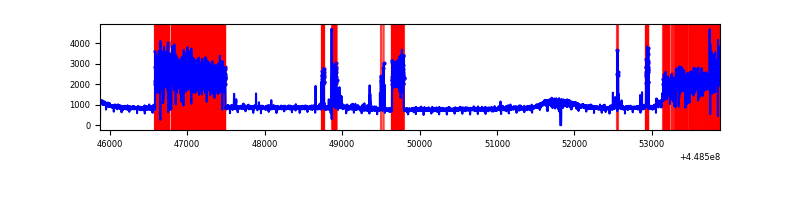 |
| B | 8005 | 7991 | 607 | 607 | 7.58% | 7.60% | 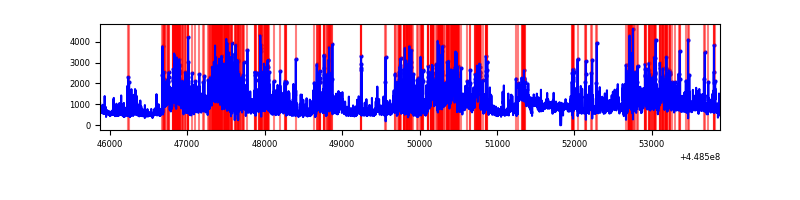 |
| C | 8005 | 7991 | 4 | 4 | 0.05% | 0.05% | 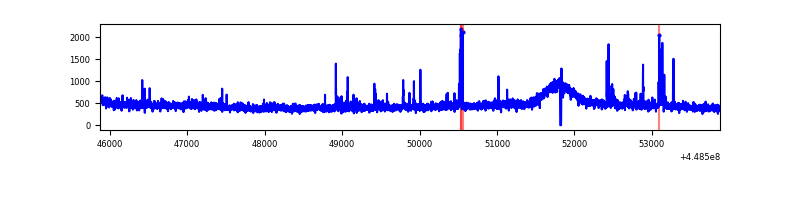 |
| D | 8005 | 7991 | 881 | 881 | 11.01% | 11.02% | 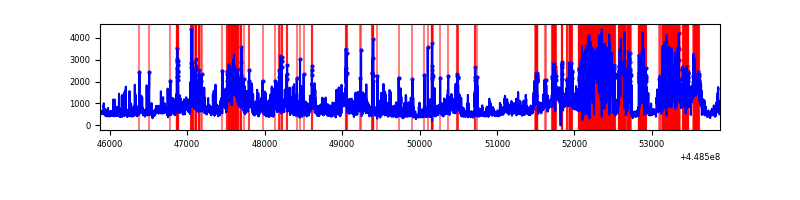 |
Top three noisy pixels from each quadrant. If the there are fewer than three noisy pixels in the level2.evt file, extra rows are filled as -1
| Pixel properties | Quadrant properties | ||||||
|---|---|---|---|---|---|---|---|
| Quadrant | DetID | PixID | Counts | Sigma | Mean | Median | Sigma |
| A | 10 | 83 | 2938521 | 16531.06 | 847 | 825 | 177.7 |
| A | 15 | 14 | 2411184 | 13563.62 | 847 | 825 | 177.7 |
| A | 7 | 3 | 818269 | 4599.94 | 847 | 825 | 177.7 |
| B | 3 | 112 | 4353123 | 24948.91 | 883 | 856 | 174.4 |
| B | 4 | 171 | 332583 | 1901.59 | 883 | 856 | 174.4 |
| B | 0 | 171 | 112011 | 637.18 | 883 | 856 | 174.4 |
| C | 1 | 3 | 84716 | 391.57 | 911 | 917 | 214.0 |
| C | 3 | 233 | 57192 | 262.96 | 911 | 917 | 214.0 |
| C | 12 | 250 | 48176 | 220.83 | 911 | 917 | 214.0 |
| D | 12 | 2 | 2218124 | 10445.68 | 843 | 815 | 212.3 |
| D | 11 | 241 | 1226234 | 5772.92 | 843 | 815 | 212.3 |
| D | 1 | 52 | 375971 | 1767.35 | 843 | 815 | 212.3 |
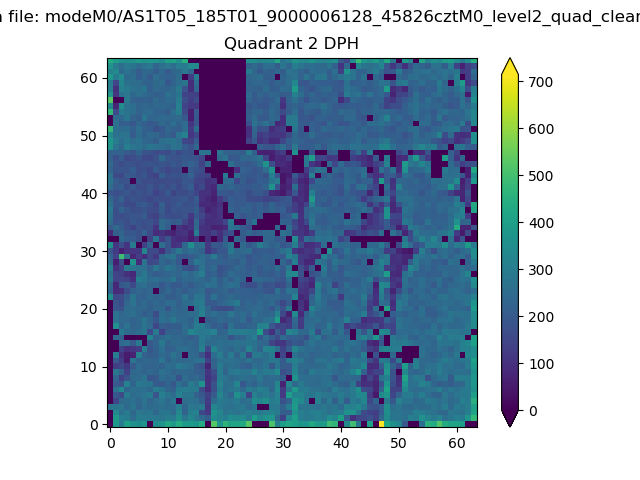
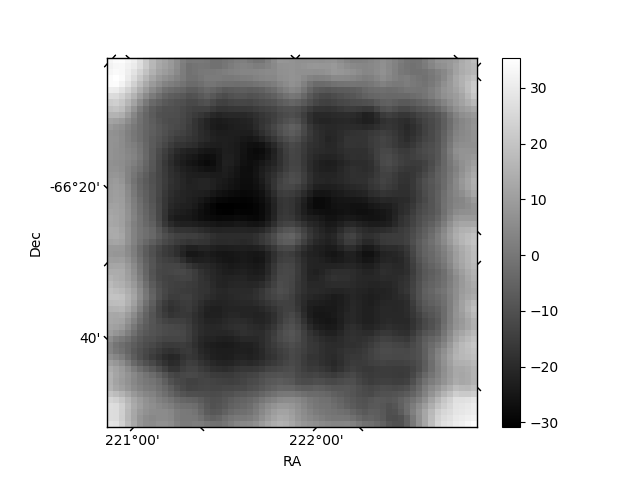
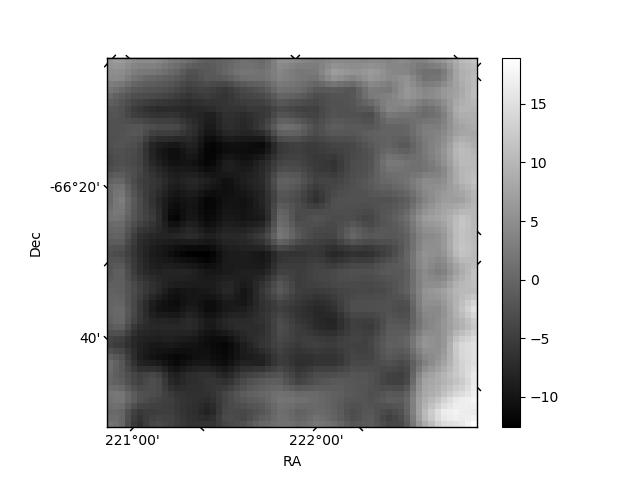
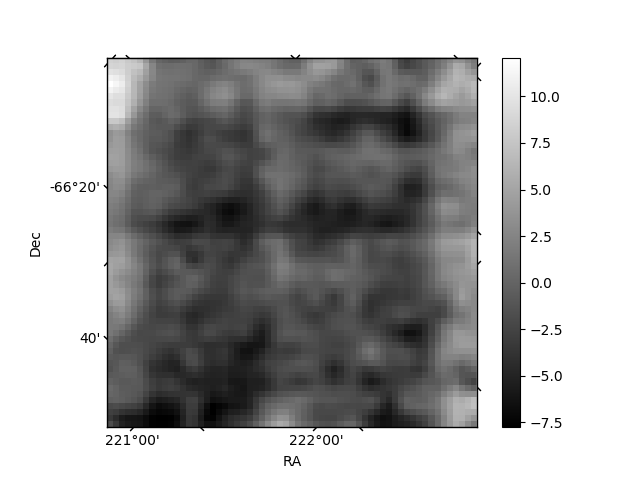
Histogram calculated using DETX and DETY for each event in the final _common_clean file
| Quadrant A | 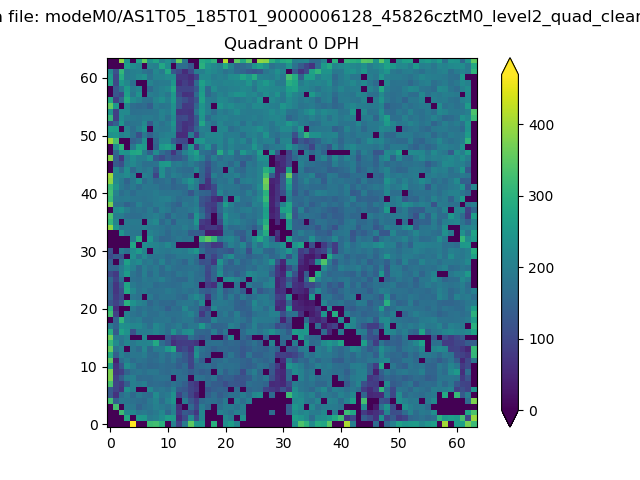 |
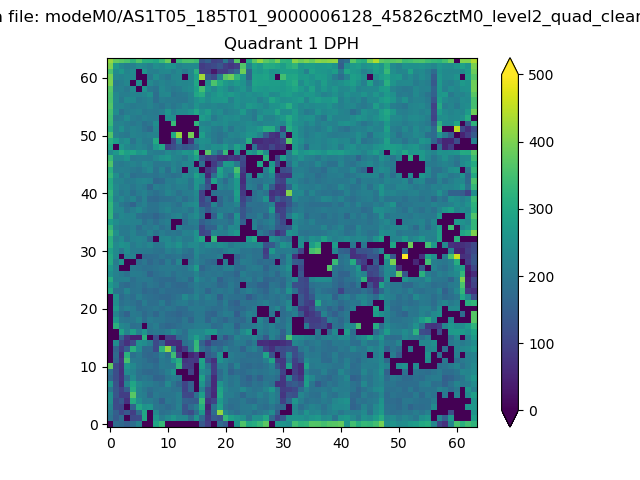 |
Quadrant B |
|---|---|---|---|
| Quadrant D | 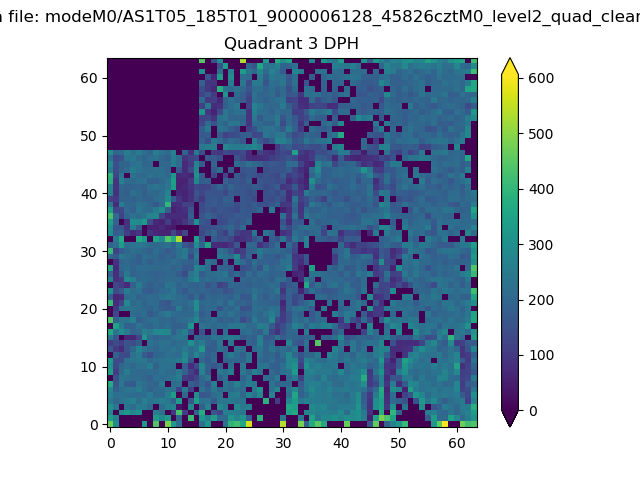 |
 |
Quadrant C |
| Plot type | Count rate plots | Images |
|---|---|---|
| Comparison with Poisson distribution Blue bars denote a histogram of data divided into 1 sec bins. Red curve is a Poisson curve with rate = median count rate of data. |
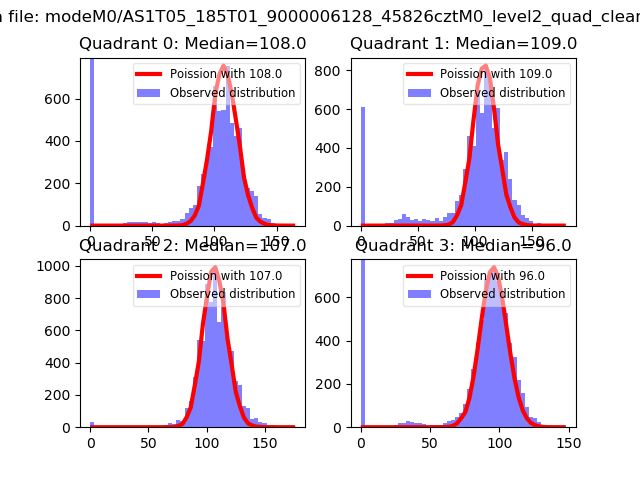 |
 |
| Quadrant-wise count rates Data is divided into 100 sec bins |
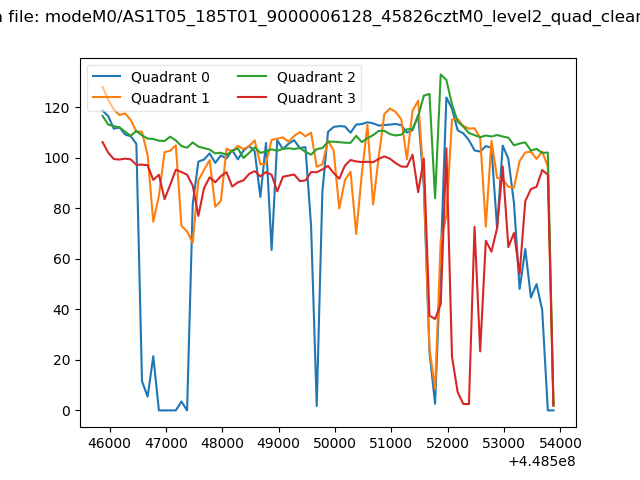 |
|
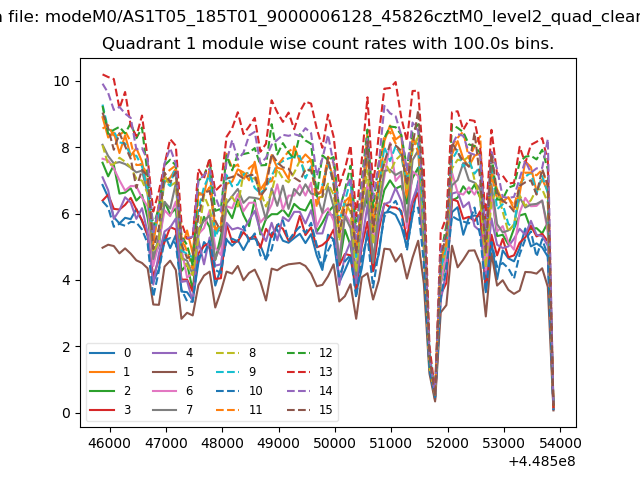
| Module-wise count rates for Quadrant A Data is divided into 100 sec bins |
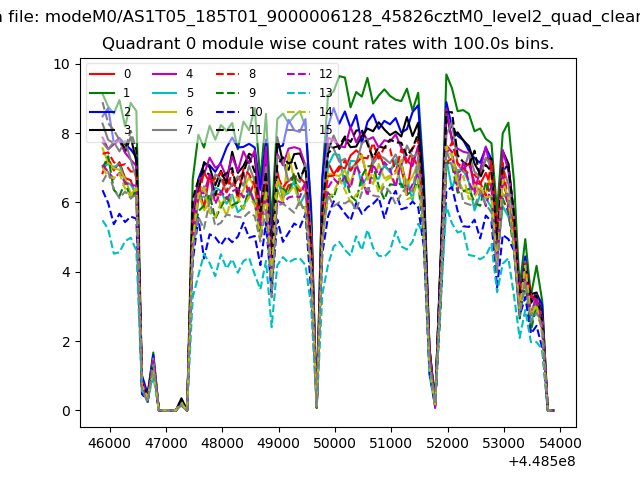 |
 |
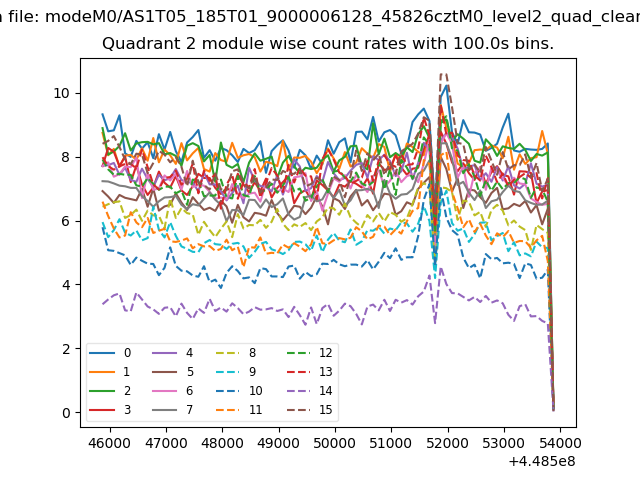
| Module-wise count rates for Quadrant B Data is divided into 100 sec bins |
 |
 |
| Module-wise count rates for Quadrant C Data is divided into 100 sec bins |
 |
 |
| Module-wise count rates for Quadrant D Data is divided into 100 sec bins |
 |
 |
| Parameter | Plot |
|---|---|
| CZT HV Monitor | 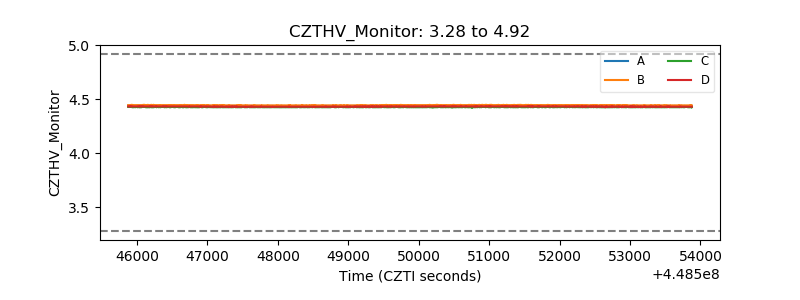 |
| D_VDD | 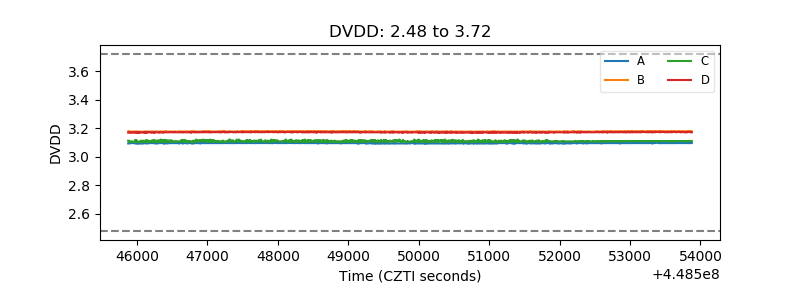 |
| Temperature 1 | 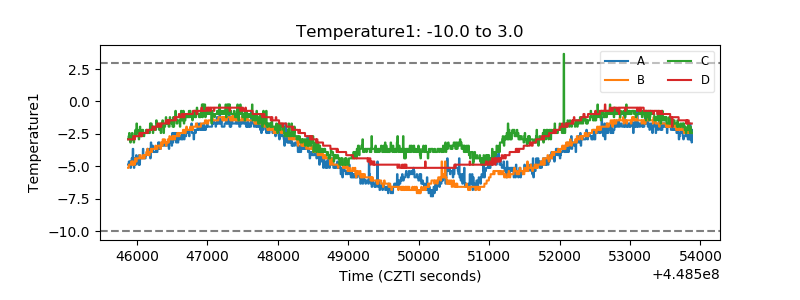 |
| Veto HV Monitor | 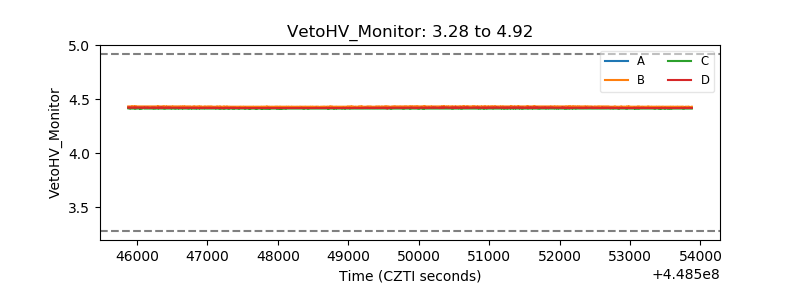 |
| Veto LLD | 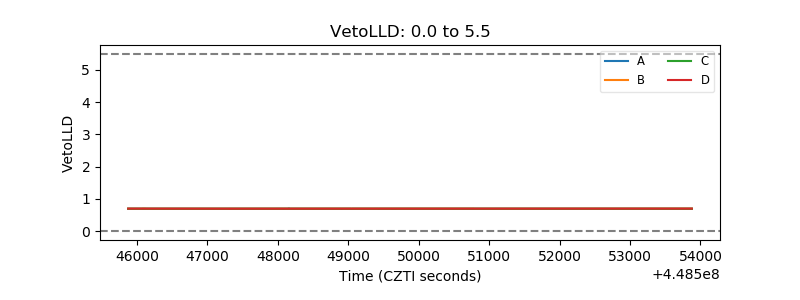 |
| Alpha Counter | 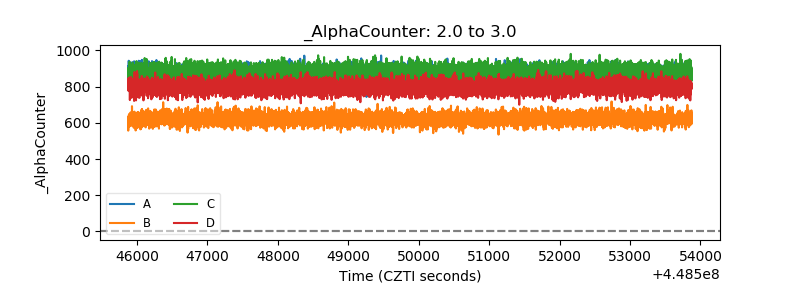 |
| _CPM_Rate | 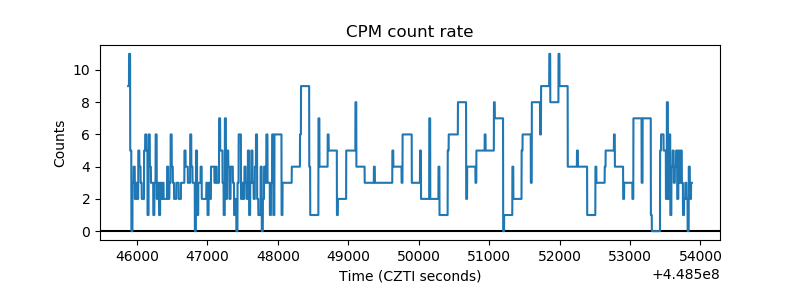 |
| CZT Counter | 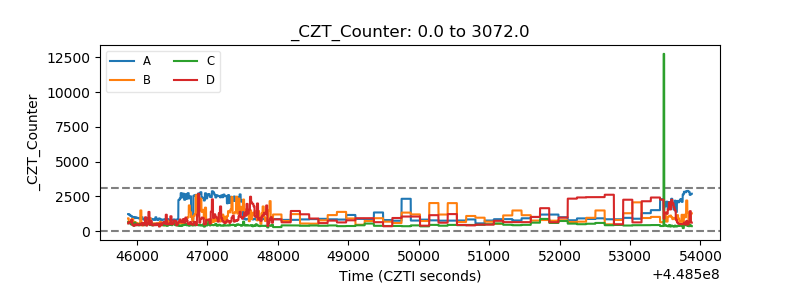 |
| +2.5 Volts monitor | 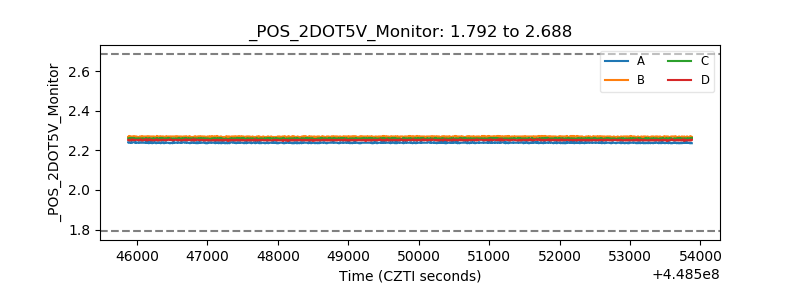 |
| +5 Volts monitor | 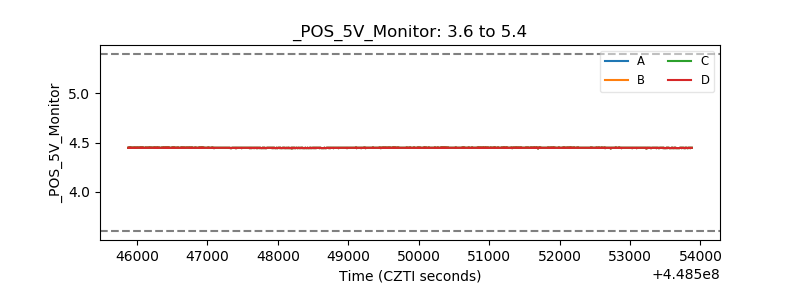 |
| _ROLL_ROT |  |
| _Roll_DEC | 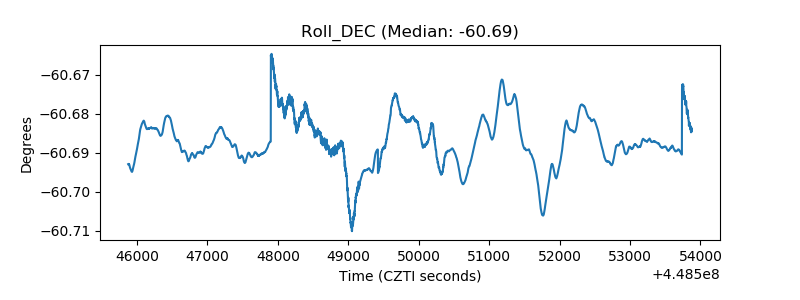 |
| _Roll_RA | 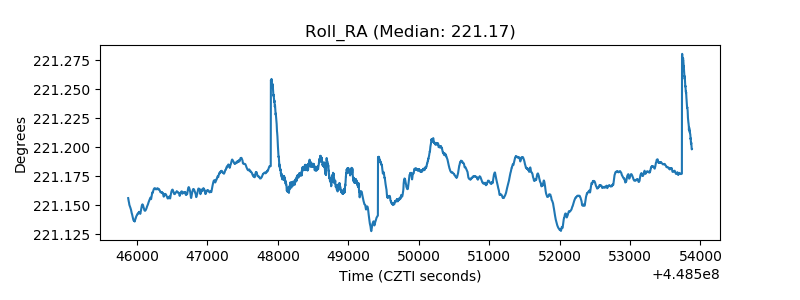 |
| Veto Counter | 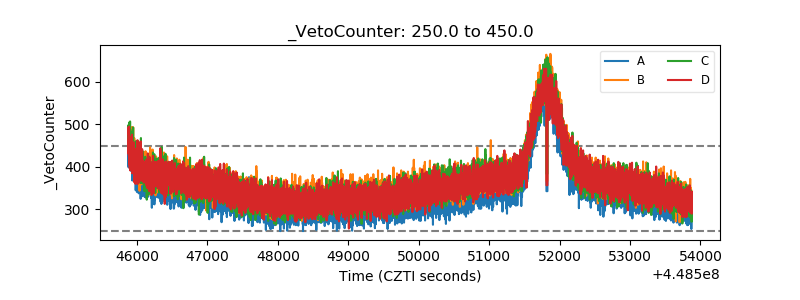 |