| Param | Original file | Final file |
|---|---|---|
| Filename | modeM0/AS1T05_185T01_9000006128_45831cztM0_level2.fits | modeM0/AS1T05_185T01_9000006128_45831cztM0_level2_quad_clean.evt |
| Size (bytes) | 2,347,130,880 | 371,727,360 |
| Size | 2.2 GB | 354.5 MB |
| Events in quadrant A | 25,125,119 | 2,395,408 |
| Events in quadrant B | 19,963,838 | 2,583,094 |
| Events in quadrant C | 13,179,438 | 2,547,172 |
| Events in quadrant D | 26,725,620 | 2,040,103 |
| Mode SS | |||
|---|---|---|---|
| Quadrant | BADHDUFLAG | Total packets | Discarded packets |
| A | 0 | 498 | 0 |
| B | 0 | 498 | 0 |
| C | 0 | 498 | 0 |
| D | 0 | 498 | 0 |
| Mode M0 | |||
|---|---|---|---|
| Quadrant | BADHDUFLAG | Total packets | Discarded packets |
| A | 0 | 91497 | 3 |
| B | 0 | 76257 | 3 |
| C | 0 | 56678 | 4 |
| D | 0 | 96671 | 3 |
| Mode M9 | |||
|---|---|---|---|
| Quadrant | BADHDUFLAG | Total packets | Discarded packets |
| A | 0 | 19 | 0 |
| B | 0 | 19 | 0 |
| C | 0 | 19 | 0 |
| D | 0 | 19 | 0 |
| Quadrant | Total seconds | Saturated seconds | Saturation percentage |
|---|---|---|---|
| A | 24537 | 2559 | 10.429148% |
| B | 24538 | 1689 | 6.883202% |
| C | 24537 | 666 | 2.714268% |
| D | 24537 | 3980 | 16.220402% |
Noise dominated data is calculated using 1-second bins in cleaned event files. If a bin has >2000 counts, and if more than 50% of those come from <1% of pixels, then it is considered to be noise-dominated and hence unusable.
| Quadrant | # 1 sec bins | Bins with >0 counts | Bins with >2000 counts | High rate bins dominated by noise | Noise dominated (total time) | Noise dominated (detector-on time) | Marked lightcurve |
|---|---|---|---|---|---|---|---|
| A | 26377 | 24540 | 1852 | 1852 | 7.02% | 7.55% | 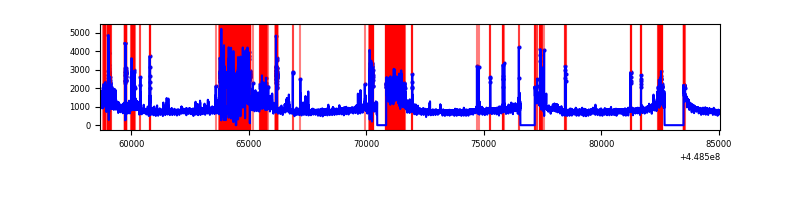 |
| B | 26378 | 24542 | 748 | 748 | 2.84% | 3.05% | 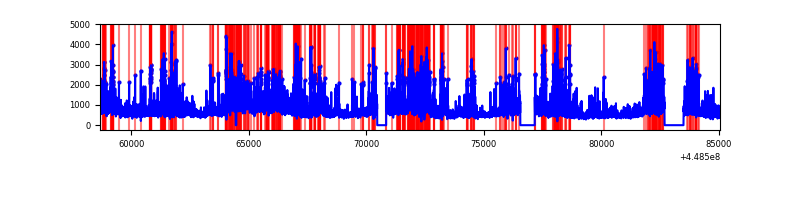 |
| C | 26377 | 24541 | 584 | 584 | 2.21% | 2.38% | 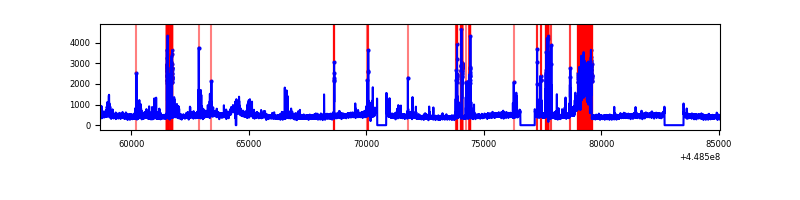 |
| D | 26377 | 24540 | 3334 | 3334 | 12.64% | 13.59% | 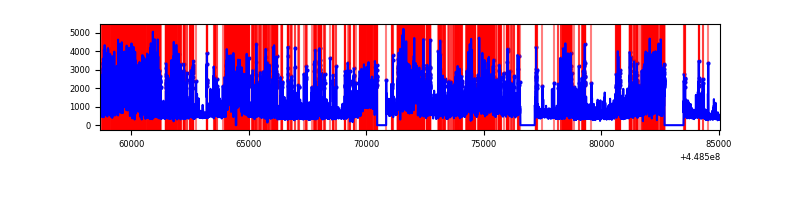 |
Top three noisy pixels from each quadrant. If the there are fewer than three noisy pixels in the level2.evt file, extra rows are filled as -1
| Pixel properties | Quadrant properties | ||||||
|---|---|---|---|---|---|---|---|
| Quadrant | DetID | PixID | Counts | Sigma | Mean | Median | Sigma |
| A | 10 | 83 | 9542002 | 18203.41 | 2546 | 2493 | 524.1 |
| A | 15 | 14 | 3394856 | 6473.35 | 2546 | 2493 | 524.1 |
| A | 7 | 3 | 2034263 | 3877.05 | 2546 | 2493 | 524.1 |
| B | 3 | 112 | 7497121 | 14512.04 | 2658 | 2573 | 516.4 |
| B | 4 | 171 | 778357 | 1502.19 | 2658 | 2573 | 516.4 |
| B | 0 | 171 | 391842 | 753.76 | 2658 | 2573 | 516.4 |
| C | 1 | 3 | 1890258 | 3024.17 | 2656 | 2672 | 624.2 |
| C | 12 | 2 | 795707 | 1270.55 | 2656 | 2672 | 624.2 |
| C | 3 | 233 | 76997 | 119.08 | 2656 | 2672 | 624.2 |
| D | 12 | 2 | 4962933 | 7901.1 | 2465 | 2386 | 627.8 |
| D | 11 | 241 | 4008926 | 6381.57 | 2465 | 2386 | 627.8 |
| D | 12 | 1 | 1868612 | 2972.5 | 2465 | 2386 | 627.8 |
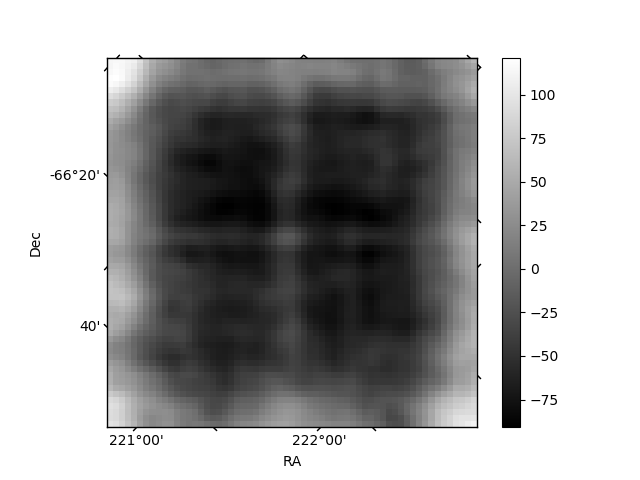
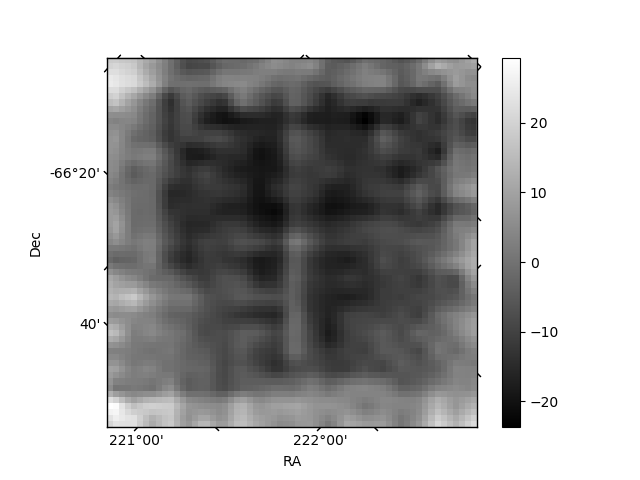
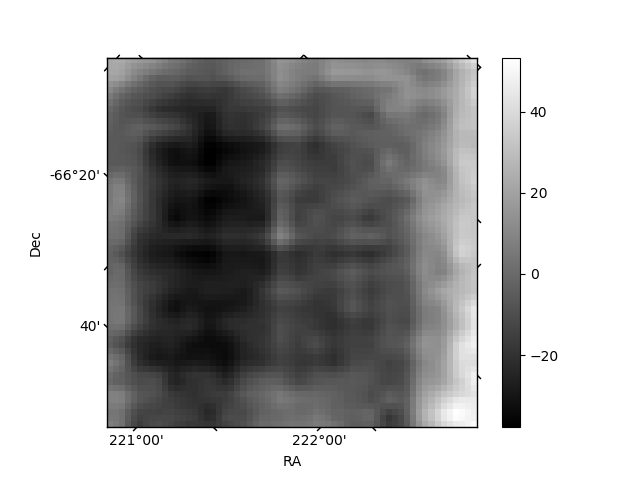
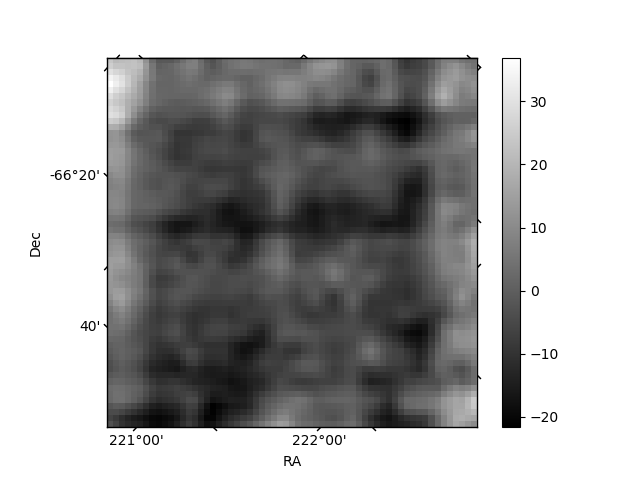
Histogram calculated using DETX and DETY for each event in the final _common_clean file
| Quadrant A | 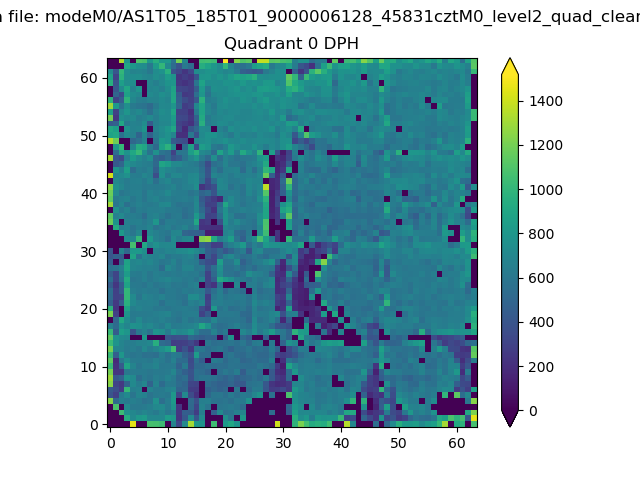 |
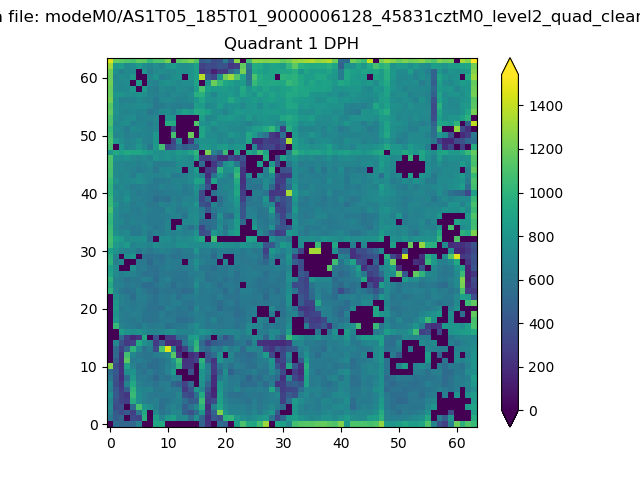 |
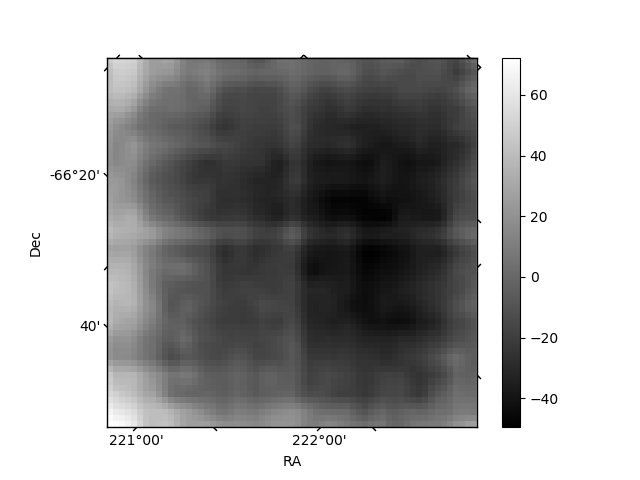
Quadrant B |
|---|---|---|---|
| Quadrant D | 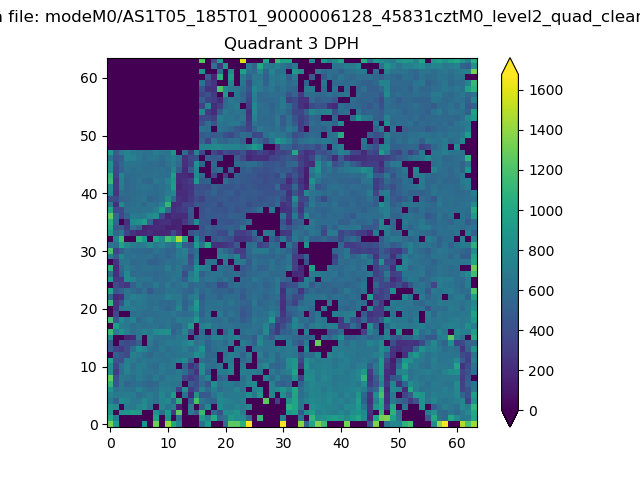 |
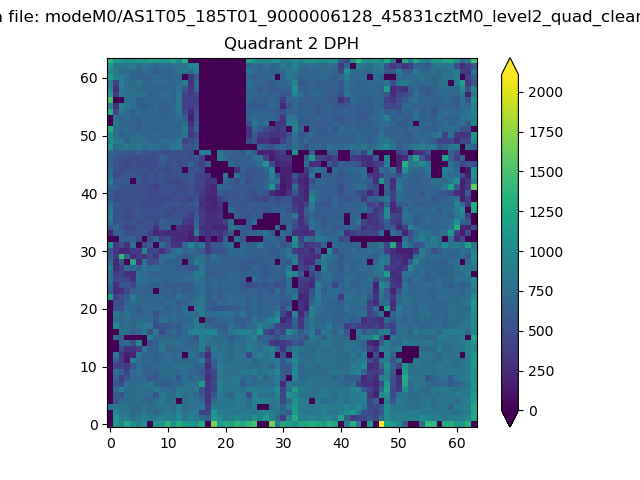 |
Quadrant C |
| Plot type | Count rate plots | Images |
|---|---|---|
| Comparison with Poisson distribution Blue bars denote a histogram of data divided into 1 sec bins. Red curve is a Poisson curve with rate = median count rate of data. |
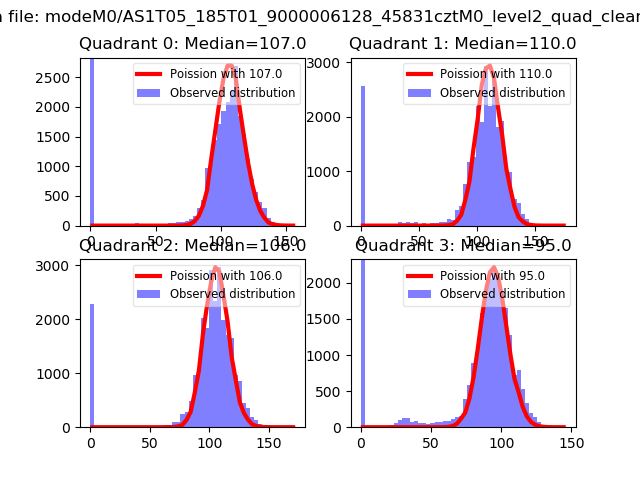 |
 |
| Quadrant-wise count rates Data is divided into 100 sec bins |
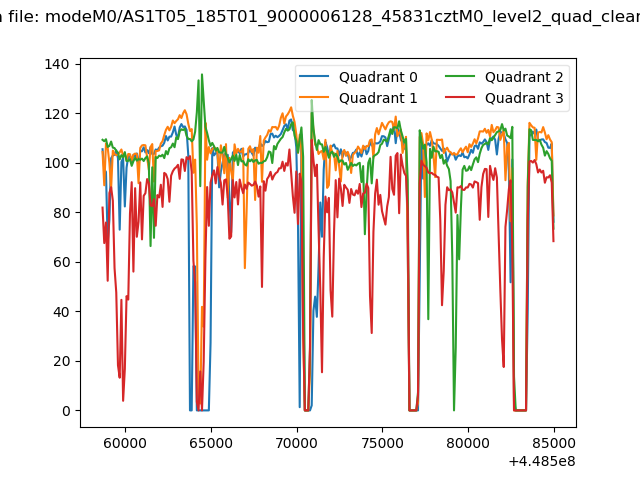 |
|
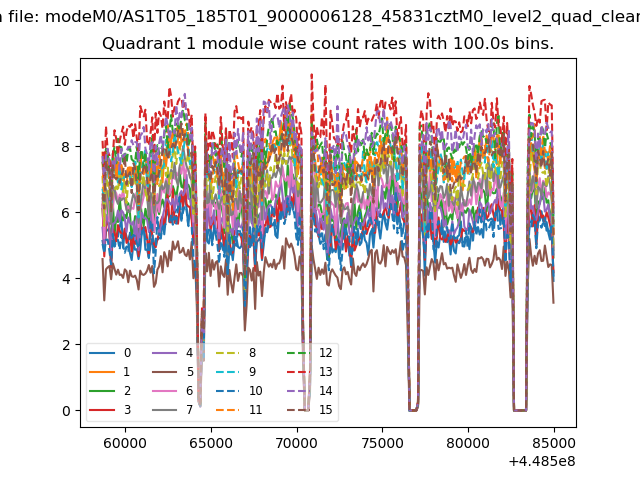
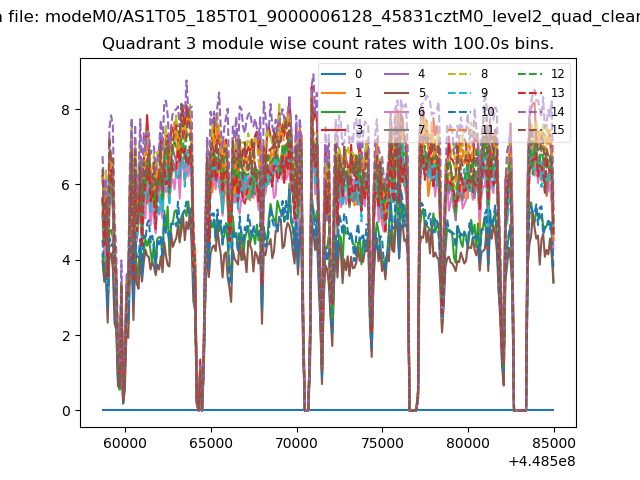
| Module-wise count rates for Quadrant A Data is divided into 100 sec bins |
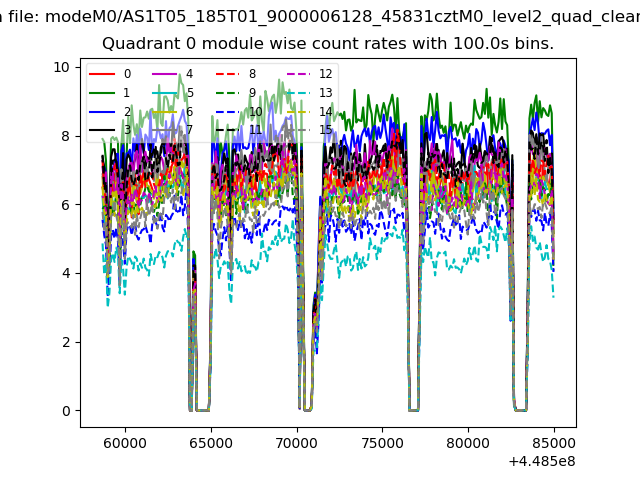 |
 |
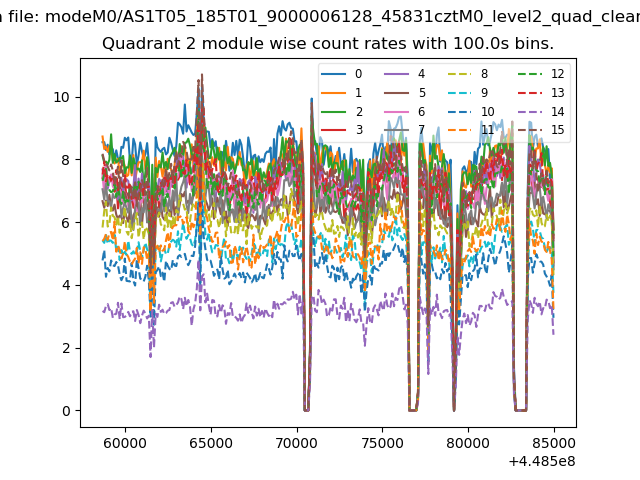
| Module-wise count rates for Quadrant B Data is divided into 100 sec bins |
 |
 |
| Module-wise count rates for Quadrant C Data is divided into 100 sec bins |
 |
 |
| Module-wise count rates for Quadrant D Data is divided into 100 sec bins |
 |
 |
| Parameter | Plot |
|---|---|
| CZT HV Monitor | 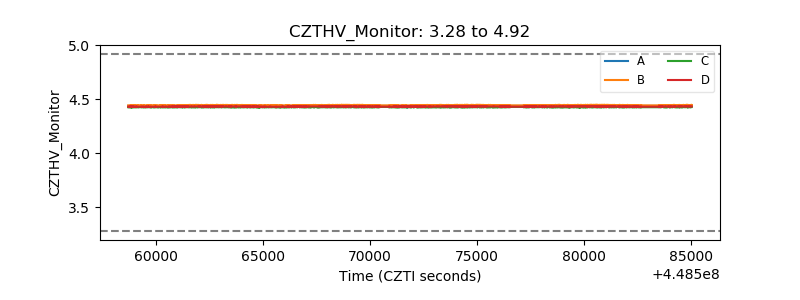 |
| D_VDD | 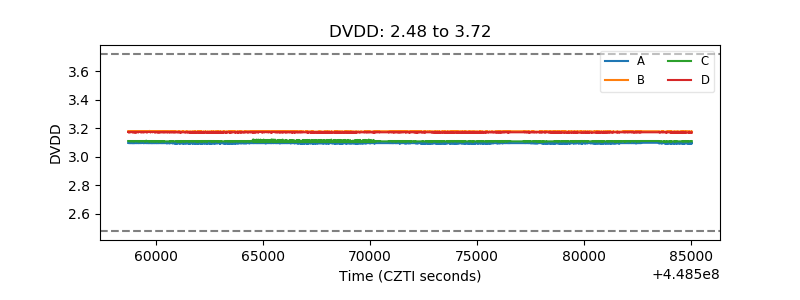 |
| Temperature 1 | 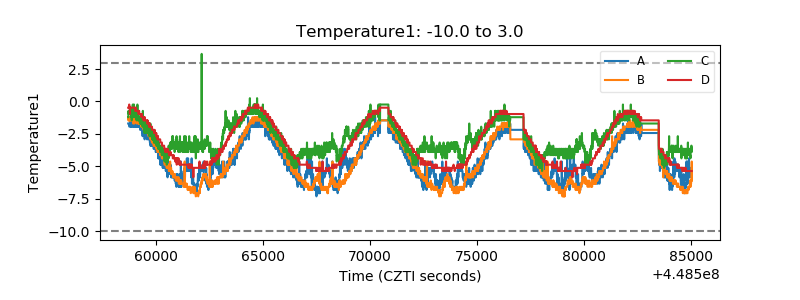 |
| Veto HV Monitor |  |
| Veto LLD | 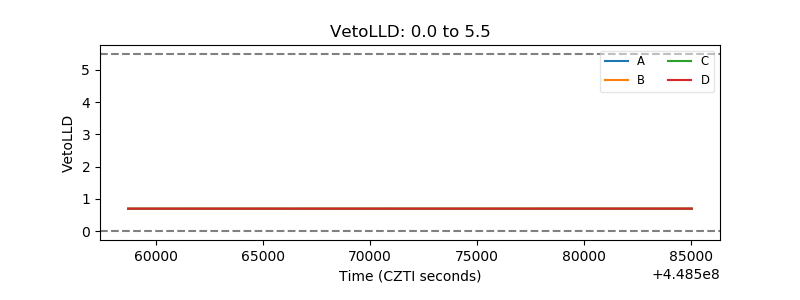 |
| Alpha Counter | 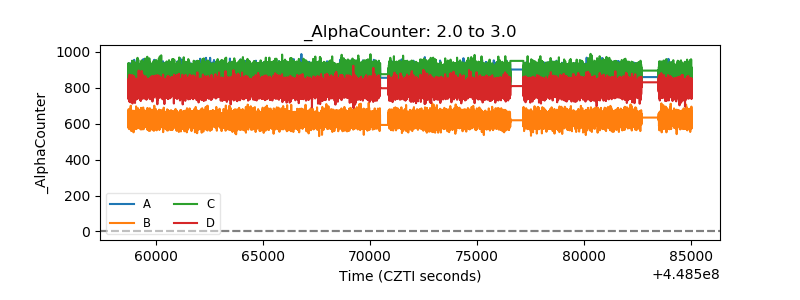 |
| _CPM_Rate | 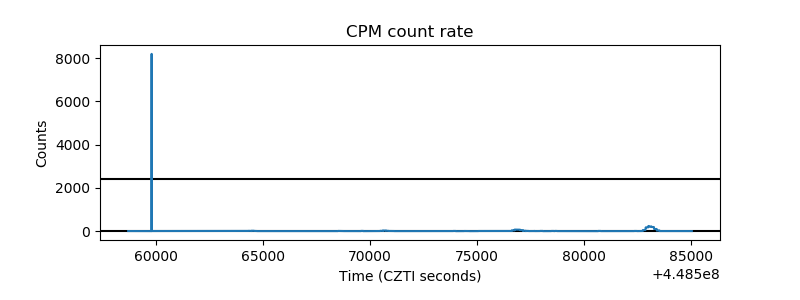 |
| CZT Counter | 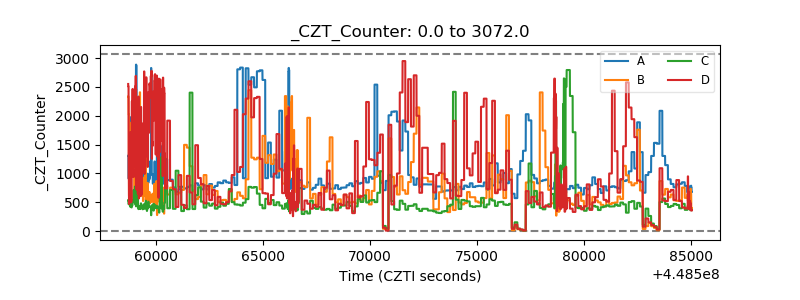 |
| +2.5 Volts monitor | 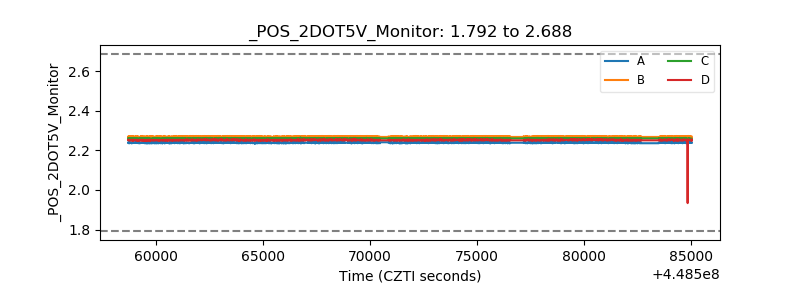 |
| +5 Volts monitor | 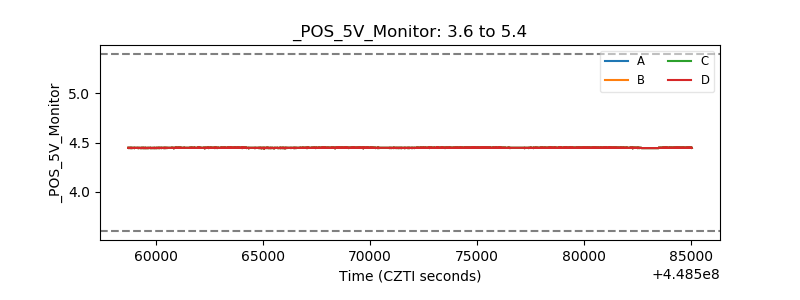 |
| _ROLL_ROT |  |
| _Roll_DEC | 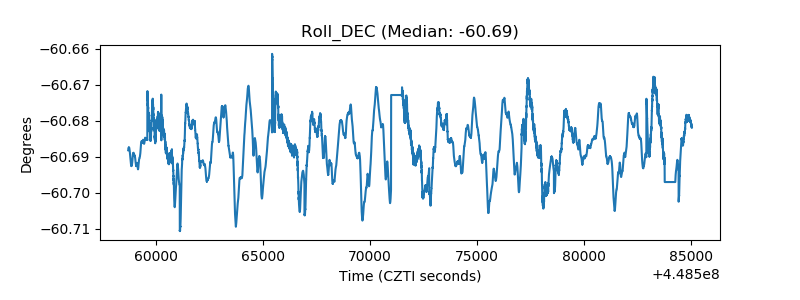 |
| _Roll_RA | 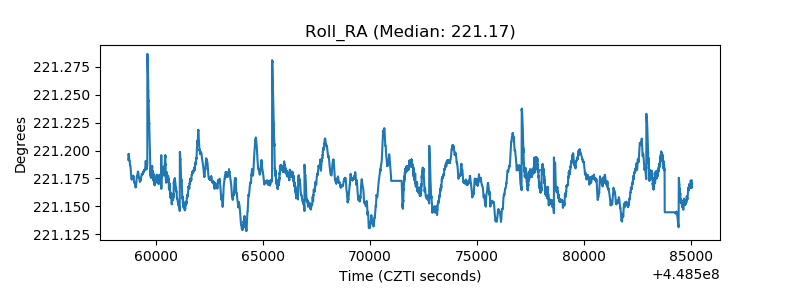 |
| Veto Counter | 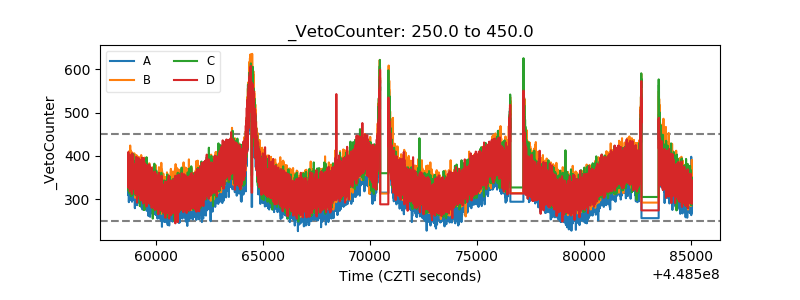 |