| Param | Original file | Final file |
|---|---|---|
| Filename | modeM0/AS1T05_185T01_9000006128_45832cztM0_level2.fits | modeM0/AS1T05_185T01_9000006128_45832cztM0_level2_quad_clean.evt |
| Size (bytes) | 599,256,000 | 115,084,800 |
| Size | 571.5 MB | 109.8 MB |
| Events in quadrant A | 6,638,588 | 762,951 |
| Events in quadrant B | 5,731,691 | 780,479 |
| Events in quadrant C | 3,448,822 | 773,120 |
| Events in quadrant D | 5,804,970 | 666,084 |
| Mode SS | |||
|---|---|---|---|
| Quadrant | BADHDUFLAG | Total packets | Discarded packets |
| A | 0 | 146 | 0 |
| B | 0 | 146 | 0 |
| C | 0 | 146 | 0 |
| D | 0 | 146 | 0 |
| Mode M0 | |||
|---|---|---|---|
| Quadrant | BADHDUFLAG | Total packets | Discarded packets |
| A | 0 | 24811 | 5 |
| B | 0 | 21930 | 2 |
| C | 0 | 15427 | 2 |
| D | 0 | 22387 | 2 |
| Mode M9 | |||
|---|---|---|---|
| Quadrant | BADHDUFLAG | Total packets | Discarded packets |
| A | 0 | 18 | 0 |
| B | 0 | 18 | 0 |
| C | 0 | 18 | 0 |
| D | 0 | 18 | 0 |
| Quadrant | Total seconds | Saturated seconds | Saturation percentage |
|---|---|---|---|
| A | 7216 | 295 | 4.088137% |
| B | 7216 | 441 | 6.111419% |
| C | 7216 | 22 | 0.304878% |
| D | 7217 | 437 | 6.055148% |
Noise dominated data is calculated using 1-second bins in cleaned event files. If a bin has >2000 counts, and if more than 50% of those come from <1% of pixels, then it is considered to be noise-dominated and hence unusable.
| Quadrant | # 1 sec bins | Bins with >0 counts | Bins with >2000 counts | High rate bins dominated by noise | Noise dominated (total time) | Noise dominated (detector-on time) | Marked lightcurve |
|---|---|---|---|---|---|---|---|
| A | 8971 | 7218 | 106 | 106 | 1.18% | 1.47% | 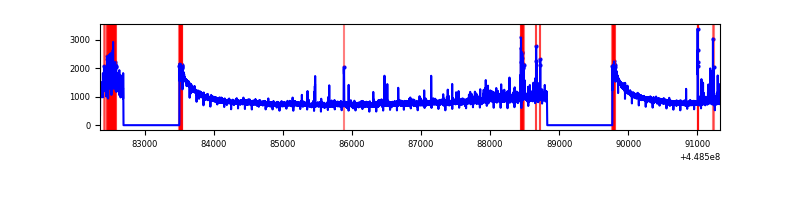 |
| B | 8971 | 7218 | 179 | 179 | 2.00% | 2.48% | 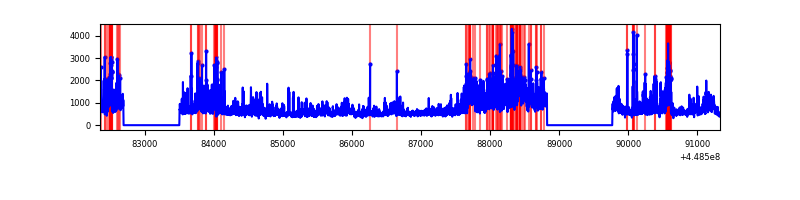 |
| C | 8971 | 7218 | 2 | 2 | 0.02% | 0.03% | 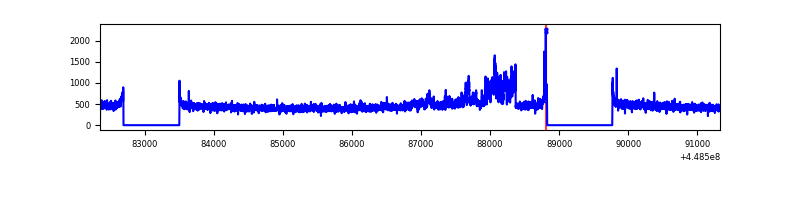 |
| D | 8972 | 7218 | 323 | 323 | 3.60% | 4.47% | 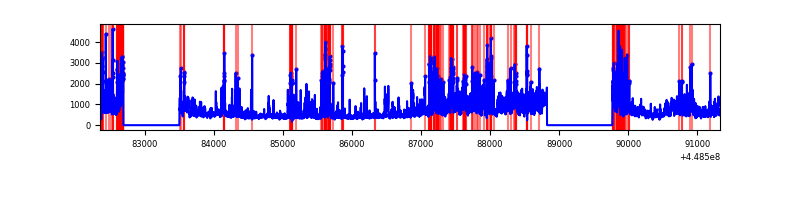 |
Top three noisy pixels from each quadrant. If the there are fewer than three noisy pixels in the level2.evt file, extra rows are filled as -1
| Pixel properties | Quadrant properties | ||||||
|---|---|---|---|---|---|---|---|
| Quadrant | DetID | PixID | Counts | Sigma | Mean | Median | Sigma |
| A | 10 | 83 | 3106852 | 18840.7 | 792 | 774 | 164.9 |
| A | 7 | 3 | 233699 | 1412.87 | 792 | 774 | 164.9 |
| A | 13 | 248 | 128462 | 774.52 | 792 | 774 | 164.9 |
| B | 3 | 112 | 2072591 | 13394.32 | 789 | 762 | 154.7 |
| B | 4 | 171 | 235646 | 1518.52 | 789 | 762 | 154.7 |
| B | 0 | 171 | 146545 | 942.48 | 789 | 762 | 154.7 |
| C | 9 | 54 | 323073 | 1719.51 | 792 | 796 | 187.4 |
| C | 3 | 233 | 27893 | 144.58 | 792 | 796 | 187.4 |
| C | 2 | 14 | 12030 | 59.94 | 792 | 796 | 187.4 |
| D | 11 | 241 | 943269 | 4905.22 | 761 | 737 | 192.1 |
| D | 12 | 2 | 705453 | 3667.55 | 761 | 737 | 192.1 |
| D | 13 | 249 | 520927 | 2707.22 | 761 | 737 | 192.1 |
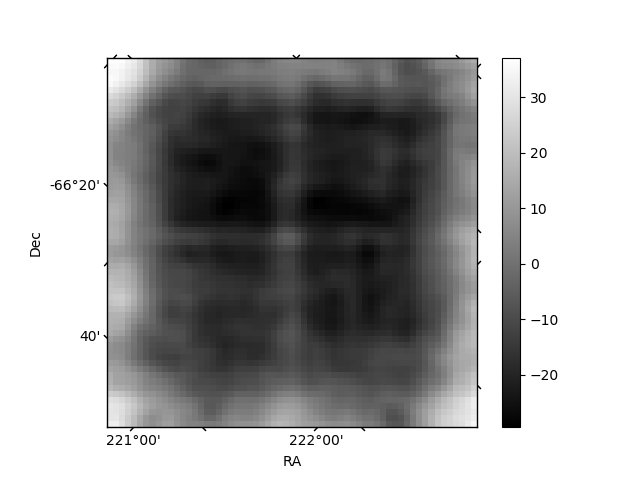
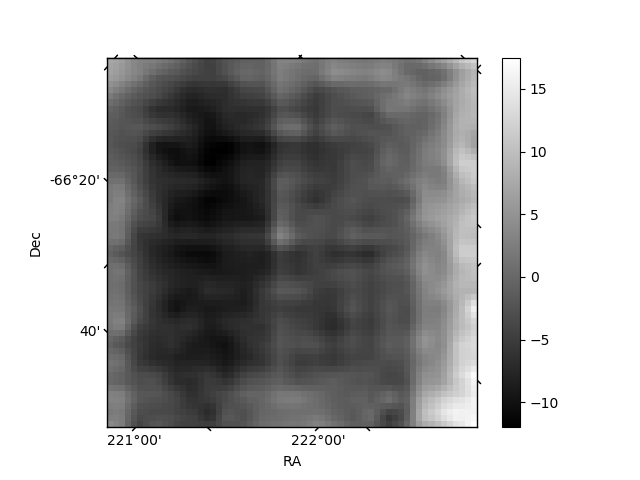
Histogram calculated using DETX and DETY for each event in the final _common_clean file
| Quadrant A | 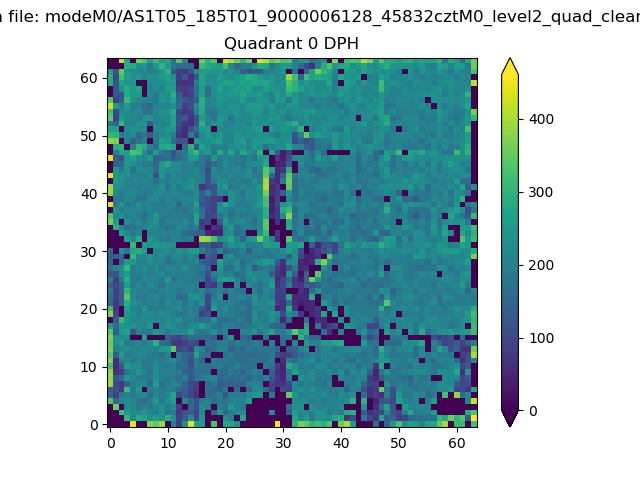 |
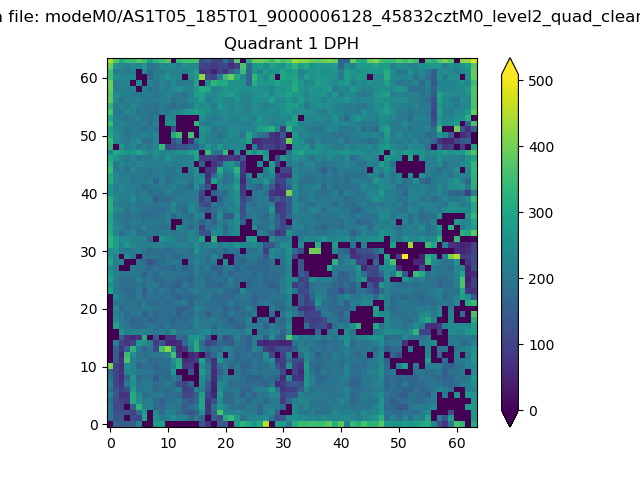 |
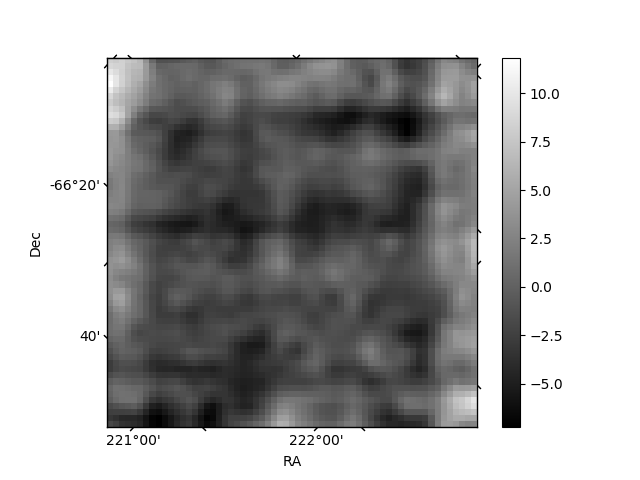
Quadrant B |
|---|---|---|---|
| Quadrant D | 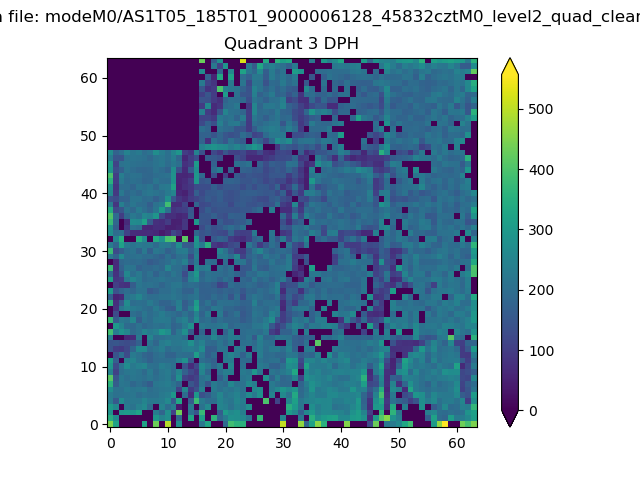 |
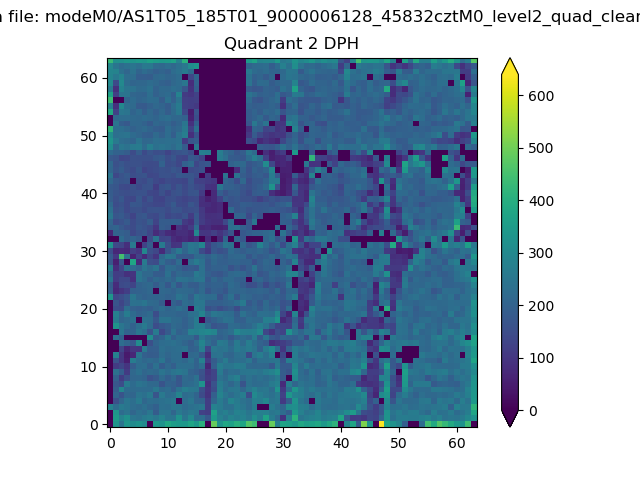 |
Quadrant C |
| Plot type | Count rate plots | Images |
|---|---|---|
| Comparison with Poisson distribution Blue bars denote a histogram of data divided into 1 sec bins. Red curve is a Poisson curve with rate = median count rate of data. |
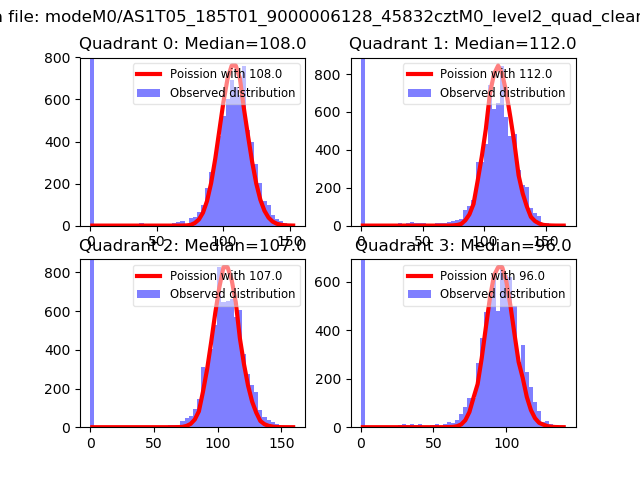 |
 |
| Quadrant-wise count rates Data is divided into 100 sec bins |
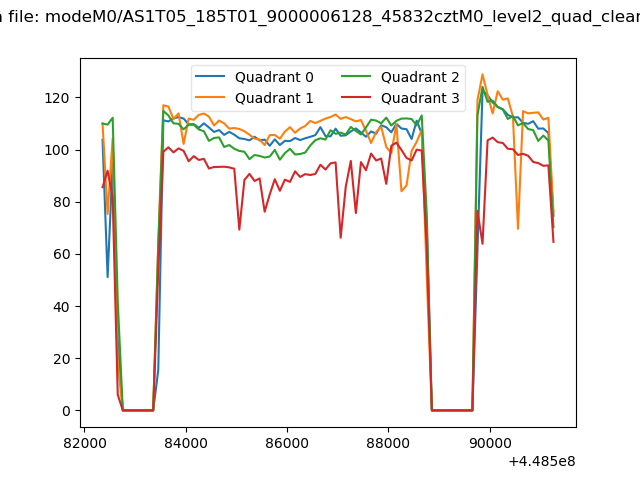 |
|
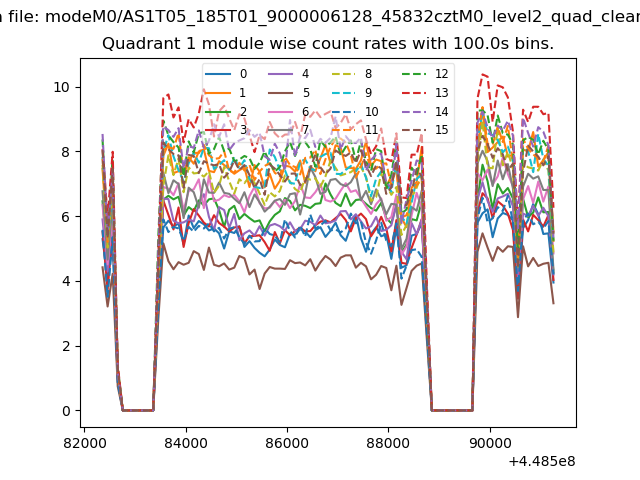
| Module-wise count rates for Quadrant A Data is divided into 100 sec bins |
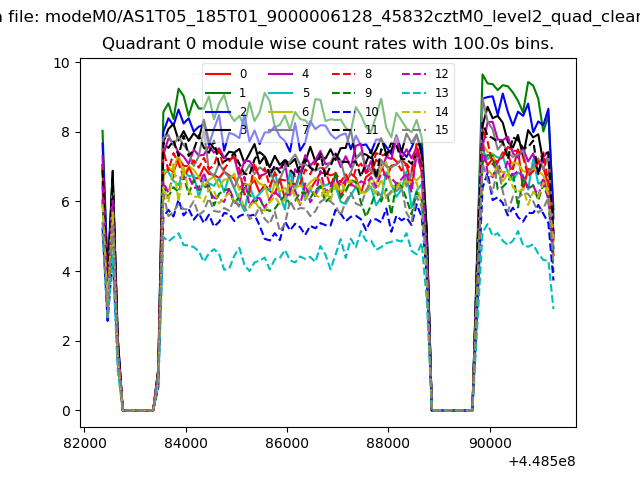 |
 |
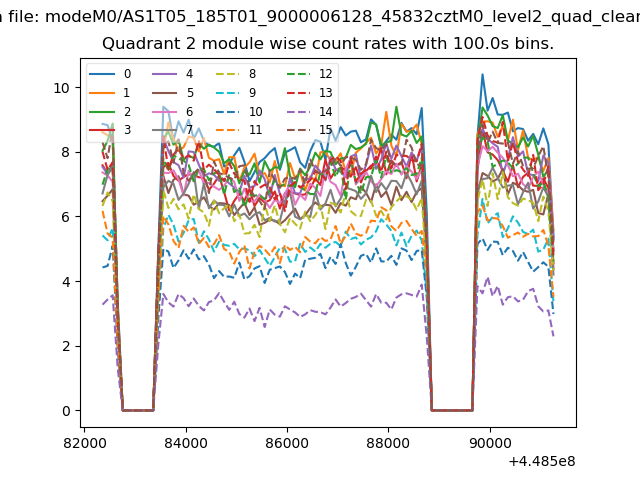
| Module-wise count rates for Quadrant B Data is divided into 100 sec bins |
 |
 |
| Module-wise count rates for Quadrant C Data is divided into 100 sec bins |
 |
 |
| Module-wise count rates for Quadrant D Data is divided into 100 sec bins |
 |
 |
| Parameter | Plot |
|---|---|
| CZT HV Monitor | 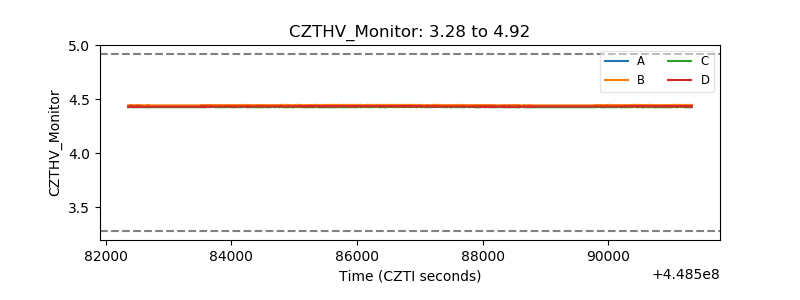 |
| D_VDD | 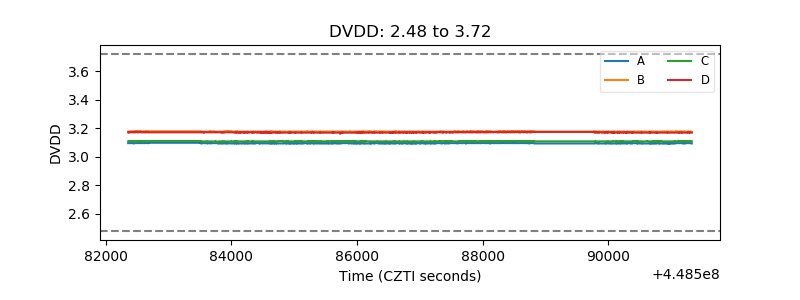 |
| Temperature 1 | 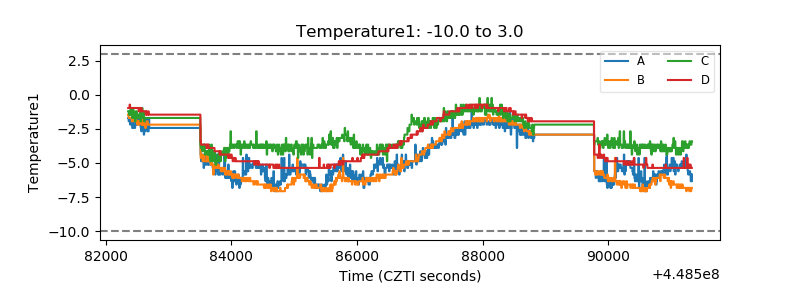 |
| Veto HV Monitor | 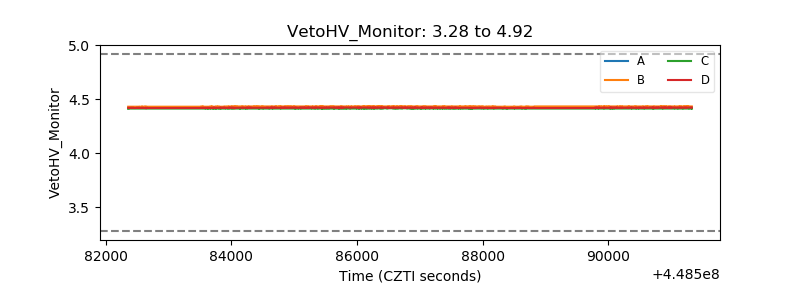 |
| Veto LLD | 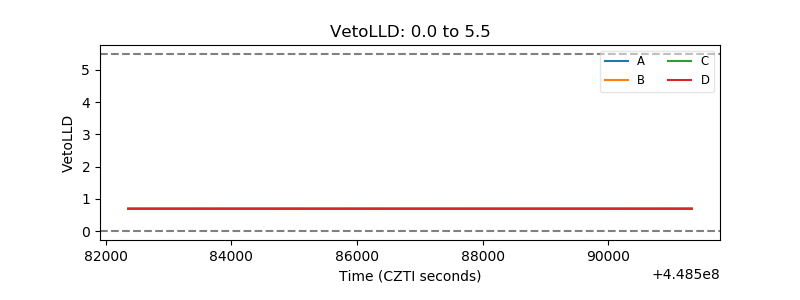 |
| Alpha Counter | 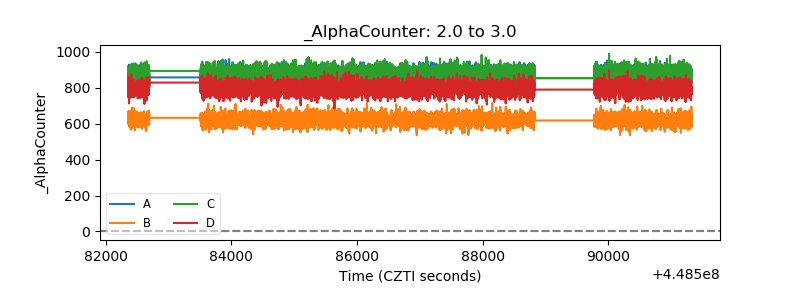 |
| _CPM_Rate | 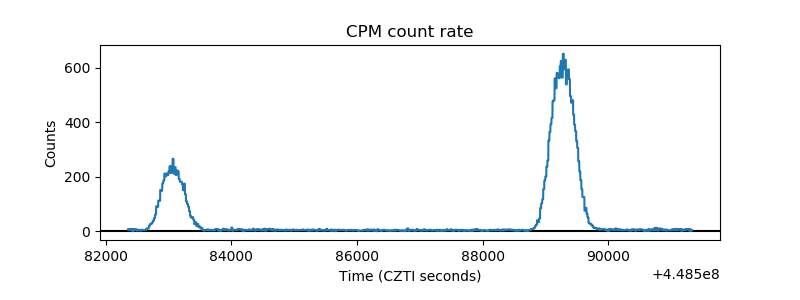 |
| CZT Counter | 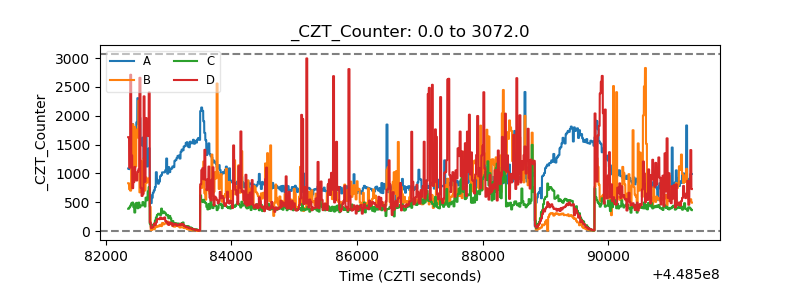 |
| +2.5 Volts monitor | 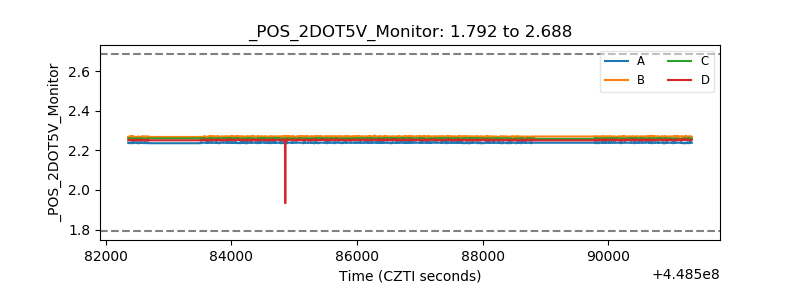 |
| +5 Volts monitor | 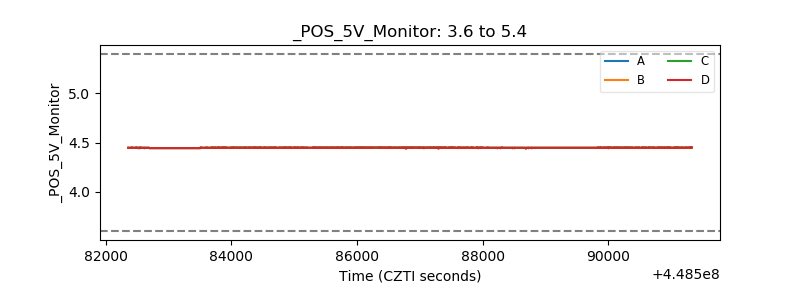 |
| _ROLL_ROT | 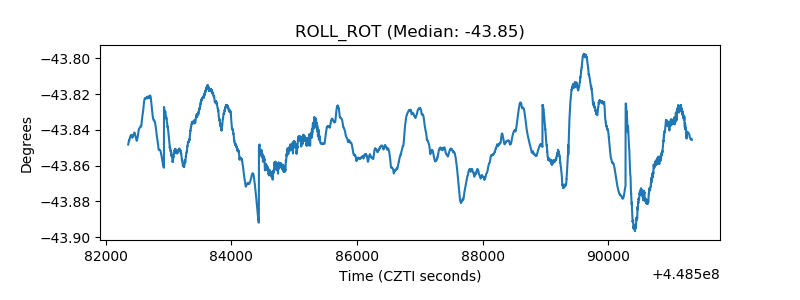 |
| _Roll_DEC | 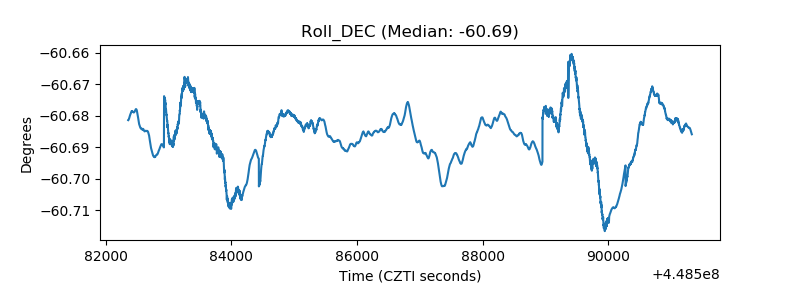 |
| _Roll_RA | 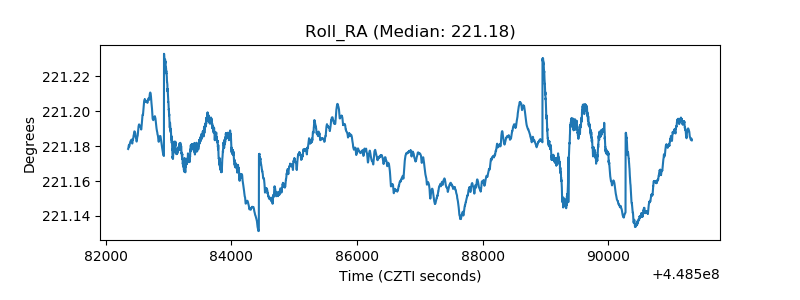 |
| Veto Counter | 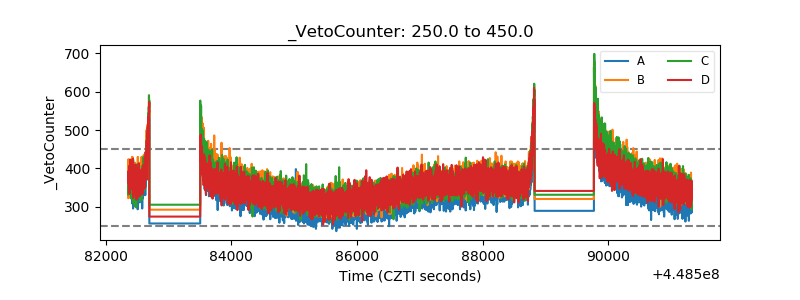 |