| Param | Original file | Final file |
|---|---|---|
| Filename | modeM0/AS1T05_185T01_9000006128_45834cztM0_level2.fits | modeM0/AS1T05_185T01_9000006128_45834cztM0_level2_quad_clean.evt |
| Size (bytes) | 563,365,440 | 108,593,280 |
| Size | 537.3 MB | 103.6 MB |
| Events in quadrant A | 6,027,839 | 726,238 |
| Events in quadrant B | 6,154,467 | 719,371 |
| Events in quadrant C | 2,941,225 | 737,200 |
| Events in quadrant D | 5,218,274 | 643,907 |
| Mode SS | |||
|---|---|---|---|
| Quadrant | BADHDUFLAG | Total packets | Discarded packets |
| A | 0 | 134 | 0 |
| B | 0 | 134 | 0 |
| C | 0 | 134 | 0 |
| D | 0 | 134 | 0 |
| Mode M0 | |||
|---|---|---|---|
| Quadrant | BADHDUFLAG | Total packets | Discarded packets |
| A | 0 | 22305 | 2 |
| B | 0 | 22860 | 4 |
| C | 0 | 13441 | 2 |
| D | 0 | 20060 | 2 |
| Mode M9 | |||
|---|---|---|---|
| Quadrant | BADHDUFLAG | Total packets | Discarded packets |
| A | 0 | 13 | 0 |
| B | 0 | 14 | 0 |
| C | 0 | 14 | 0 |
| D | 0 | 14 | 0 |
| Quadrant | Total seconds | Saturated seconds | Saturation percentage |
|---|---|---|---|
| A | 6618 | 163 | 2.462980% |
| B | 6617 | 621 | 9.384918% |
| C | 6617 | 12 | 0.181351% |
| D | 6617 | 269 | 4.065286% |
Noise dominated data is calculated using 1-second bins in cleaned event files. If a bin has >2000 counts, and if more than 50% of those come from <1% of pixels, then it is considered to be noise-dominated and hence unusable.
| Quadrant | # 1 sec bins | Bins with >0 counts | Bins with >2000 counts | High rate bins dominated by noise | Noise dominated (total time) | Noise dominated (detector-on time) | Marked lightcurve |
|---|---|---|---|---|---|---|---|
| A | 7688 | 6619 | 45 | 45 | 0.59% | 0.68% | 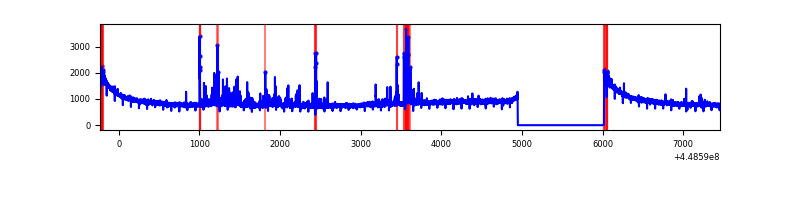 |
| B | 7687 | 6618 | 307 | 307 | 3.99% | 4.64% | 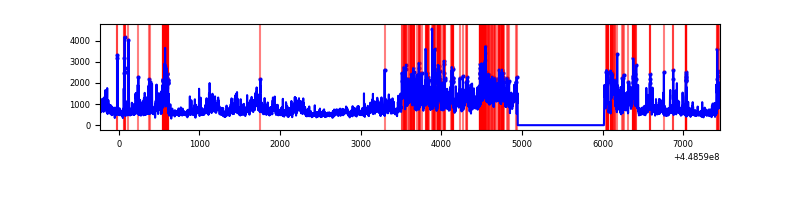 |
| C | 7687 | 6618 | 1 | 1 | 0.01% | 0.02% | 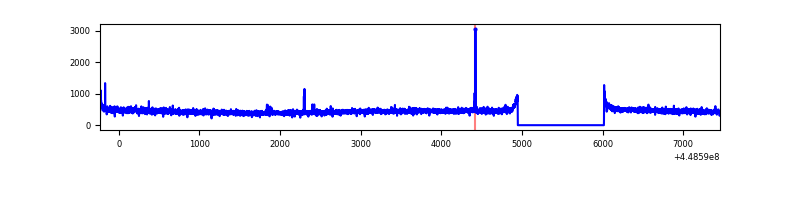 |
| D | 7687 | 6618 | 190 | 190 | 2.47% | 2.87% | 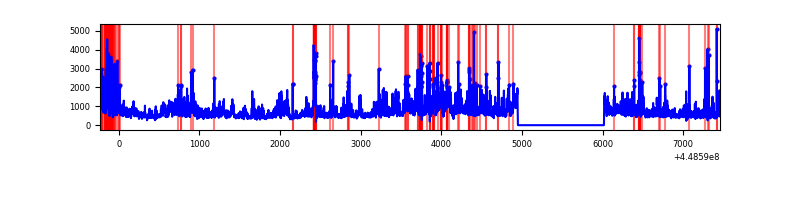 |
Top three noisy pixels from each quadrant. If the there are fewer than three noisy pixels in the level2.evt file, extra rows are filled as -1
| Pixel properties | Quadrant properties | ||||||
|---|---|---|---|---|---|---|---|
| Quadrant | DetID | PixID | Counts | Sigma | Mean | Median | Sigma |
| A | 10 | 83 | 2901098 | 19076.49 | 732 | 716 | 152.0 |
| A | 13 | 248 | 272122 | 1785.1 | 732 | 716 | 152.0 |
| A | 13 | 254 | 11949 | 73.88 | 732 | 716 | 152.0 |
| B | 3 | 112 | 2738507 | 19420.67 | 725 | 703 | 141.0 |
| B | 4 | 171 | 156633 | 1106.09 | 725 | 703 | 141.0 |
| B | 5 | 63 | 150071 | 1059.54 | 725 | 703 | 141.0 |
| C | 3 | 233 | 40282 | 227.09 | 739 | 743 | 174.1 |
| C | 0 | 207 | 7249 | 37.37 | 739 | 743 | 174.1 |
| C | 10 | 20 | 6852 | 35.09 | 739 | 743 | 174.1 |
| D | 11 | 241 | 1342140 | 7518.37 | 714 | 693 | 178.4 |
| D | 13 | 249 | 291064 | 1627.43 | 714 | 693 | 178.4 |
| D | 1 | 52 | 238629 | 1333.55 | 714 | 693 | 178.4 |
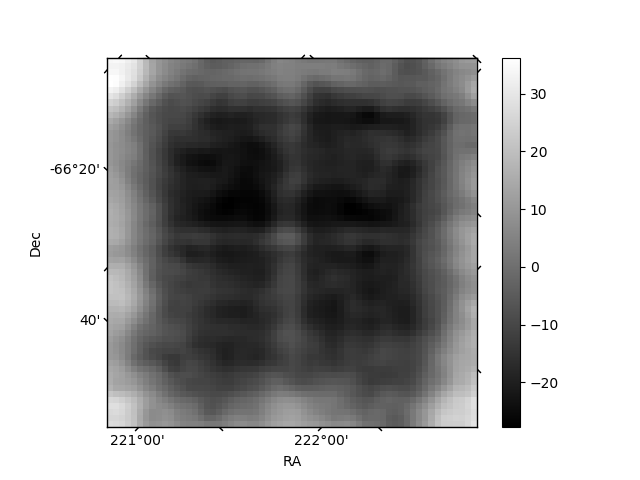
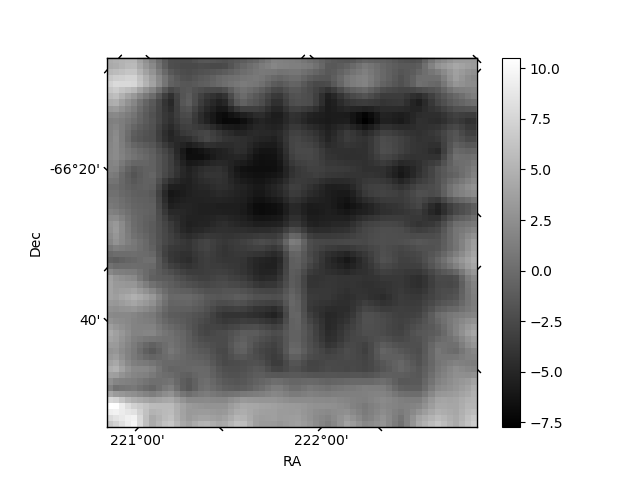
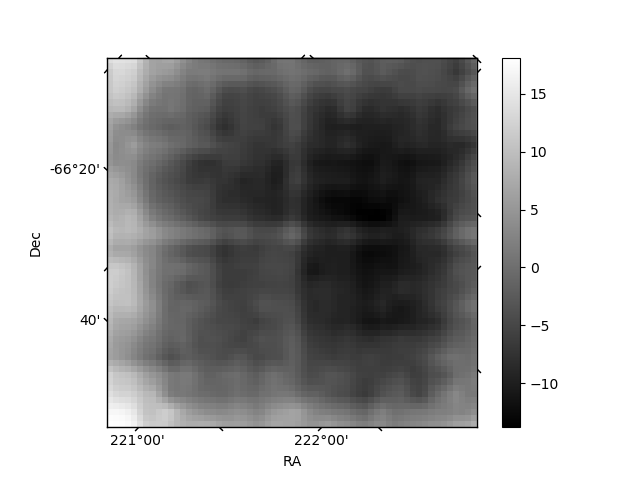
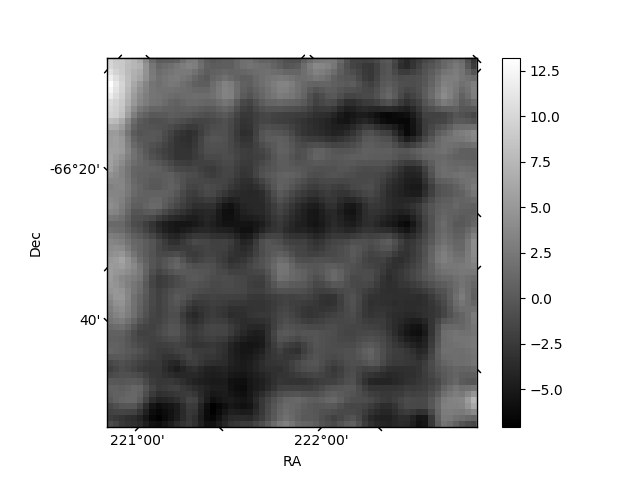
Histogram calculated using DETX and DETY for each event in the final _common_clean file
| Quadrant A | 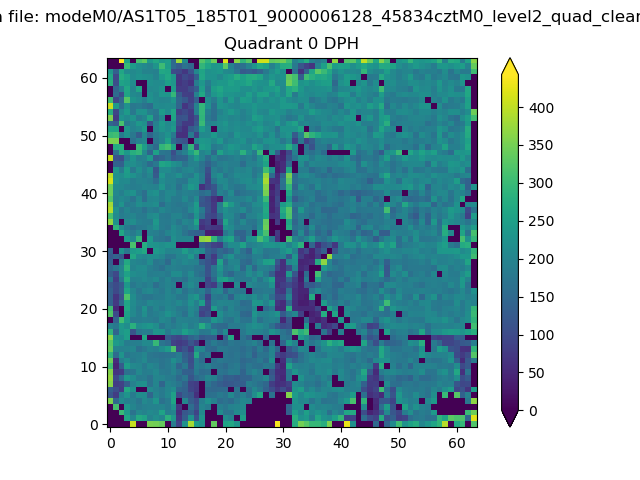 |
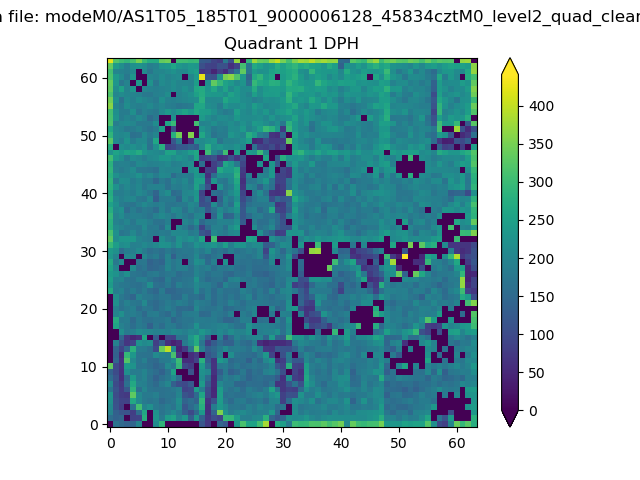 |
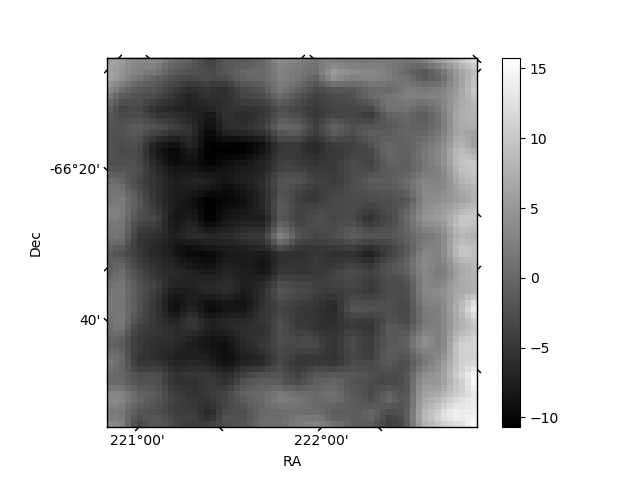
Quadrant B |
|---|---|---|---|
| Quadrant D | 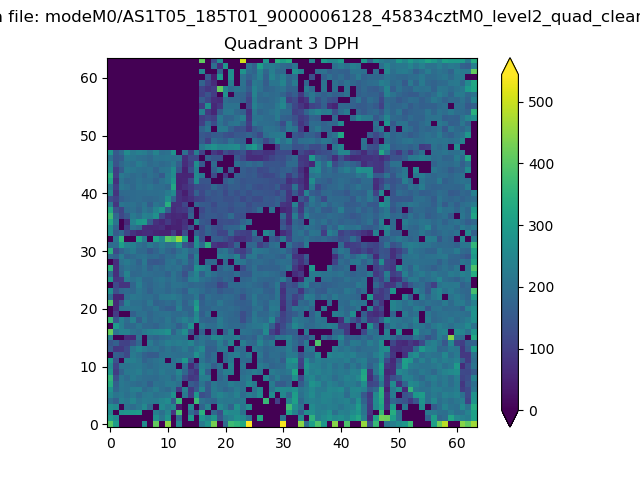 |
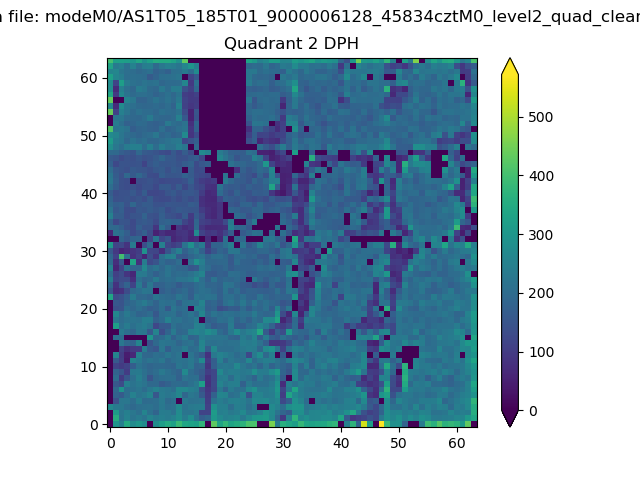 |
Quadrant C |
| Plot type | Count rate plots | Images |
|---|---|---|
| Comparison with Poisson distribution Blue bars denote a histogram of data divided into 1 sec bins. Red curve is a Poisson curve with rate = median count rate of data. |
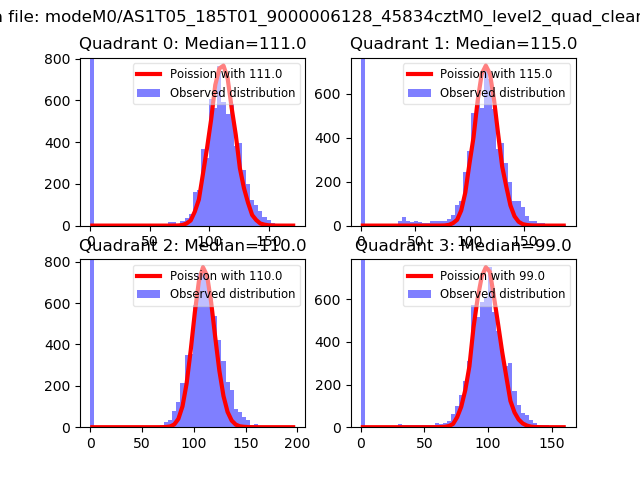 |
 |
| Quadrant-wise count rates Data is divided into 100 sec bins |
 |
|
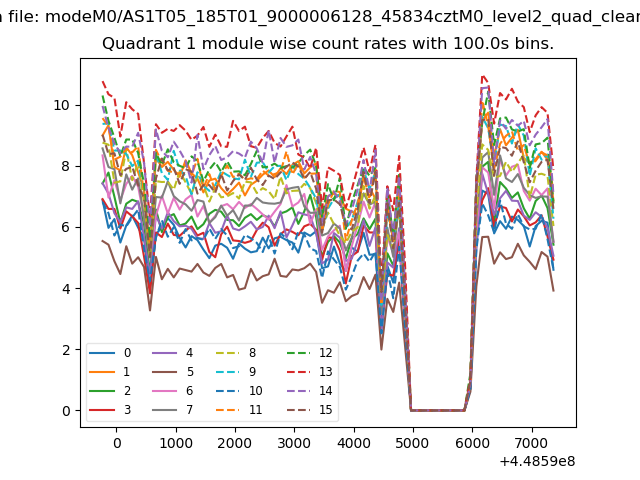
| Module-wise count rates for Quadrant A Data is divided into 100 sec bins |
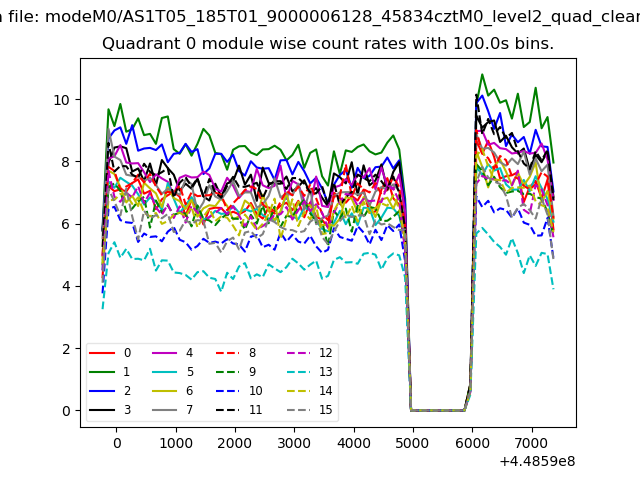 |
 |
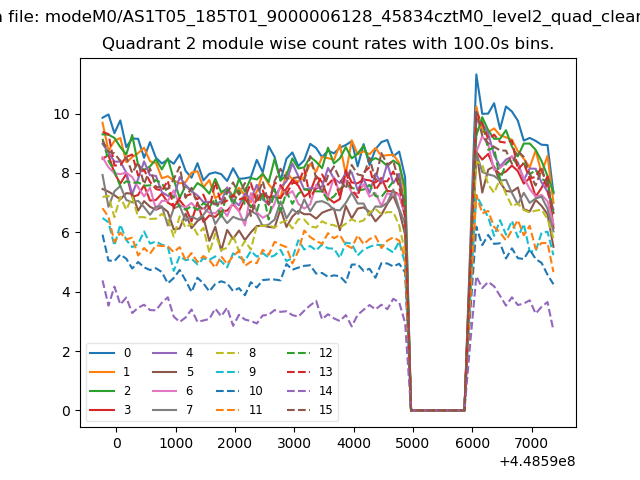
| Module-wise count rates for Quadrant B Data is divided into 100 sec bins |
 |
 |
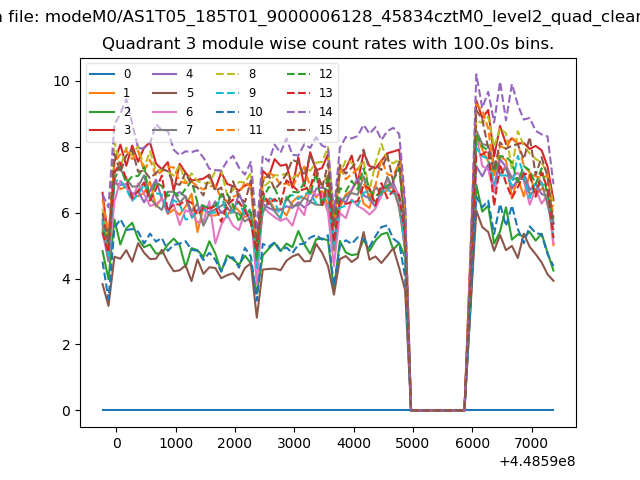
| Module-wise count rates for Quadrant C Data is divided into 100 sec bins |
 |
 |
| Module-wise count rates for Quadrant D Data is divided into 100 sec bins |
 |
 |
| Parameter | Plot |
|---|---|
| CZT HV Monitor | 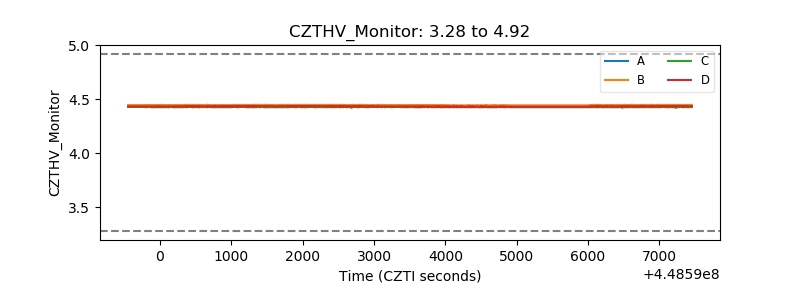 |
| D_VDD | 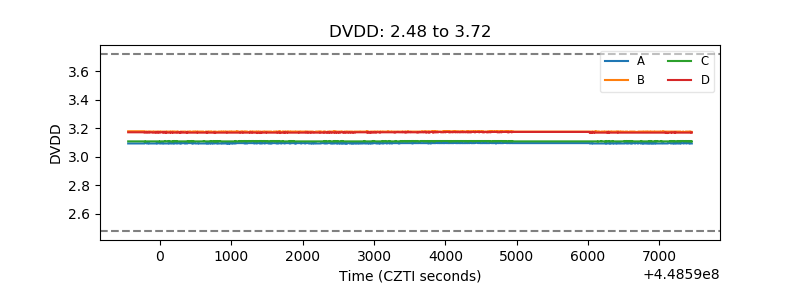 |
| Temperature 1 | 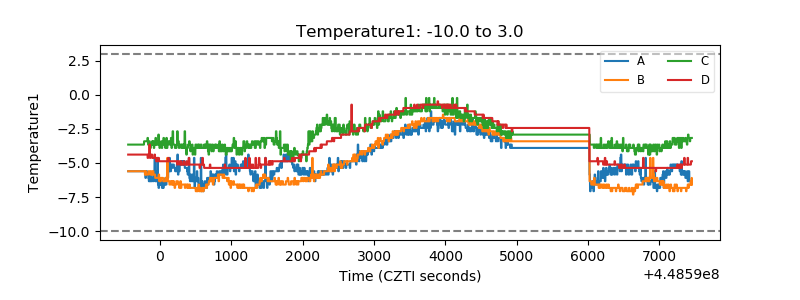 |
| Veto HV Monitor | 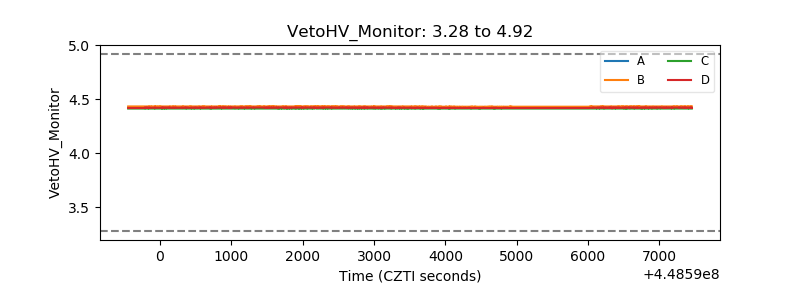 |
| Veto LLD | 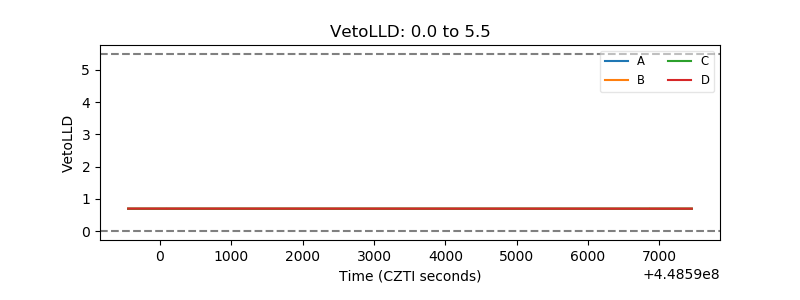 |
| Alpha Counter | 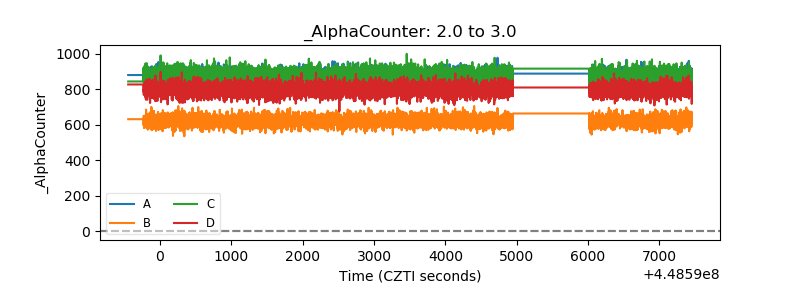 |
| _CPM_Rate | 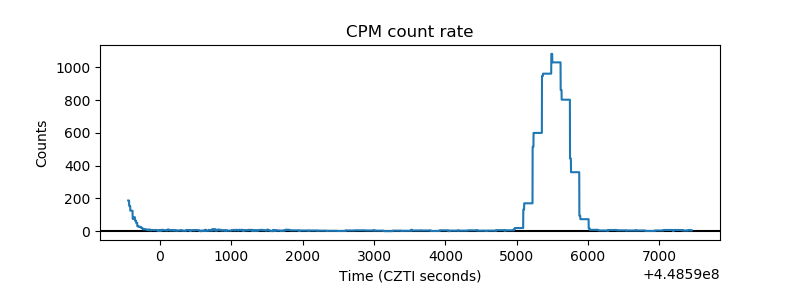 |
| CZT Counter | 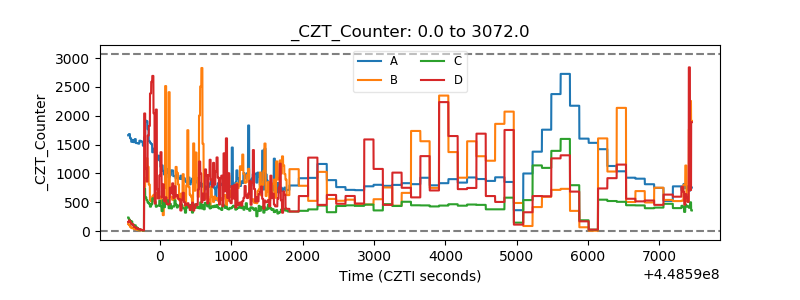 |
| +2.5 Volts monitor | 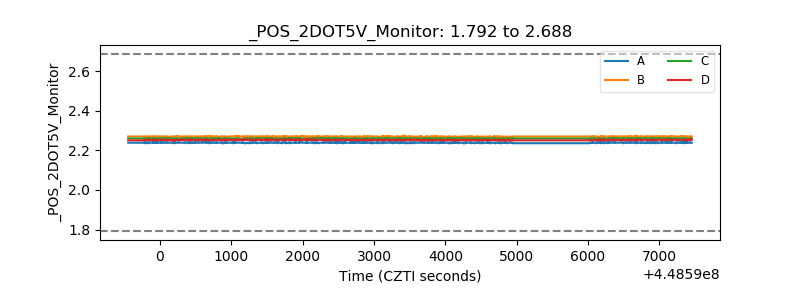 |
| +5 Volts monitor | 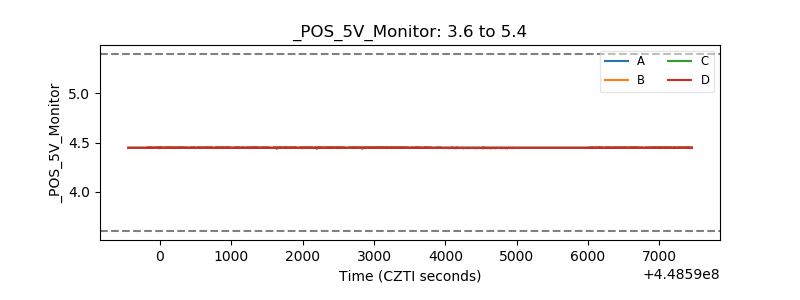 |
| _ROLL_ROT | 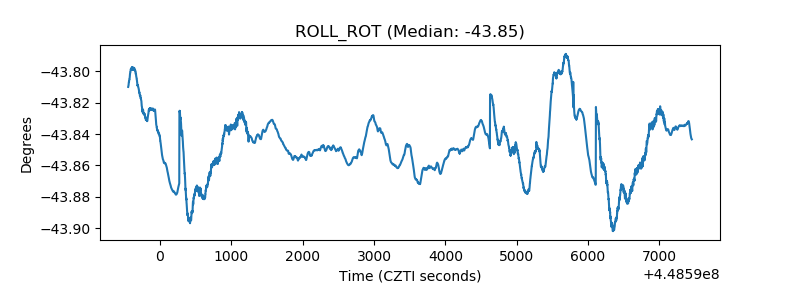 |
| _Roll_DEC | 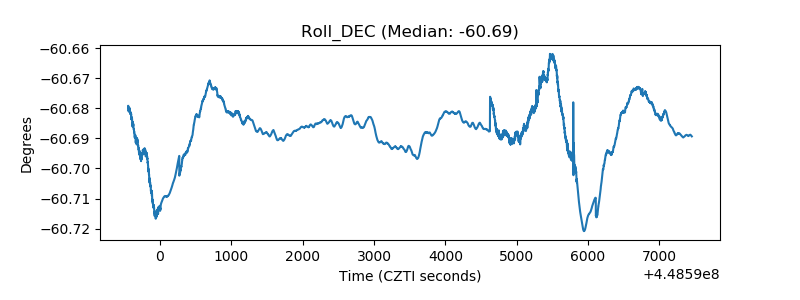 |
| _Roll_RA | 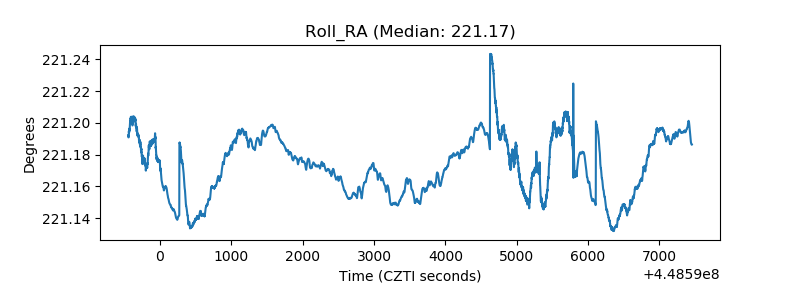 |
| Veto Counter | 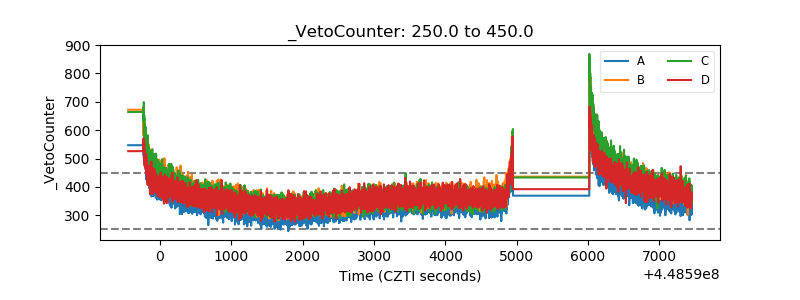 |