| Param | Original file | Final file |
|---|---|---|
| Filename | modeM0/AS1T05_185T01_9000006128_45835cztM0_level2.fits | modeM0/AS1T05_185T01_9000006128_45835cztM0_level2_quad_clean.evt |
| Size (bytes) | 568,488,960 | 109,915,200 |
| Size | 542.2 MB | 104.8 MB |
| Events in quadrant A | 5,930,059 | 740,904 |
| Events in quadrant B | 5,930,242 | 737,746 |
| Events in quadrant C | 2,990,938 | 757,168 |
| Events in quadrant D | 5,689,065 | 639,409 |
| Mode SS | |||
|---|---|---|---|
| Quadrant | BADHDUFLAG | Total packets | Discarded packets |
| A | 0 | 130 | 0 |
| B | 0 | 130 | 0 |
| C | 0 | 130 | 0 |
| D | 0 | 130 | 0 |
| Mode M0 | |||
|---|---|---|---|
| Quadrant | BADHDUFLAG | Total packets | Discarded packets |
| A | 0 | 21855 | 2 |
| B | 0 | 22114 | 2 |
| C | 0 | 13392 | 2 |
| D | 0 | 21362 | 3 |
| Mode M9 | |||
|---|---|---|---|
| Quadrant | BADHDUFLAG | Total packets | Discarded packets |
| A | 0 | 19 | 0 |
| B | 0 | 20 | 0 |
| C | 0 | 20 | 0 |
| D | 0 | 20 | 0 |
| Quadrant | Total seconds | Saturated seconds | Saturation percentage |
|---|---|---|---|
| A | 6500 | 201 | 3.092308% |
| B | 6500 | 628 | 9.661538% |
| C | 6500 | 37 | 0.569231% |
| D | 6499 | 548 | 8.432066% |
Noise dominated data is calculated using 1-second bins in cleaned event files. If a bin has >2000 counts, and if more than 50% of those come from <1% of pixels, then it is considered to be noise-dominated and hence unusable.
| Quadrant | # 1 sec bins | Bins with >0 counts | Bins with >2000 counts | High rate bins dominated by noise | Noise dominated (total time) | Noise dominated (detector-on time) | Marked lightcurve |
|---|---|---|---|---|---|---|---|
| A | 7630 | 6501 | 41 | 41 | 0.54% | 0.63% | 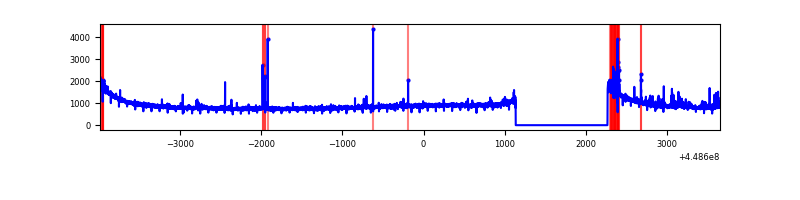 |
| B | 7630 | 6501 | 335 | 335 | 4.39% | 5.15% | 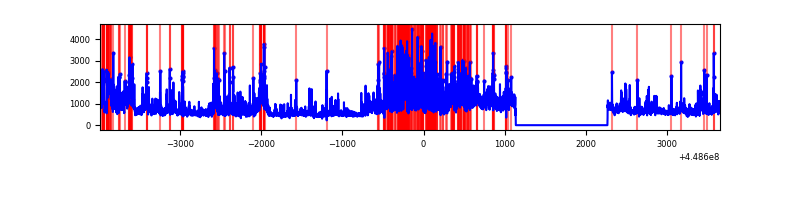 |
| C | 7630 | 6501 | 0 | 0 | 0.00% | 0.00% | 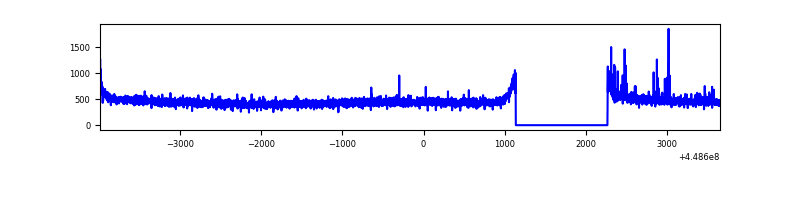 |
| D | 7629 | 6500 | 458 | 458 | 6.00% | 7.05% | 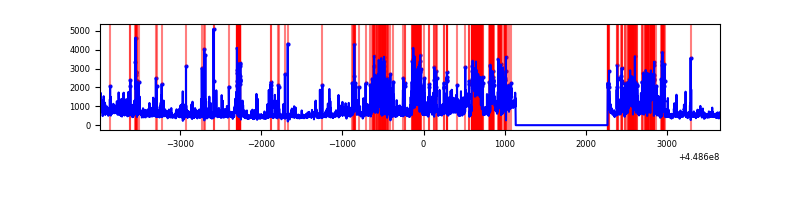 |
Top three noisy pixels from each quadrant. If the there are fewer than three noisy pixels in the level2.evt file, extra rows are filled as -1
| Pixel properties | Quadrant properties | ||||||
|---|---|---|---|---|---|---|---|
| Quadrant | DetID | PixID | Counts | Sigma | Mean | Median | Sigma |
| A | 10 | 83 | 2907347 | 18961.82 | 742 | 726 | 153.3 |
| A | 13 | 248 | 76525 | 494.49 | 742 | 726 | 153.3 |
| A | 7 | 3 | 40481 | 259.35 | 742 | 726 | 153.3 |
| B | 3 | 112 | 2405431 | 17105.73 | 731 | 710 | 140.6 |
| B | 4 | 171 | 188606 | 1336.58 | 731 | 710 | 140.6 |
| B | 5 | 63 | 178418 | 1264.11 | 731 | 710 | 140.6 |
| C | 2 | 14 | 41687 | 233.6 | 754 | 758 | 175.2 |
| C | 3 | 233 | 10264 | 54.26 | 754 | 758 | 175.2 |
| C | 13 | 61 | 5083 | 24.68 | 754 | 758 | 175.2 |
| D | 11 | 241 | 730307 | 4004.71 | 725 | 703 | 182.2 |
| D | 1 | 52 | 626784 | 3436.49 | 725 | 703 | 182.2 |
| D | 8 | 48 | 473777 | 2596.65 | 725 | 703 | 182.2 |
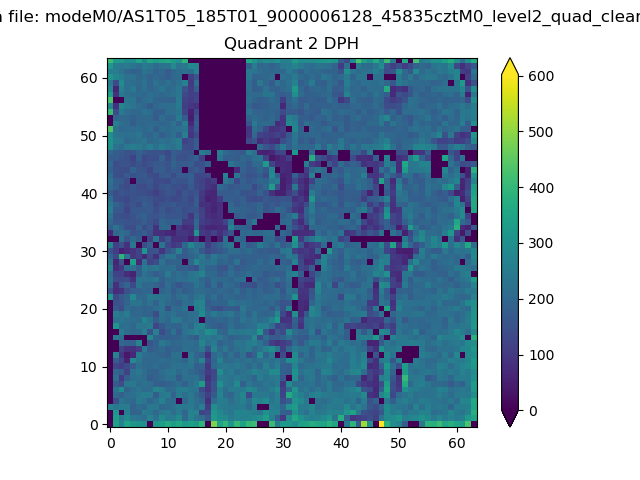
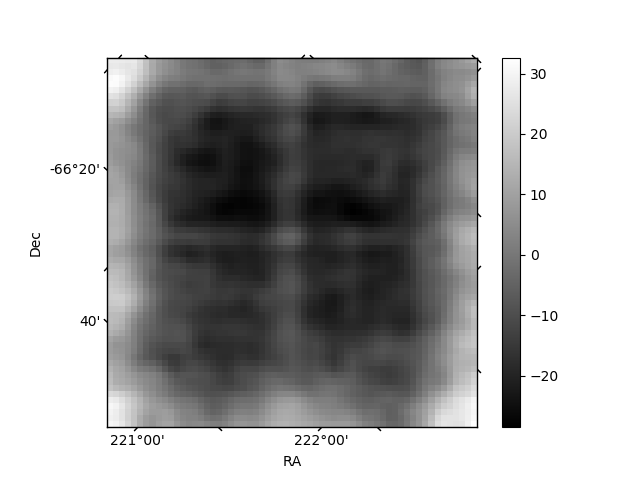
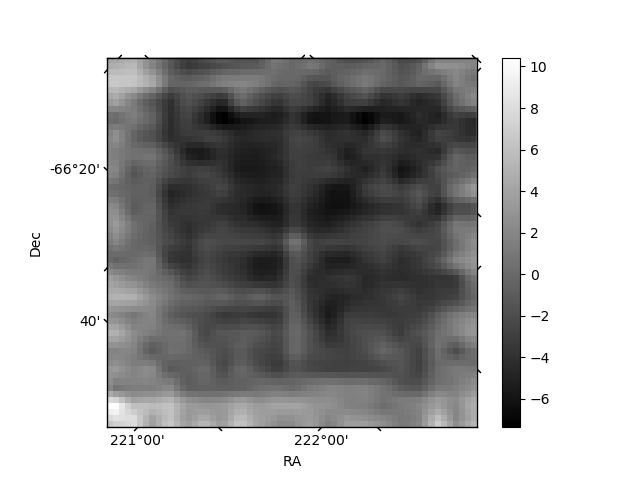
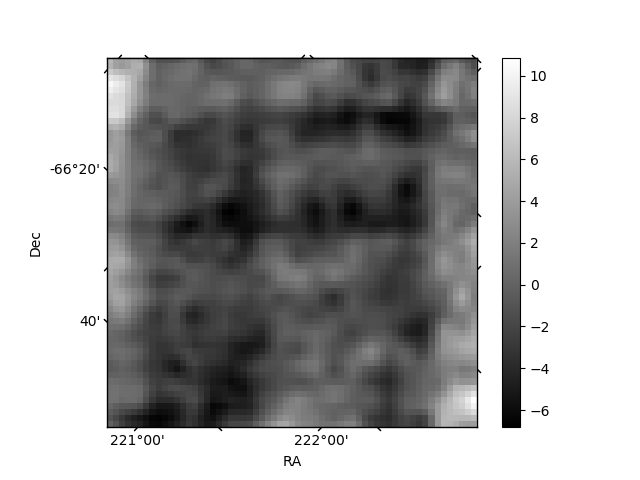
Histogram calculated using DETX and DETY for each event in the final _common_clean file
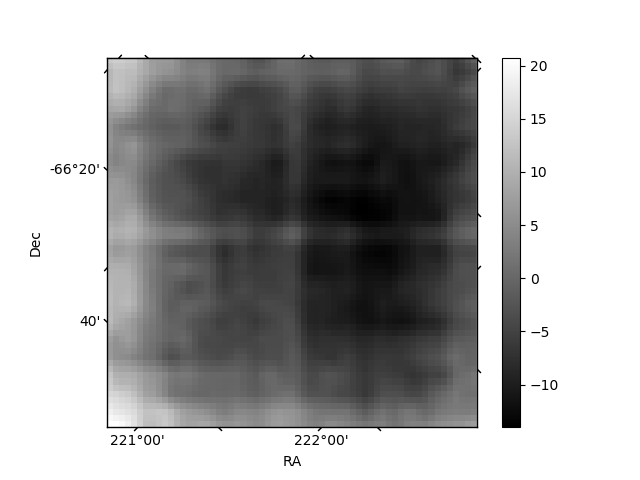
| Quadrant A | 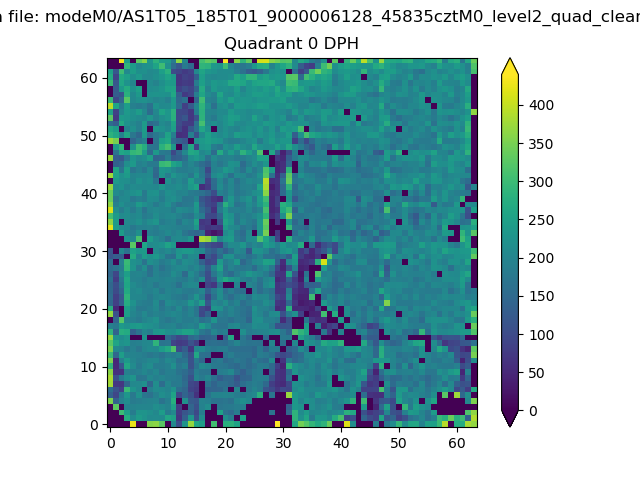 |
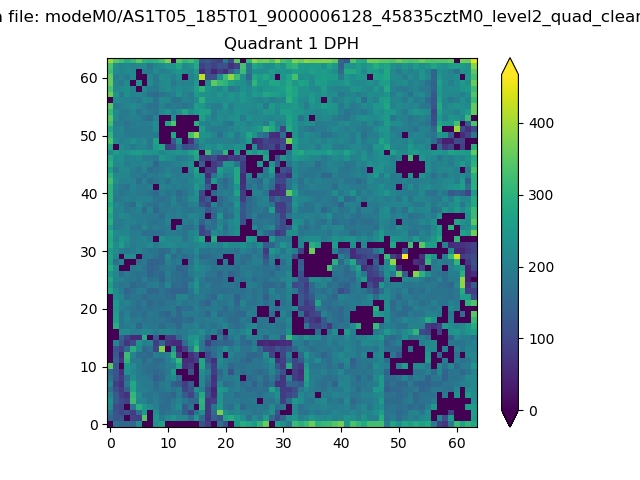 |
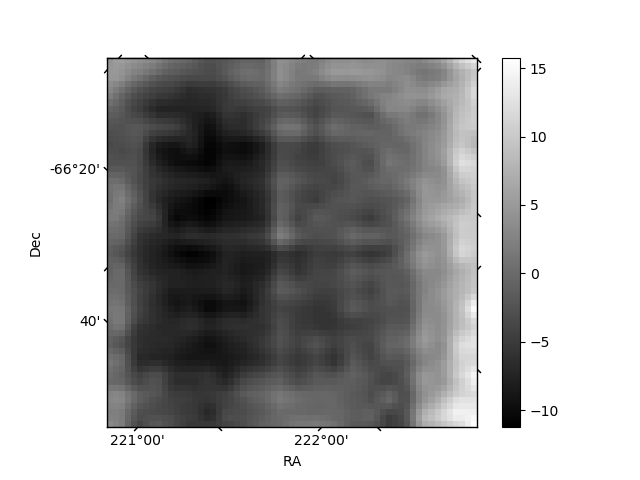
Quadrant B |
|---|---|---|---|
| Quadrant D | 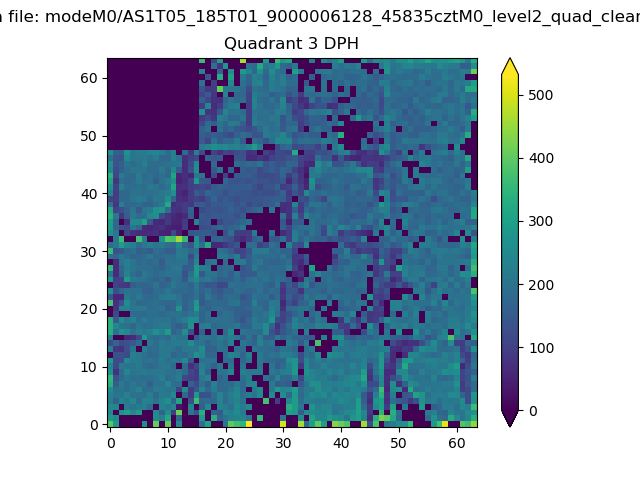 |
 |
Quadrant C |
| Plot type | Count rate plots | Images |
|---|---|---|
| Comparison with Poisson distribution Blue bars denote a histogram of data divided into 1 sec bins. Red curve is a Poisson curve with rate = median count rate of data. |
 |
 |
| Quadrant-wise count rates Data is divided into 100 sec bins |
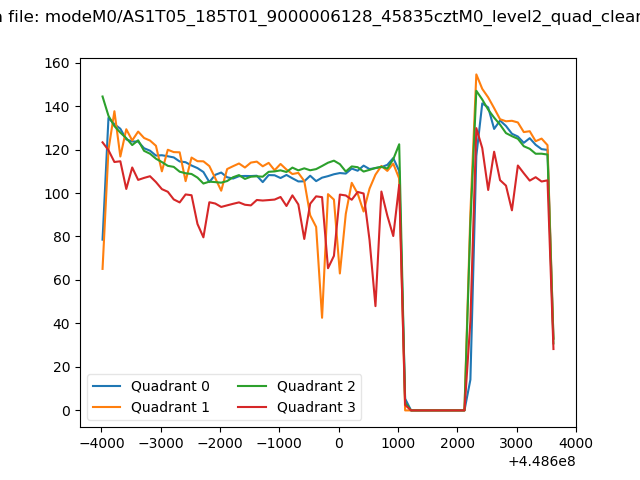 |
|
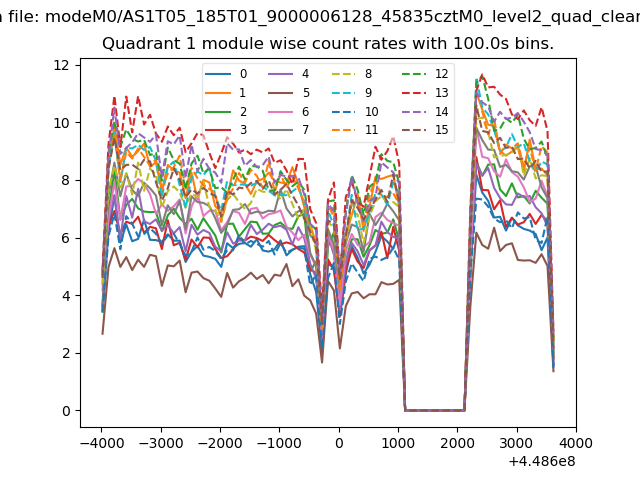
| Module-wise count rates for Quadrant A Data is divided into 100 sec bins |
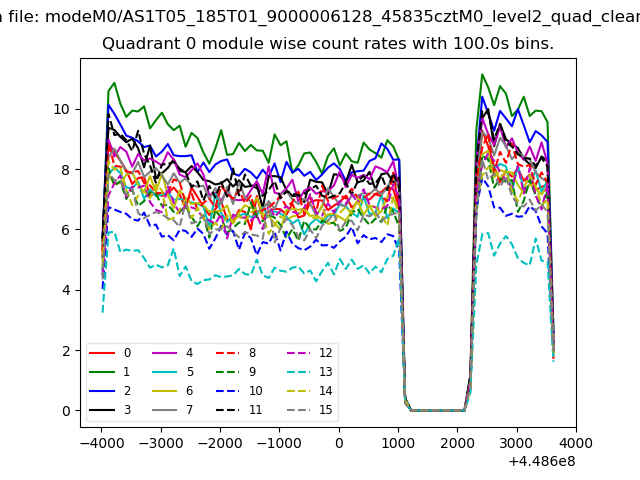 |
 |
| Module-wise count rates for Quadrant B Data is divided into 100 sec bins |
 |
 |
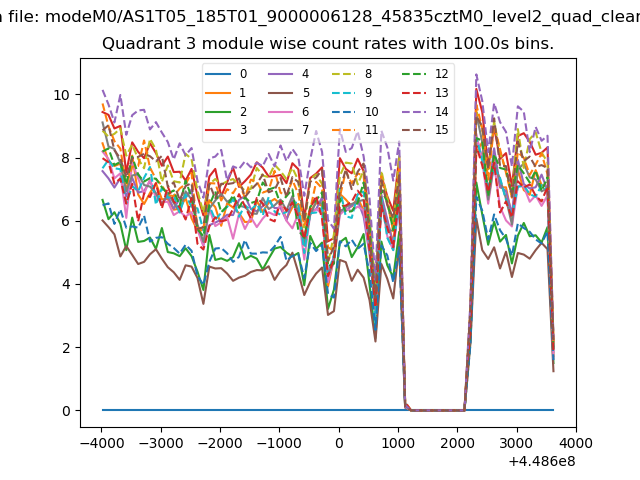
| Module-wise count rates for Quadrant C Data is divided into 100 sec bins |
 |
 |
| Module-wise count rates for Quadrant D Data is divided into 100 sec bins |
 |
 |
| Parameter | Plot |
|---|---|
| CZT HV Monitor |  |
| D_VDD | 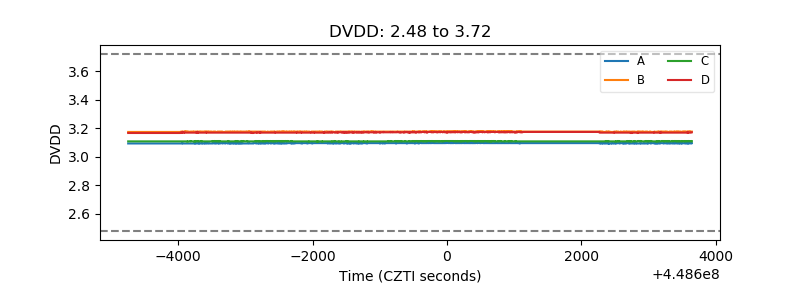 |
| Temperature 1 | 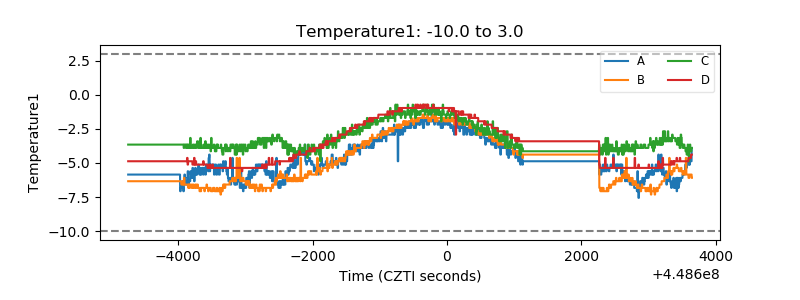 |
| Veto HV Monitor | 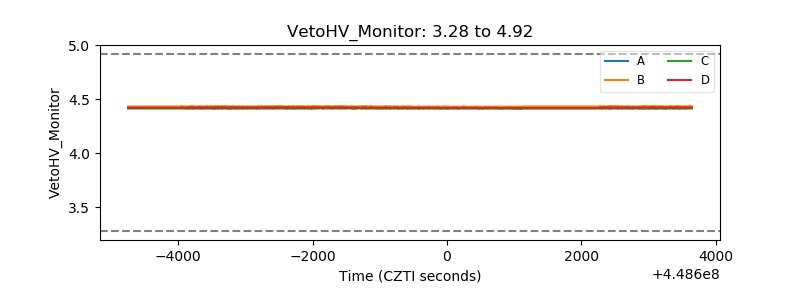 |
| Veto LLD | 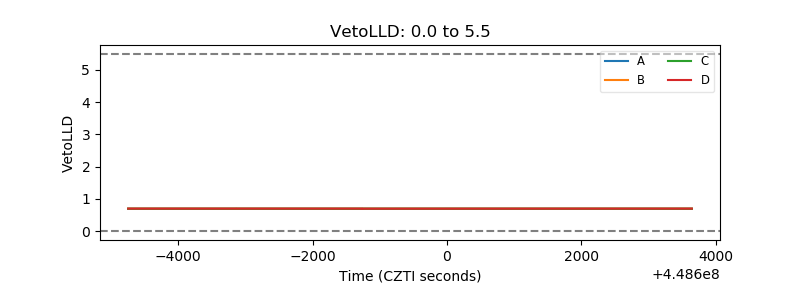 |
| Alpha Counter | 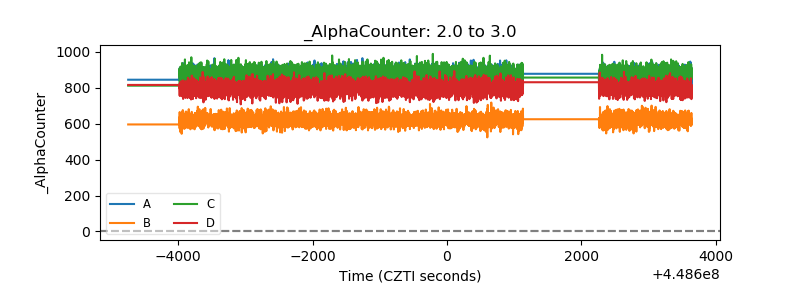 |
| _CPM_Rate | 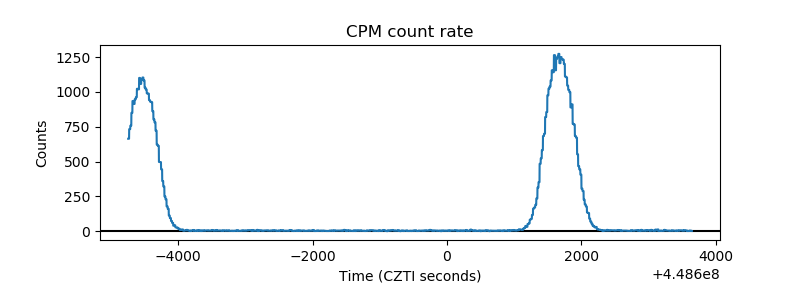 |
| CZT Counter | 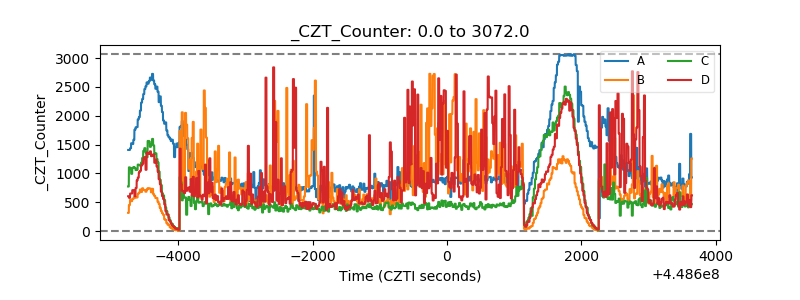 |
| +2.5 Volts monitor | 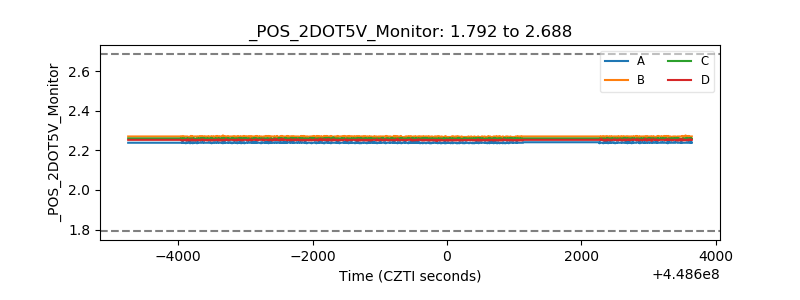 |
| +5 Volts monitor | 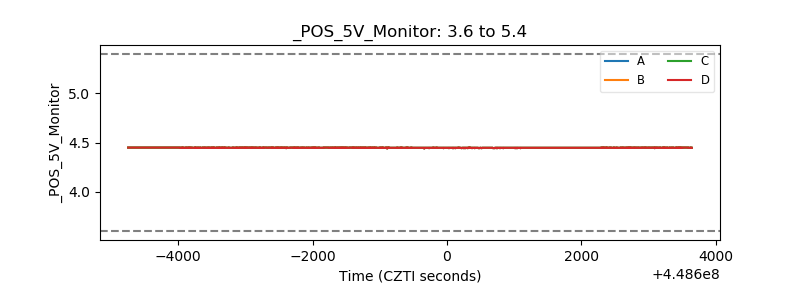 |
| _ROLL_ROT |  |
| _Roll_DEC | 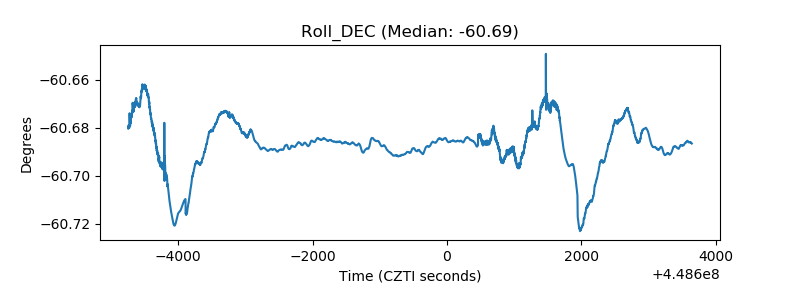 |
| _Roll_RA | 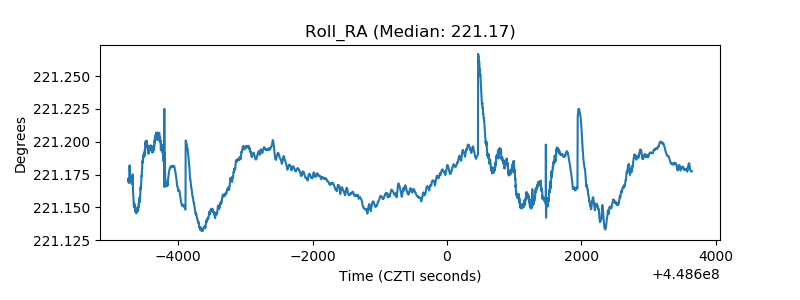 |
| Veto Counter | 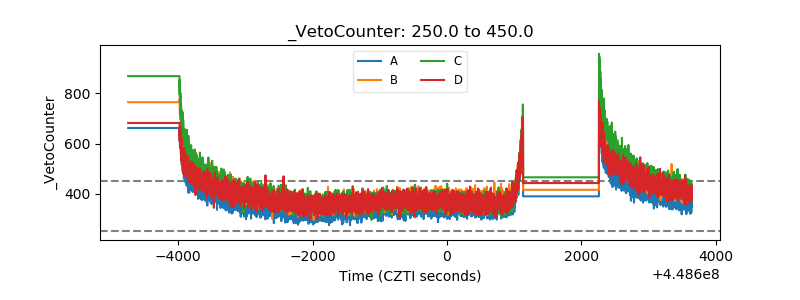 |