| Param | Original file | Final file |
|---|---|---|
| Filename | modeM0/AS1T05_185T01_9000006128_45836cztM0_level2.fits | modeM0/AS1T05_185T01_9000006128_45836cztM0_level2_quad_clean.evt |
| Size (bytes) | 622,177,920 | 108,469,440 |
| Size | 593.4 MB | 103.4 MB |
| Events in quadrant A | 6,130,994 | 748,085 |
| Events in quadrant B | 6,335,824 | 718,333 |
| Events in quadrant C | 3,064,553 | 771,427 |
| Events in quadrant D | 7,001,414 | 597,676 |
| Mode SS | |||
|---|---|---|---|
| Quadrant | BADHDUFLAG | Total packets | Discarded packets |
| A | 0 | 130 | 0 |
| B | 0 | 130 | 0 |
| C | 0 | 130 | 0 |
| D | 0 | 130 | 0 |
| Mode M0 | |||
|---|---|---|---|
| Quadrant | BADHDUFLAG | Total packets | Discarded packets |
| A | 0 | 22250 | 2 |
| B | 0 | 23411 | 5 |
| C | 0 | 13407 | 2 |
| D | 0 | 25251 | 2 |
| Mode M9 | |||
|---|---|---|---|
| Quadrant | BADHDUFLAG | Total packets | Discarded packets |
| A | 0 | 13 | 0 |
| B | 0 | 13 | 0 |
| C | 0 | 14 | 0 |
| D | 0 | 14 | 0 |
| Quadrant | Total seconds | Saturated seconds | Saturation percentage |
|---|---|---|---|
| A | 6438 | 261 | 4.054054% |
| B | 6437 | 912 | 14.168091% |
| C | 6437 | 49 | 0.761224% |
| D | 6438 | 1057 | 16.418142% |
Noise dominated data is calculated using 1-second bins in cleaned event files. If a bin has >2000 counts, and if more than 50% of those come from <1% of pixels, then it is considered to be noise-dominated and hence unusable.
| Quadrant | # 1 sec bins | Bins with >0 counts | Bins with >2000 counts | High rate bins dominated by noise | Noise dominated (total time) | Noise dominated (detector-on time) | Marked lightcurve |
|---|---|---|---|---|---|---|---|
| A | 7633 | 6439 | 71 | 71 | 0.93% | 1.10% | 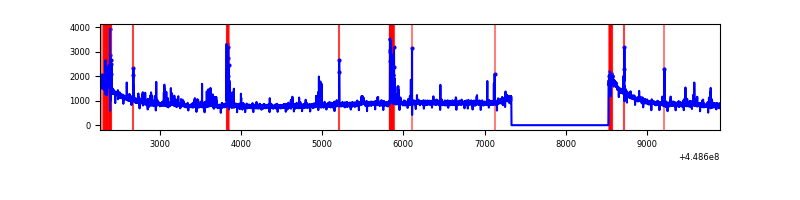 |
| B | 7633 | 6439 | 411 | 411 | 5.38% | 6.38% | 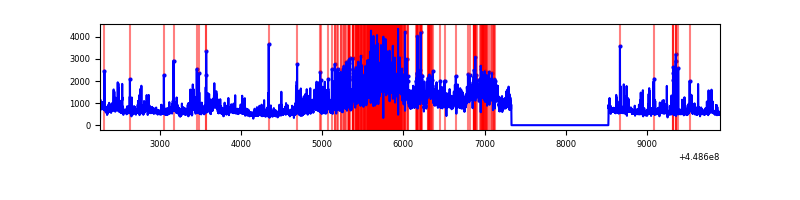 |
| C | 7633 | 6439 | 3 | 3 | 0.04% | 0.05% | 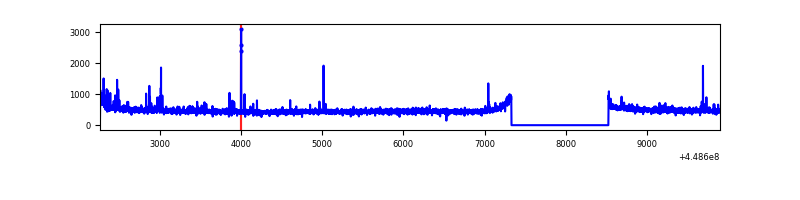 |
| D | 7633 | 6439 | 867 | 867 | 11.36% | 13.46% | 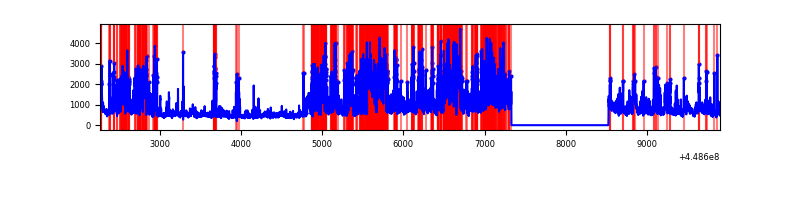 |
Top three noisy pixels from each quadrant. If the there are fewer than three noisy pixels in the level2.evt file, extra rows are filled as -1
| Pixel properties | Quadrant properties | ||||||
|---|---|---|---|---|---|---|---|
| Quadrant | DetID | PixID | Counts | Sigma | Mean | Median | Sigma |
| A | 10 | 83 | 2943078 | 19147.49 | 748 | 731 | 153.7 |
| A | 13 | 248 | 229844 | 1490.97 | 748 | 731 | 153.7 |
| A | 7 | 3 | 49297 | 316.05 | 748 | 731 | 153.7 |
| B | 3 | 112 | 2638093 | 18913.33 | 727 | 706 | 139.4 |
| B | 12 | 18 | 404193 | 2893.5 | 727 | 706 | 139.4 |
| B | 4 | 171 | 86929 | 618.33 | 727 | 706 | 139.4 |
| C | 2 | 14 | 60409 | 334.28 | 762 | 766 | 178.4 |
| C | 5 | 128 | 19061 | 102.54 | 762 | 766 | 178.4 |
| C | 3 | 233 | 12767 | 67.26 | 762 | 766 | 178.4 |
| D | 1 | 52 | 1372527 | 7827.63 | 707 | 686 | 175.3 |
| D | 11 | 241 | 1080052 | 6158.79 | 707 | 686 | 175.3 |
| D | 13 | 249 | 1032064 | 5884.97 | 707 | 686 | 175.3 |
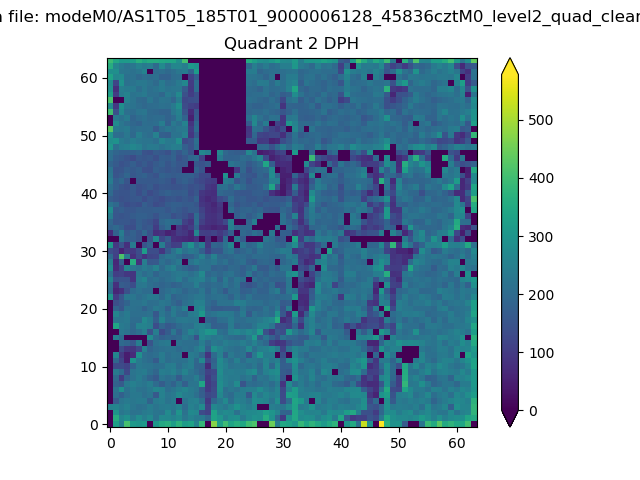
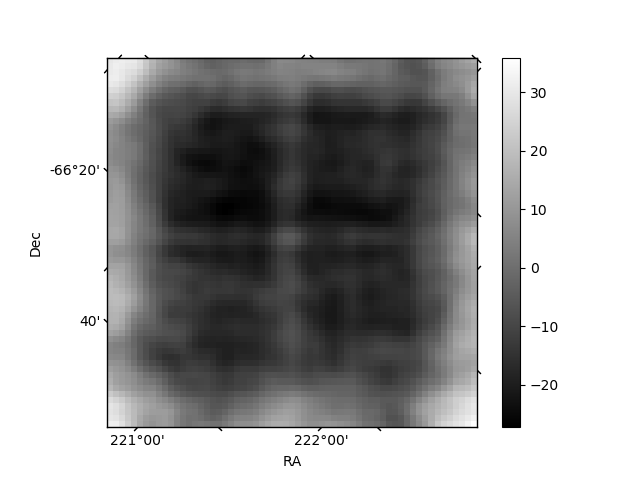
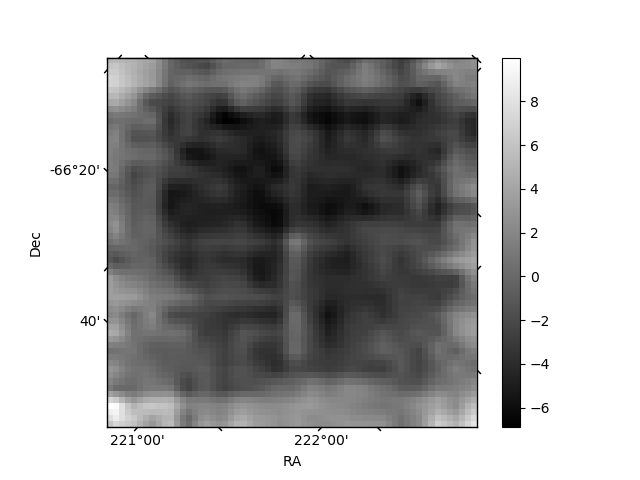
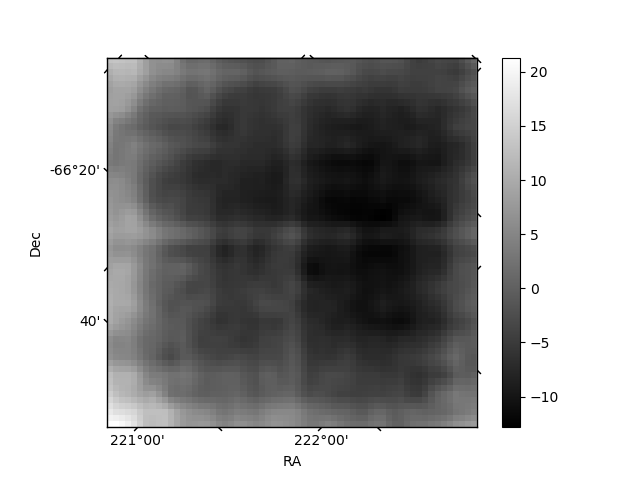
Histogram calculated using DETX and DETY for each event in the final _common_clean file
| Quadrant A | 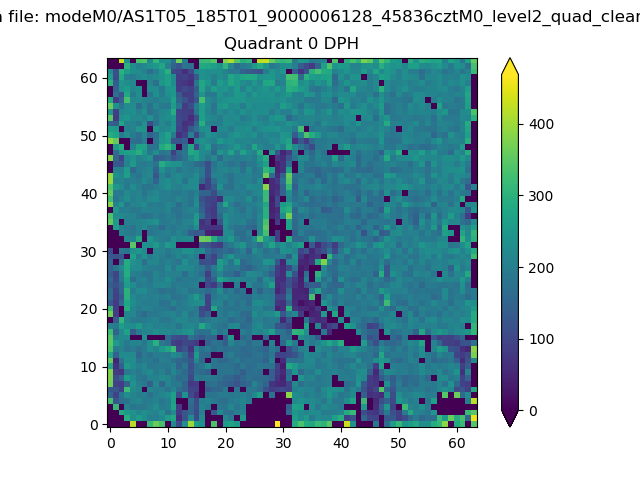 |
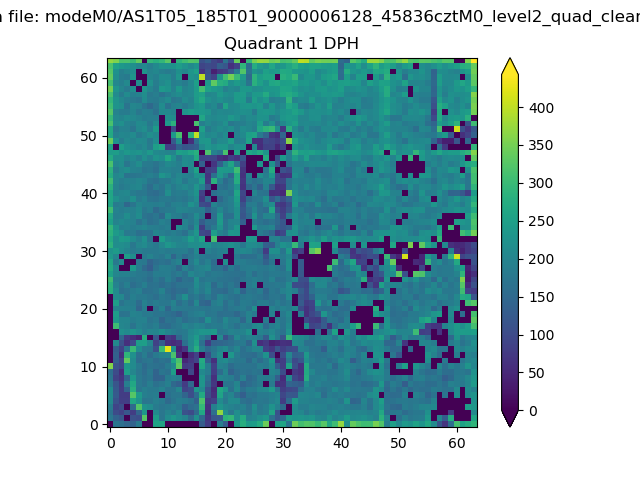 |
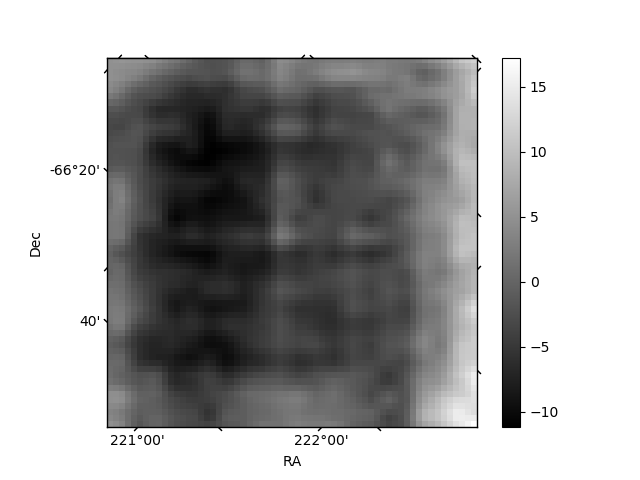
Quadrant B |
|---|---|---|---|
| Quadrant D | 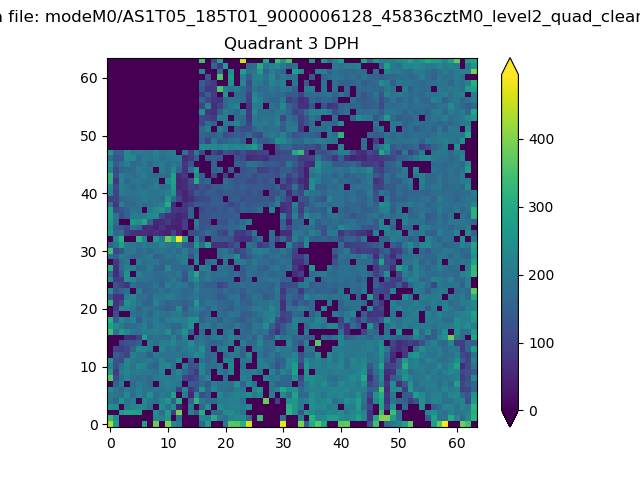 |
 |
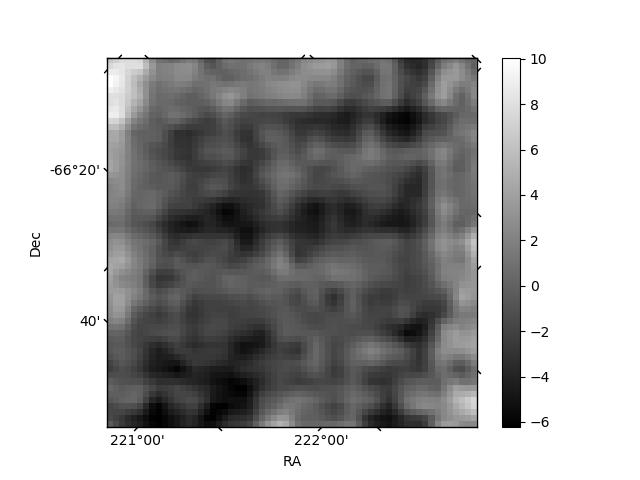
Quadrant C |
| Plot type | Count rate plots | Images |
|---|---|---|
| Comparison with Poisson distribution Blue bars denote a histogram of data divided into 1 sec bins. Red curve is a Poisson curve with rate = median count rate of data. |
 |
 |
| Quadrant-wise count rates Data is divided into 100 sec bins |
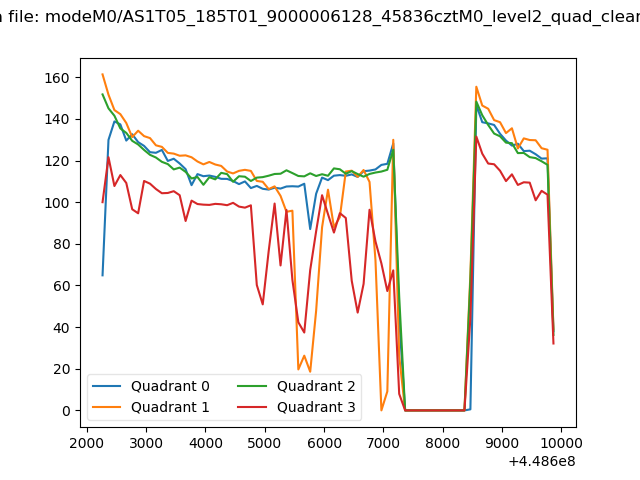 |
|
| Module-wise count rates for Quadrant A Data is divided into 100 sec bins |
 |
 |
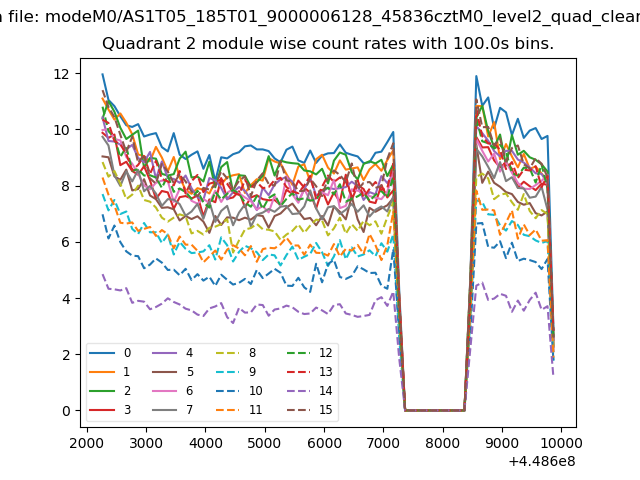
| Module-wise count rates for Quadrant B Data is divided into 100 sec bins |
 |
 |
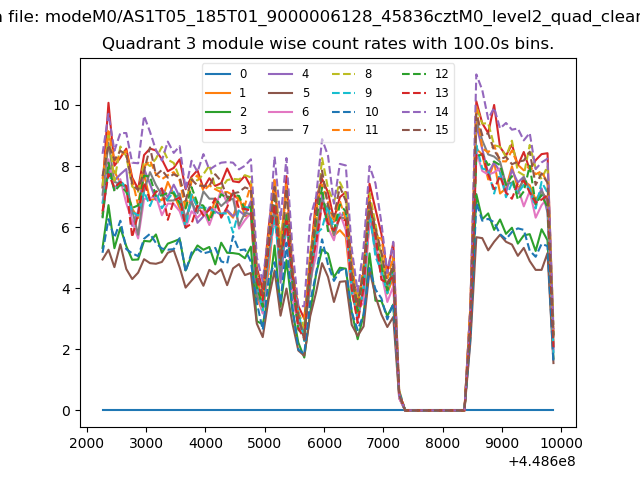
| Module-wise count rates for Quadrant C Data is divided into 100 sec bins |
 |
 |
| Module-wise count rates for Quadrant D Data is divided into 100 sec bins |
 |
 |
| Parameter | Plot |
|---|---|
| CZT HV Monitor | 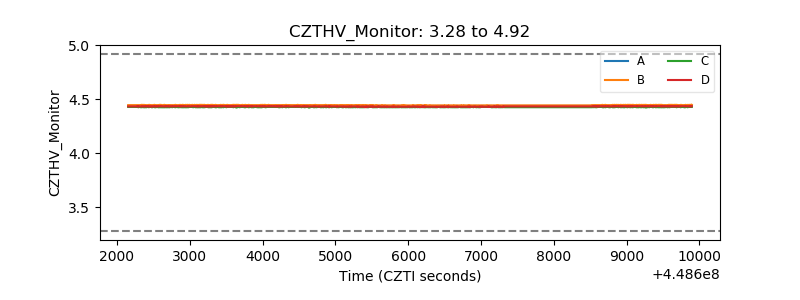 |
| D_VDD | 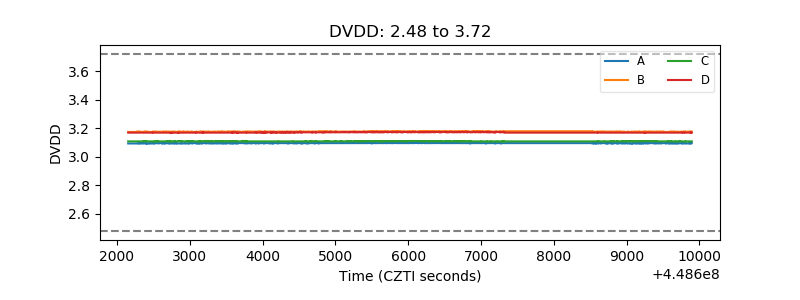 |
| Temperature 1 | 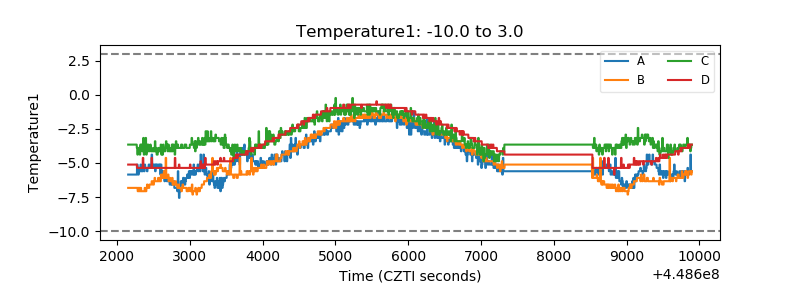 |
| Veto HV Monitor | 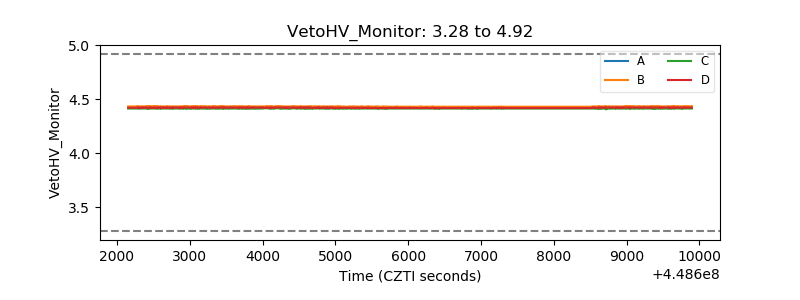 |
| Veto LLD | 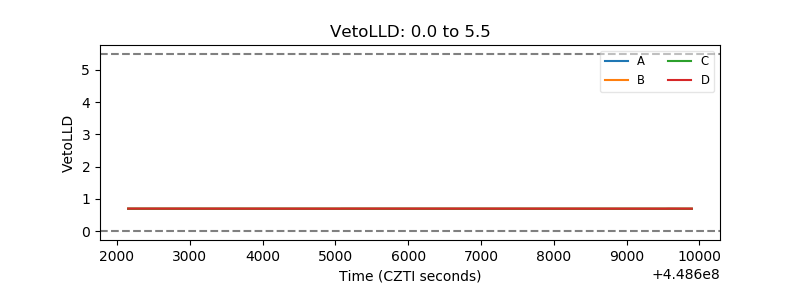 |
| Alpha Counter | 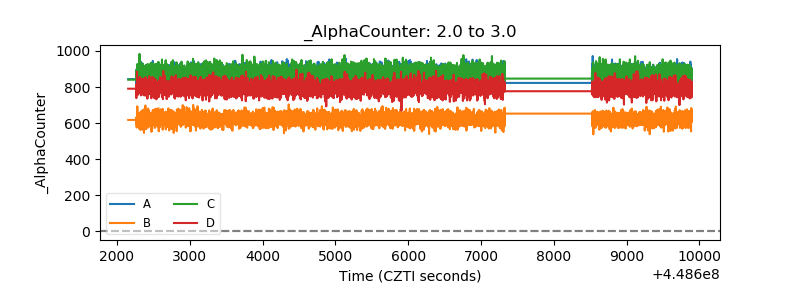 |
| _CPM_Rate | 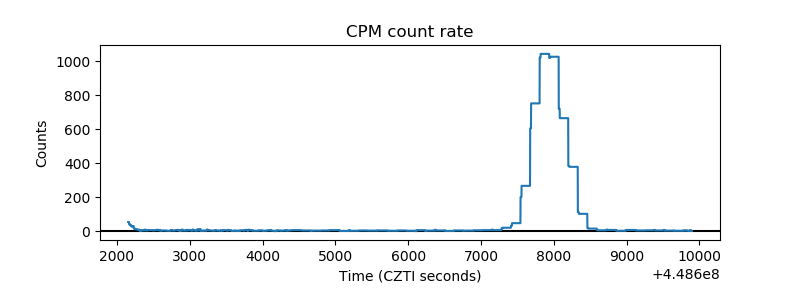 |
| CZT Counter | 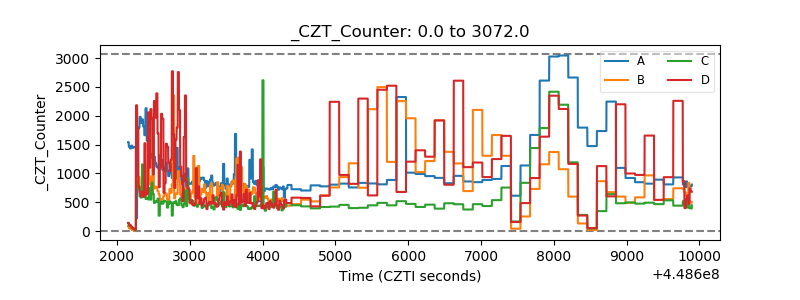 |
| +2.5 Volts monitor | 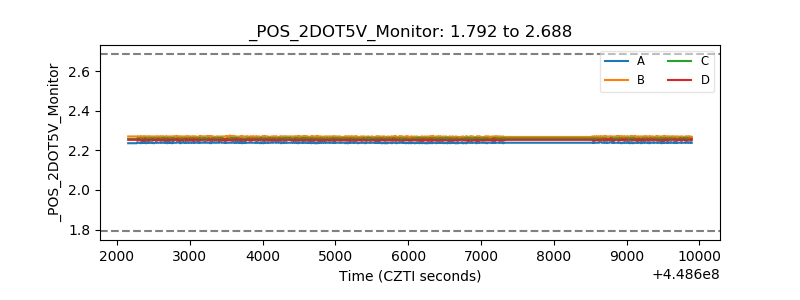 |
| +5 Volts monitor | 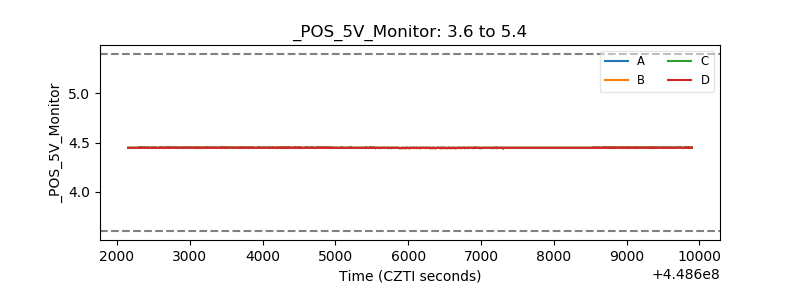 |
| _ROLL_ROT | 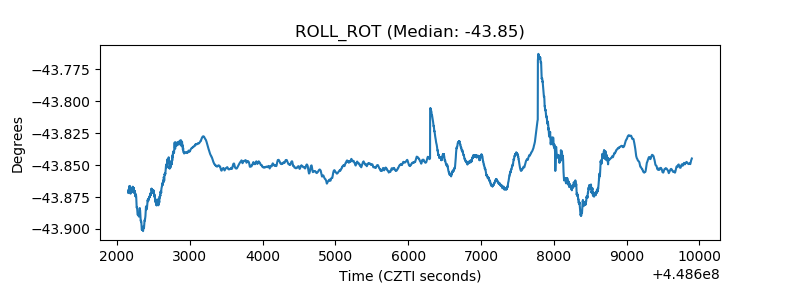 |
| _Roll_DEC | 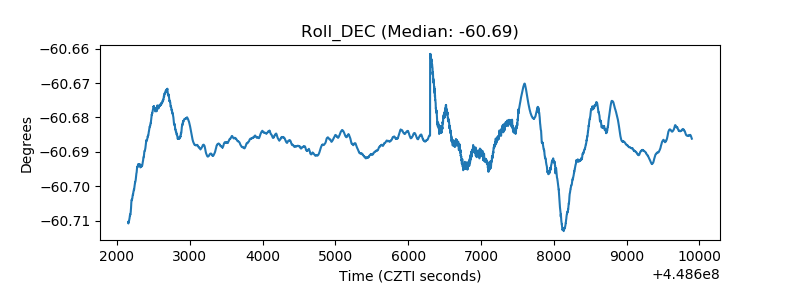 |
| _Roll_RA | 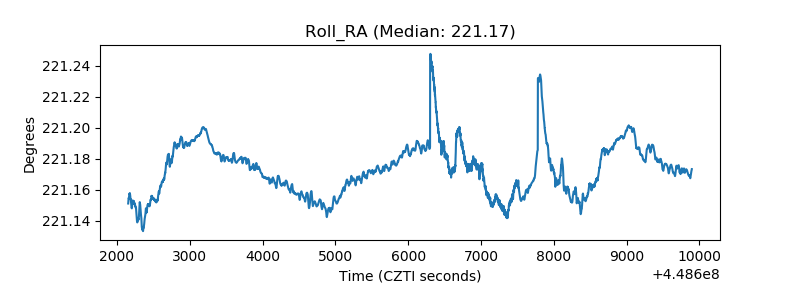 |
| Veto Counter |  |