| Param | Original file | Final file |
|---|---|---|
| Filename | modeM0/AS1T05_186T01_9000006130_45837cztM0_level2.fits | modeM0/AS1T05_186T01_9000006130_45837cztM0_level2_quad_clean.evt |
| Size (bytes) | 120,248,640 | 25,030,080 |
| Size | 114.7 MB | 23.9 MB |
| Events in quadrant A | 1,394,513 | 161,239 |
| Events in quadrant B | 1,086,364 | 177,847 |
| Events in quadrant C | 715,770 | 171,915 |
| Events in quadrant D | 1,143,664 | 143,236 |
| Mode M0 | |||
|---|---|---|---|
| Quadrant | BADHDUFLAG | Total packets | Discarded packets |
| A | 0 | 5016 | 1 |
| B | 0 | 4305 | 1 |
| C | 0 | 2982 | 1 |
| D | 0 | 4307 | 3 |
| Mode M9 | |||
|---|---|---|---|
| Quadrant | BADHDUFLAG | Total packets | Discarded packets |
| A | 0 | 8 | 0 |
| B | 0 | 8 | 0 |
| C | 0 | 8 | 0 |
| D | 0 | 8 | 0 |
| Mode SS | |||
|---|---|---|---|
| Quadrant | BADHDUFLAG | Total packets | Discarded packets |
| A | 0 | 28 | 0 |
| B | 0 | 28 | 0 |
| C | 0 | 28 | 0 |
| D | 0 | 28 | 0 |
| Quadrant | Total seconds | Saturated seconds | Saturation percentage |
|---|---|---|---|
| A | 1394 | 92 | 6.599713% |
| B | 1394 | 47 | 3.371593% |
| C | 1394 | 12 | 0.860832% |
| D | 1393 | 141 | 10.122039% |
Noise dominated data is calculated using 1-second bins in cleaned event files. If a bin has >2000 counts, and if more than 50% of those come from <1% of pixels, then it is considered to be noise-dominated and hence unusable.
| Quadrant | # 1 sec bins | Bins with >0 counts | Bins with >2000 counts | High rate bins dominated by noise | Noise dominated (total time) | Noise dominated (detector-on time) | Marked lightcurve |
|---|---|---|---|---|---|---|---|
| A | 1394 | 1394 | 1 | 1 | 0.07% | 0.07% | 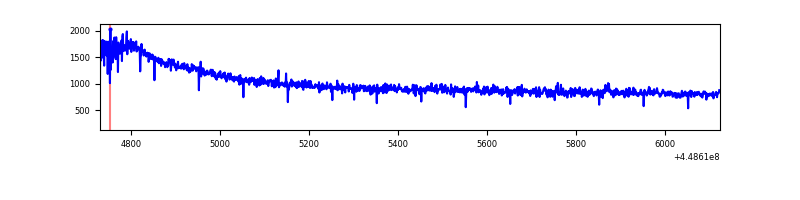 |
| B | 1394 | 1394 | 10 | 10 | 0.72% | 0.72% | 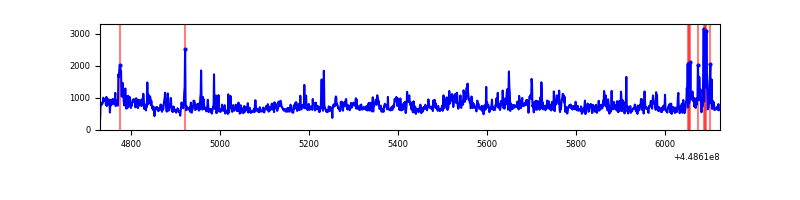 |
| C | 1394 | 1394 | 0 | 0 | 0.00% | 0.00% | 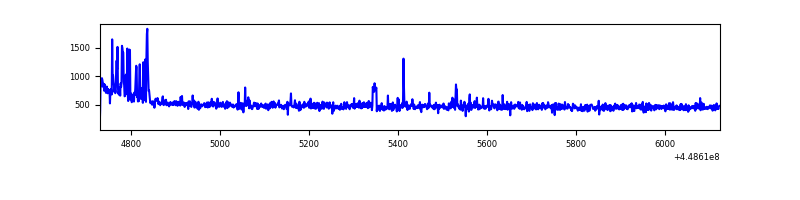 |
| D | 1393 | 1393 | 95 | 95 | 6.82% | 6.82% | 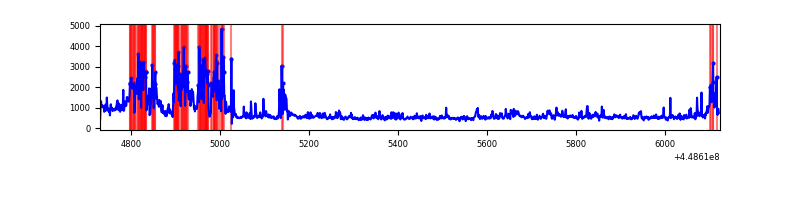 |
Top three noisy pixels from each quadrant. If the there are fewer than three noisy pixels in the level2.evt file, extra rows are filled as -1
| Pixel properties | Quadrant properties | ||||||
|---|---|---|---|---|---|---|---|
| Quadrant | DetID | PixID | Counts | Sigma | Mean | Median | Sigma |
| A | 10 | 83 | 719218 | 19000.15 | 174 | 170 | 37.8 |
| A | 13 | 254 | 2273 | 55.57 | 174 | 170 | 37.8 |
| A | 3 | 137 | 1879 | 45.16 | 174 | 170 | 37.8 |
| B | 3 | 112 | 318586 | 8699.99 | 177 | 172 | 36.6 |
| B | 4 | 171 | 54799 | 1492.57 | 177 | 172 | 36.6 |
| B | 0 | 189 | 5986 | 158.86 | 177 | 172 | 36.6 |
| C | 2 | 14 | 29300 | 677.67 | 174 | 175 | 43.0 |
| C | 1 | 90 | 4261 | 95.07 | 174 | 175 | 43.0 |
| C | 3 | 233 | 1901 | 40.16 | 174 | 175 | 43.0 |
| D | 12 | 2 | 342792 | 7945.69 | 165 | 159 | 43.1 |
| D | 11 | 241 | 74178 | 1716.51 | 165 | 159 | 43.1 |
| D | 1 | 52 | 45752 | 1057.31 | 165 | 159 | 43.1 |
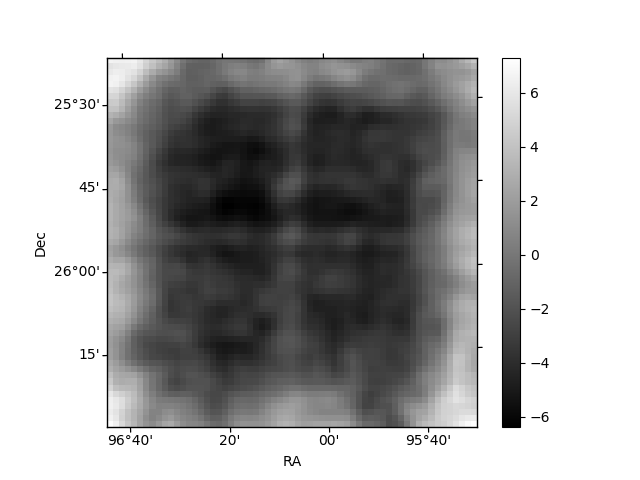
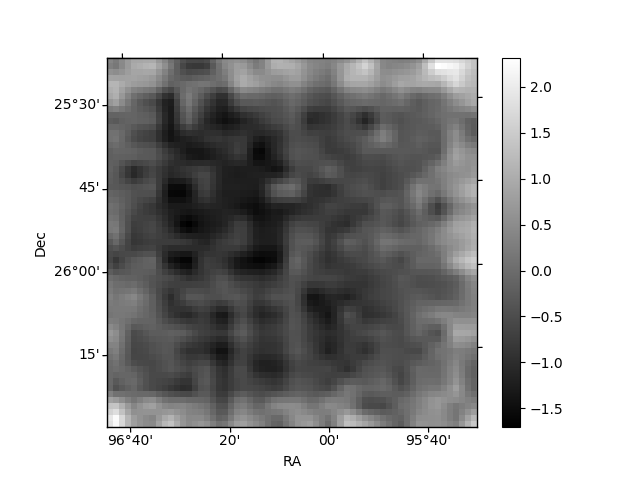
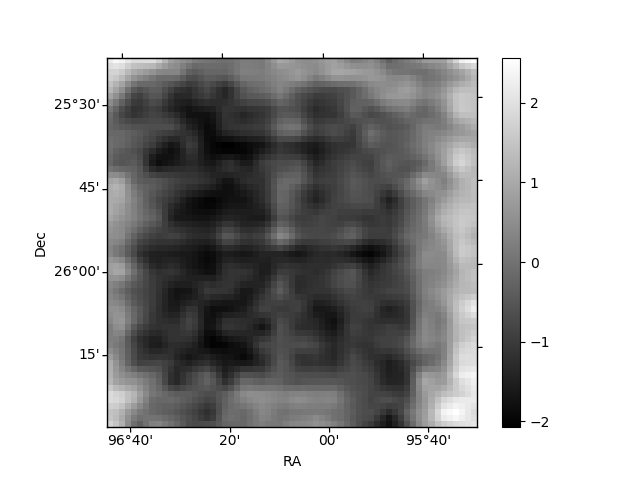
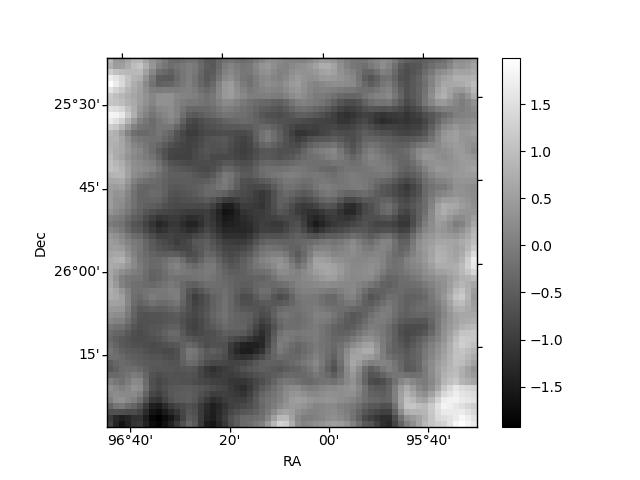
Histogram calculated using DETX and DETY for each event in the final _common_clean file
| Quadrant A | 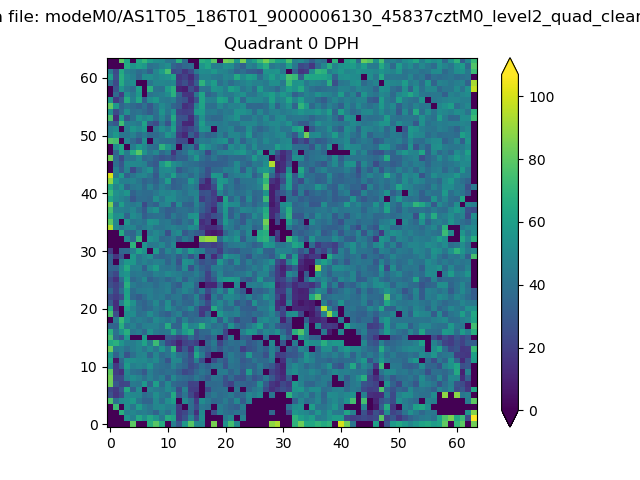 |
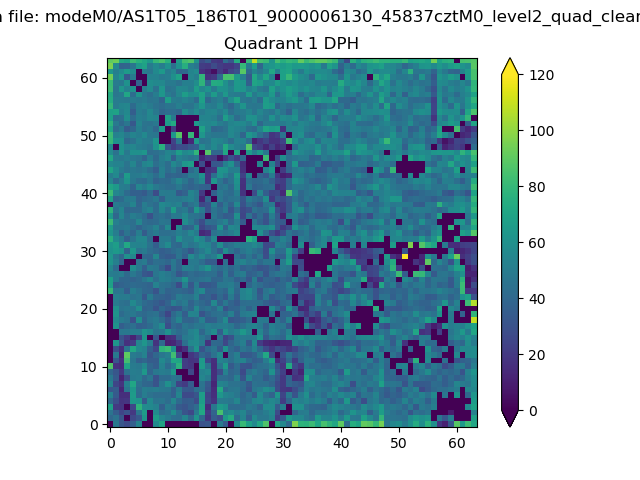 |
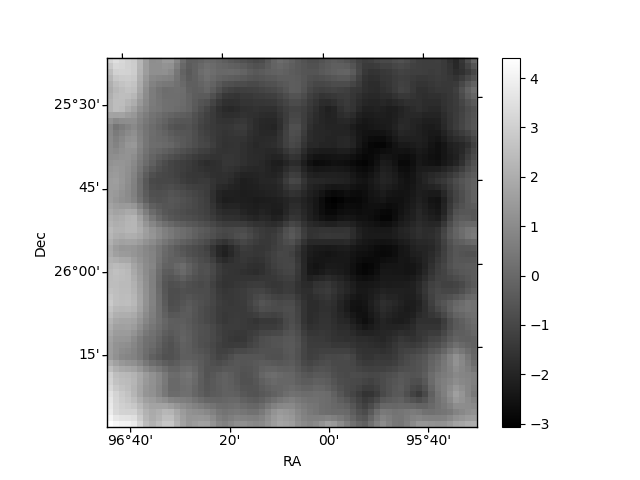
Quadrant B |
|---|---|---|---|
| Quadrant D | 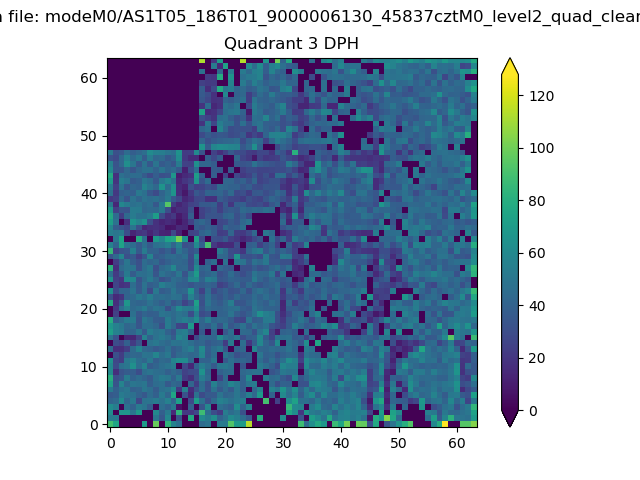 |
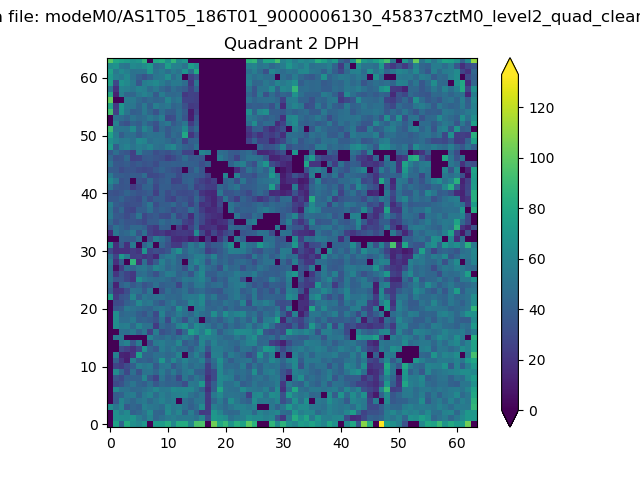 |
Quadrant C |
| Plot type | Count rate plots | Images |
|---|---|---|
| Comparison with Poisson distribution Blue bars denote a histogram of data divided into 1 sec bins. Red curve is a Poisson curve with rate = median count rate of data. |
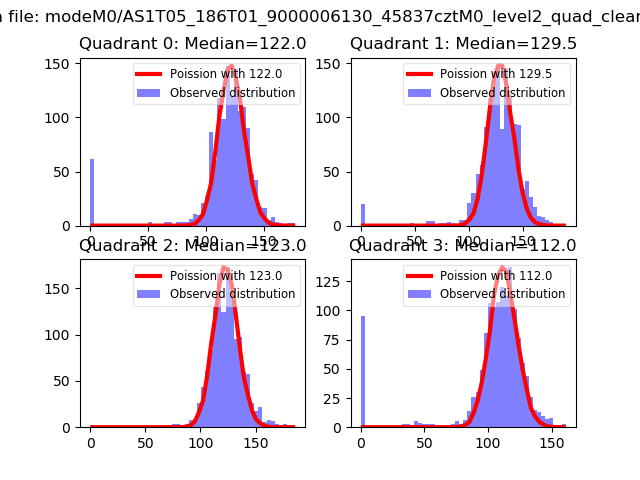 |
 |
| Quadrant-wise count rates Data is divided into 100 sec bins |
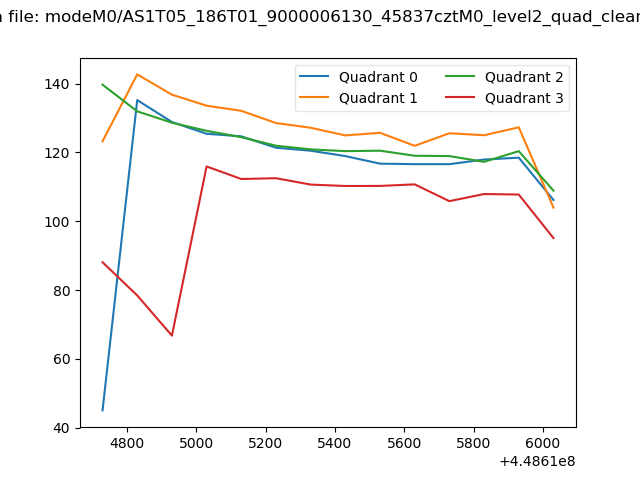 |
|
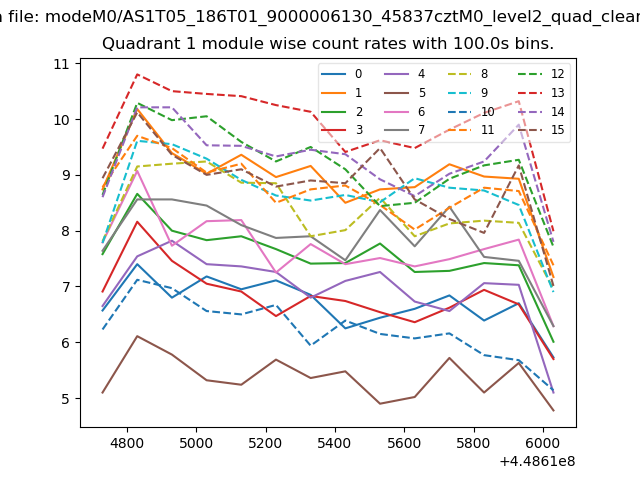
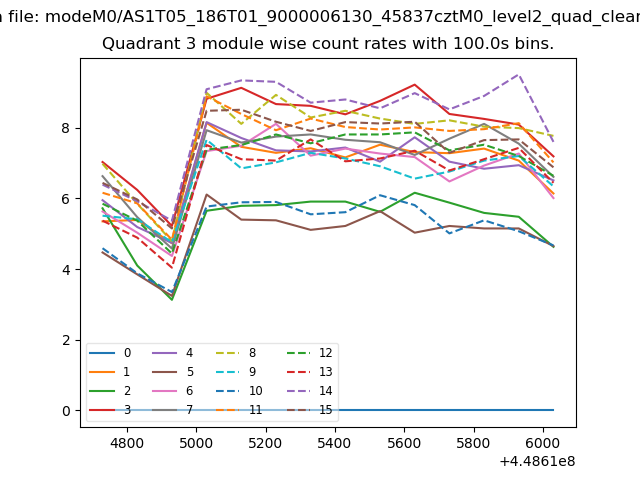
| Module-wise count rates for Quadrant A Data is divided into 100 sec bins |
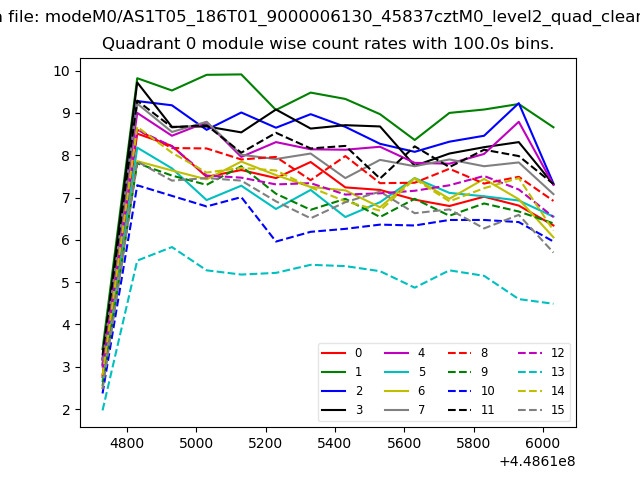 |
 |
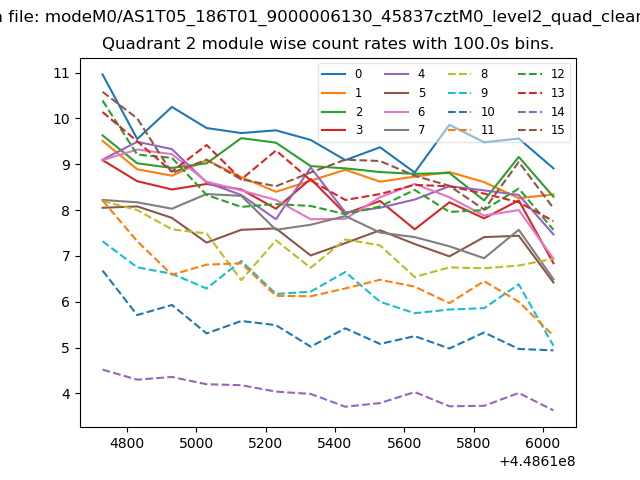
| Module-wise count rates for Quadrant B Data is divided into 100 sec bins |
 |
 |
| Module-wise count rates for Quadrant C Data is divided into 100 sec bins |
 |
 |
| Module-wise count rates for Quadrant D Data is divided into 100 sec bins |
 |
 |
| Parameter | Plot |
|---|---|
| CZT HV Monitor | 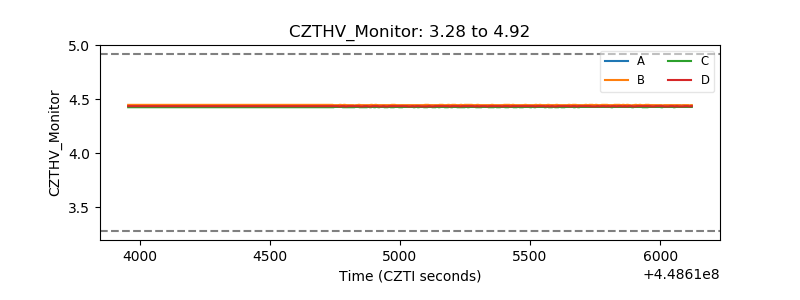 |
| D_VDD | 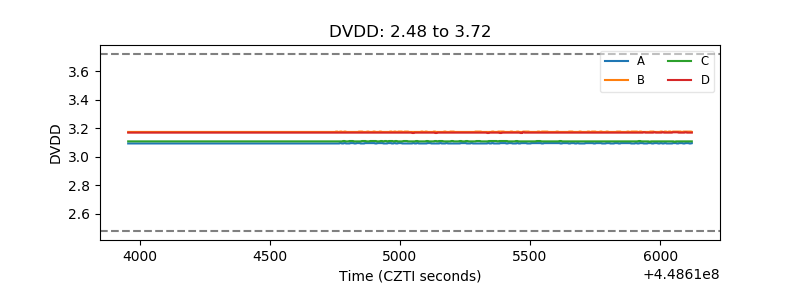 |
| Temperature 1 | 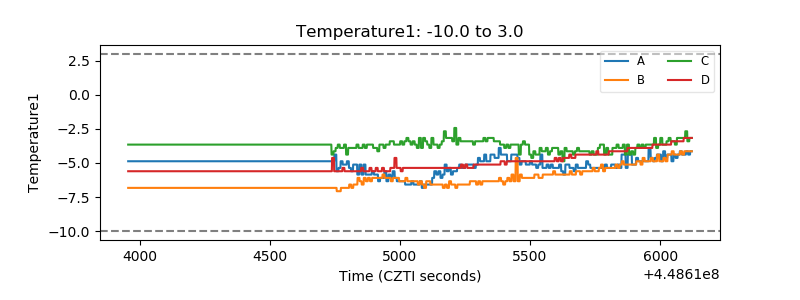 |
| Veto HV Monitor | 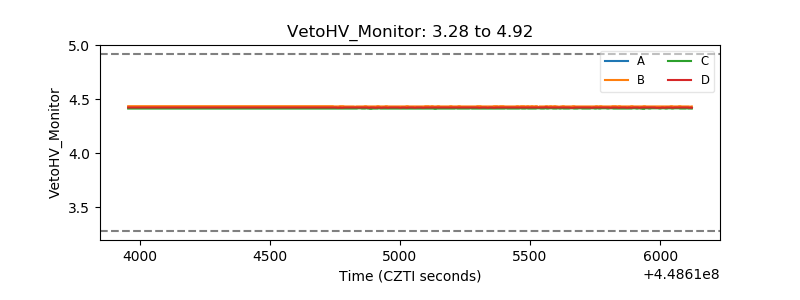 |
| Veto LLD | 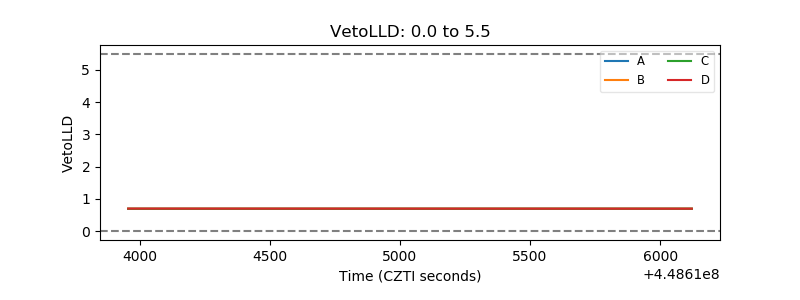 |
| Alpha Counter | 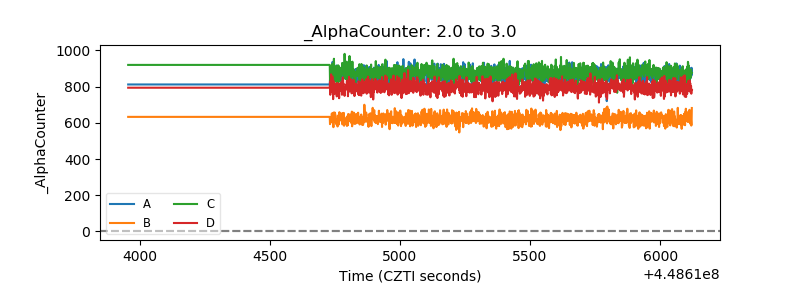 |
| _CPM_Rate | 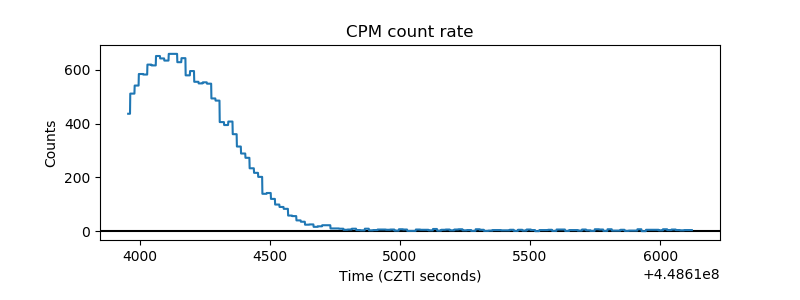 |
| CZT Counter | 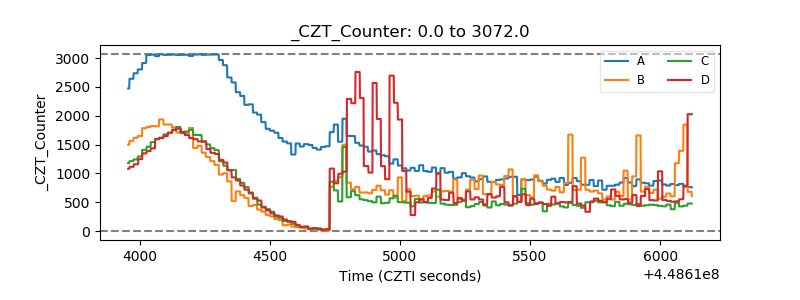 |
| +2.5 Volts monitor | 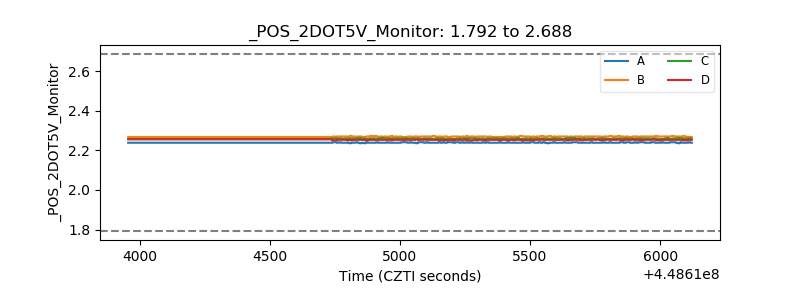 |
| +5 Volts monitor | 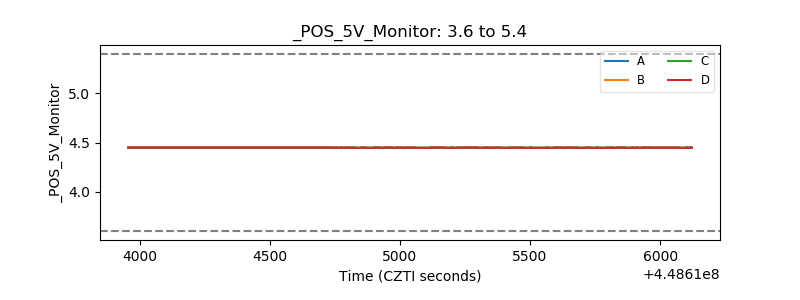 |
| _ROLL_ROT | 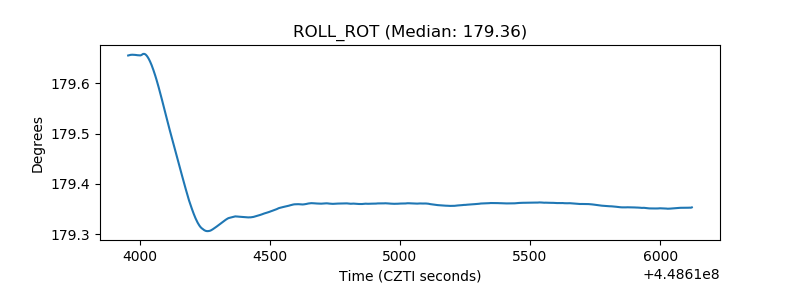 |
| _Roll_DEC | 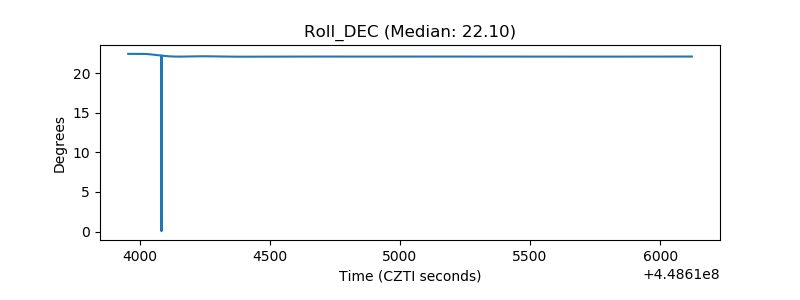 |
| _Roll_RA | 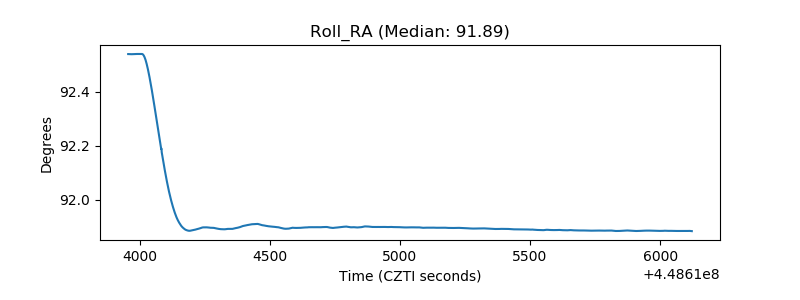 |
| Veto Counter | 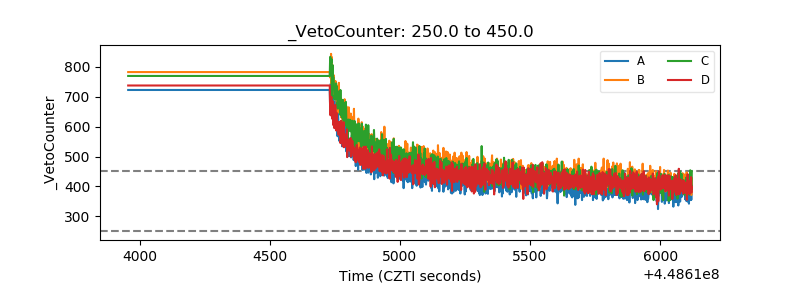 |