| Param | Original file | Final file |
|---|---|---|
| Filename | modeM0/AS1T05_186T01_9000006130_45838cztM0_level2.fits | modeM0/AS1T05_186T01_9000006130_45838cztM0_level2_quad_clean.evt |
| Size (bytes) | 685,866,240 | 100,356,480 |
| Size | 654.1 MB | 95.7 MB |
| Events in quadrant A | 5,825,027 | 710,778 |
| Events in quadrant B | 8,383,959 | 592,670 |
| Events in quadrant C | 3,039,364 | 729,559 |
| Events in quadrant D | 7,643,718 | 557,921 |
| Mode M0 | |||
|---|---|---|---|
| Quadrant | BADHDUFLAG | Total packets | Discarded packets |
| A | 0 | 21049 | 1 |
| B | 0 | 29548 | 1 |
| C | 0 | 13356 | 1 |
| D | 0 | 27067 | 1 |
| Mode M9 | |||
|---|---|---|---|
| Quadrant | BADHDUFLAG | Total packets | Discarded packets |
| A | 0 | 10 | 0 |
| B | 0 | 10 | 0 |
| C | 0 | 10 | 0 |
| D | 0 | 10 | 0 |
| Mode SS | |||
|---|---|---|---|
| Quadrant | BADHDUFLAG | Total packets | Discarded packets |
| A | 0 | 130 | 0 |
| B | 0 | 130 | 0 |
| C | 0 | 130 | 0 |
| D | 0 | 130 | 0 |
| Quadrant | Total seconds | Saturated seconds | Saturation percentage |
|---|---|---|---|
| A | 6417 | 301 | 4.690665% |
| B | 6417 | 1771 | 27.598566% |
| C | 6418 | 114 | 1.776254% |
| D | 6417 | 1282 | 19.978183% |
Noise dominated data is calculated using 1-second bins in cleaned event files. If a bin has >2000 counts, and if more than 50% of those come from <1% of pixels, then it is considered to be noise-dominated and hence unusable.
| Quadrant | # 1 sec bins | Bins with >0 counts | Bins with >2000 counts | High rate bins dominated by noise | Noise dominated (total time) | Noise dominated (detector-on time) | Marked lightcurve |
|---|---|---|---|---|---|---|---|
| A | 7422 | 6418 | 7 | 7 | 0.09% | 0.11% | 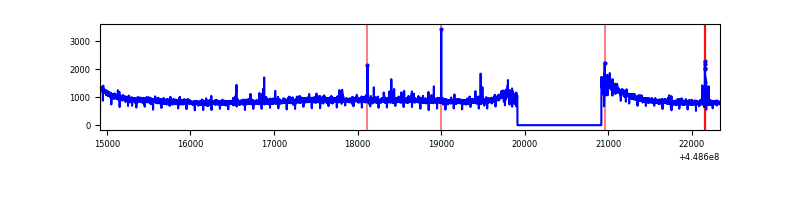 |
| B | 7422 | 6417 | 1109 | 1109 | 14.94% | 17.28% | 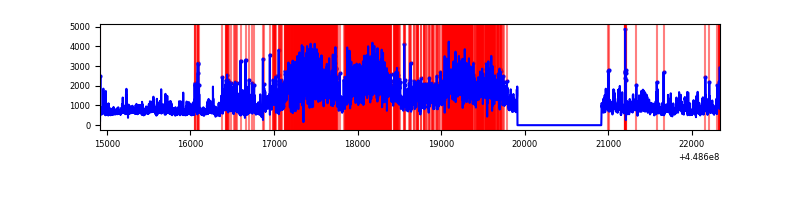 |
| C | 7423 | 6419 | 4 | 4 | 0.05% | 0.06% | 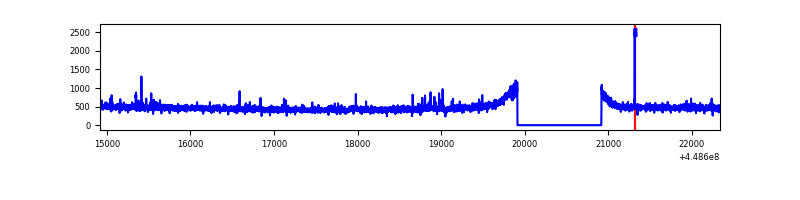 |
| D | 7422 | 6418 | 1065 | 1065 | 14.35% | 16.59% | 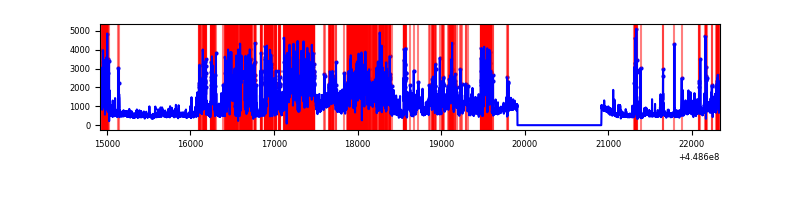 |
Top three noisy pixels from each quadrant. If the there are fewer than three noisy pixels in the level2.evt file, extra rows are filled as -1
| Pixel properties | Quadrant properties | ||||||
|---|---|---|---|---|---|---|---|
| Quadrant | DetID | PixID | Counts | Sigma | Mean | Median | Sigma |
| A | 10 | 83 | 2762055 | 17269.42 | 768 | 750 | 159.9 |
| A | 14 | 235 | 34209 | 209.26 | 768 | 750 | 159.9 |
| A | 9 | 191 | 25501 | 154.79 | 768 | 750 | 159.9 |
| B | 3 | 112 | 4613539 | 32609.08 | 709 | 688 | 141.5 |
| B | 12 | 18 | 512357 | 3617.08 | 709 | 688 | 141.5 |
| B | 0 | 189 | 119896 | 842.7 | 709 | 688 | 141.5 |
| C | 3 | 233 | 26668 | 142.87 | 763 | 767 | 181.3 |
| C | 5 | 128 | 19863 | 105.33 | 763 | 767 | 181.3 |
| C | 2 | 14 | 15859 | 83.24 | 763 | 767 | 181.3 |
| D | 12 | 2 | 1630153 | 9084.79 | 707 | 683 | 179.4 |
| D | 11 | 241 | 1446851 | 8062.83 | 707 | 683 | 179.4 |
| D | 13 | 249 | 516676 | 2876.82 | 707 | 683 | 179.4 |
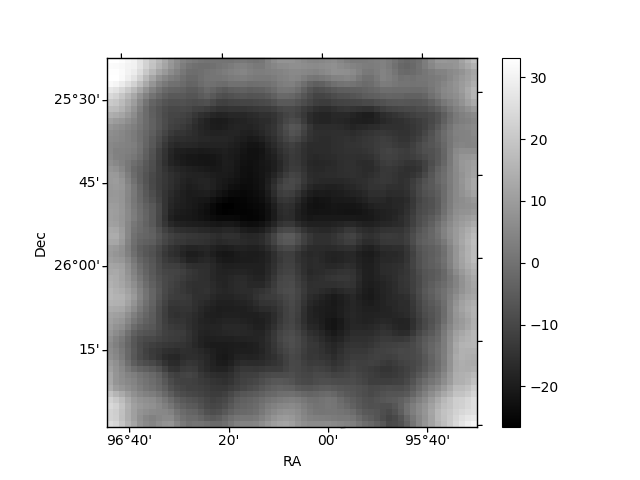
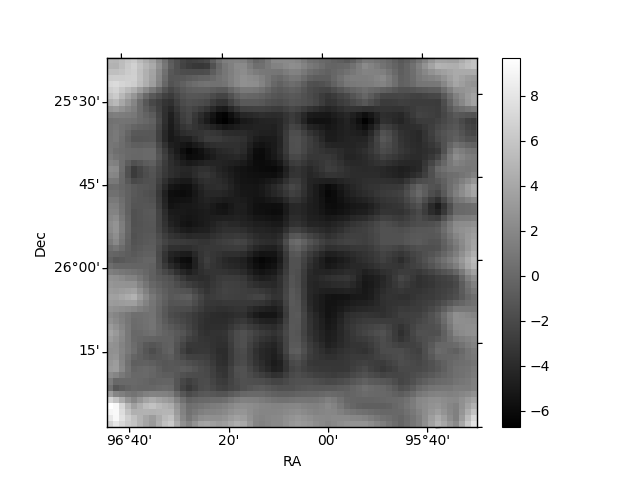
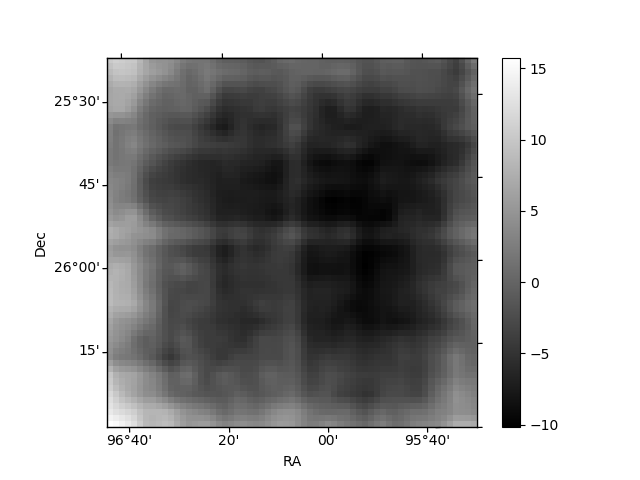
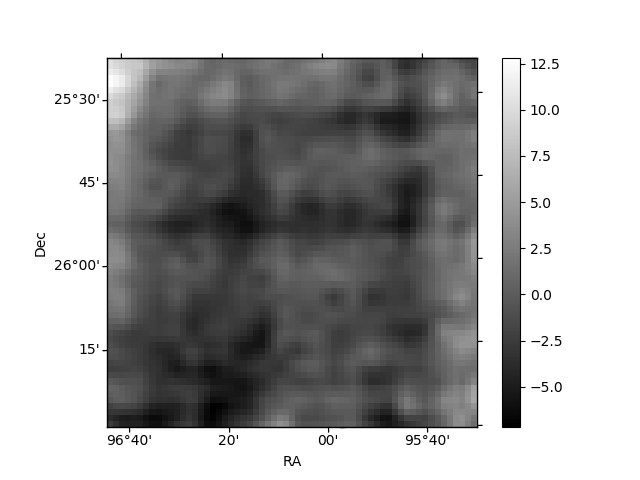
Histogram calculated using DETX and DETY for each event in the final _common_clean file
| Quadrant A | 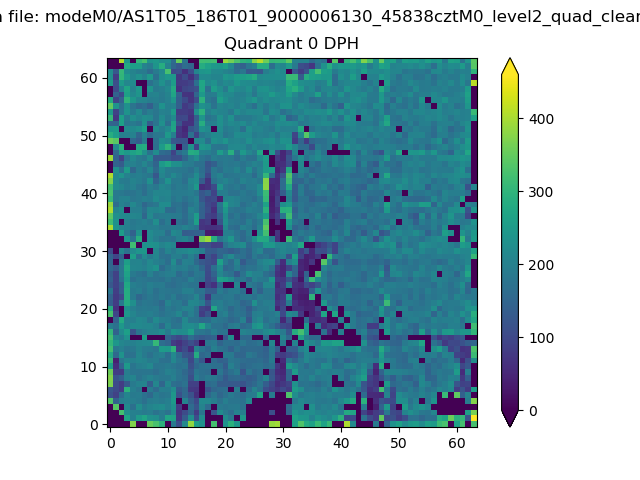 |
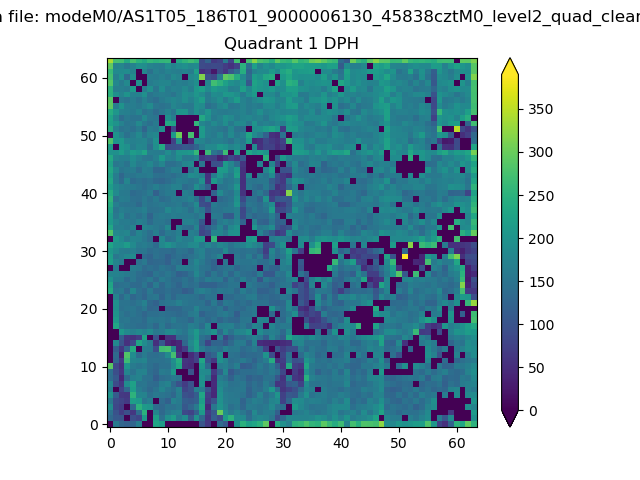 |
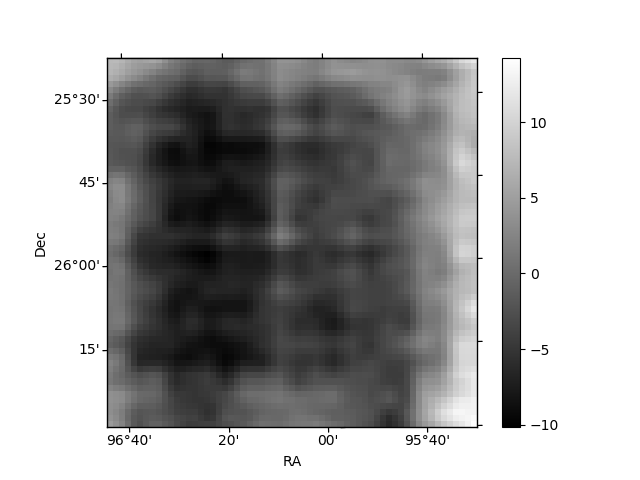
Quadrant B |
|---|---|---|---|
| Quadrant D | 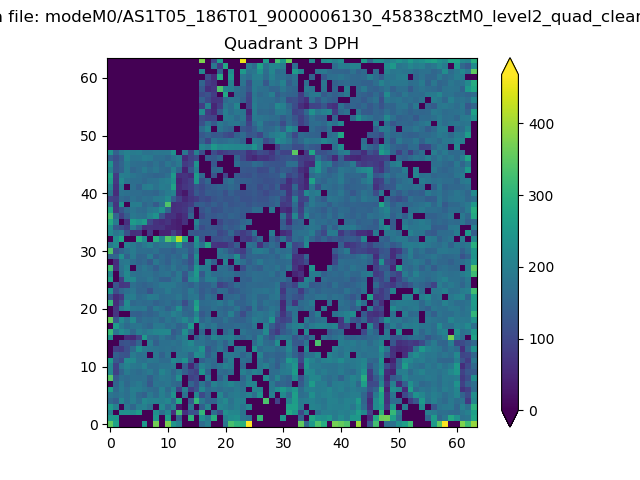 |
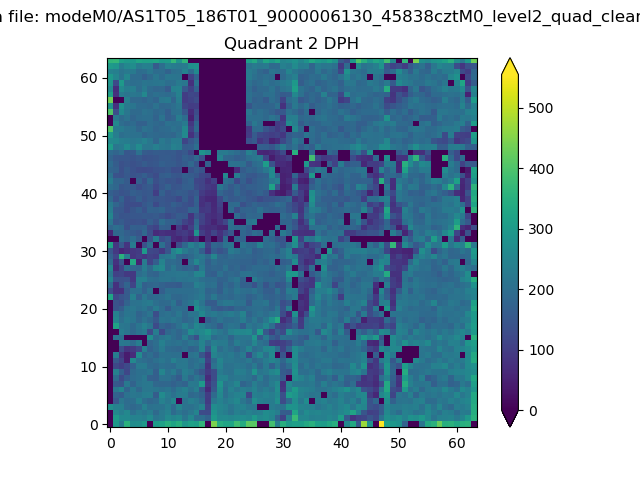 |
Quadrant C |
| Plot type | Count rate plots | Images |
|---|---|---|
| Comparison with Poisson distribution Blue bars denote a histogram of data divided into 1 sec bins. Red curve is a Poisson curve with rate = median count rate of data. |
 |
 |
| Quadrant-wise count rates Data is divided into 100 sec bins |
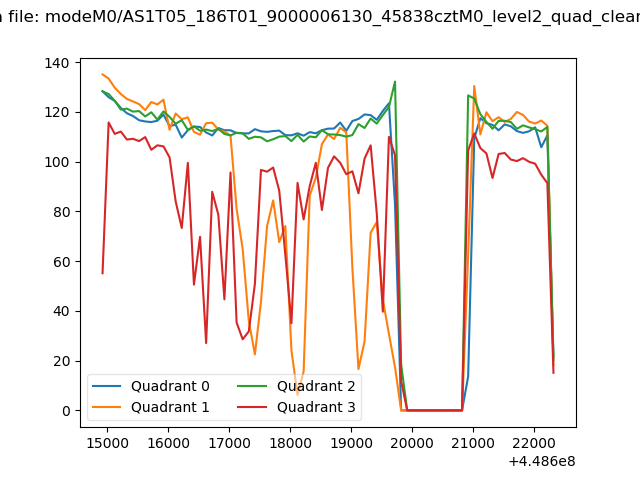 |
|
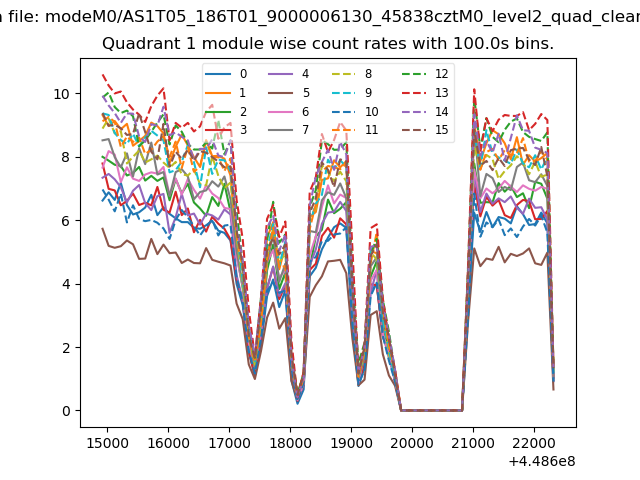
| Module-wise count rates for Quadrant A Data is divided into 100 sec bins |
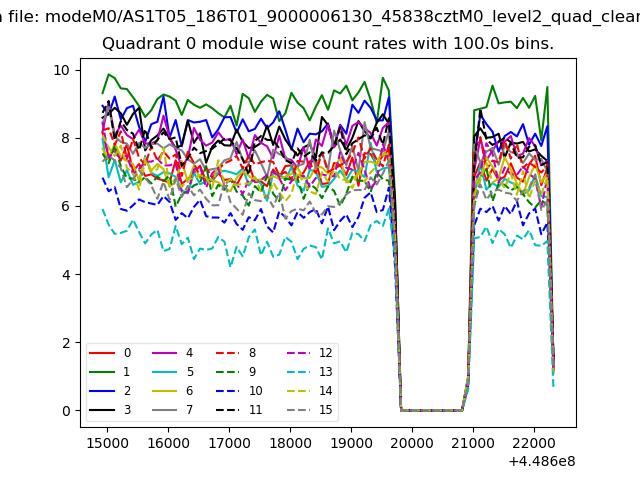 |
 |
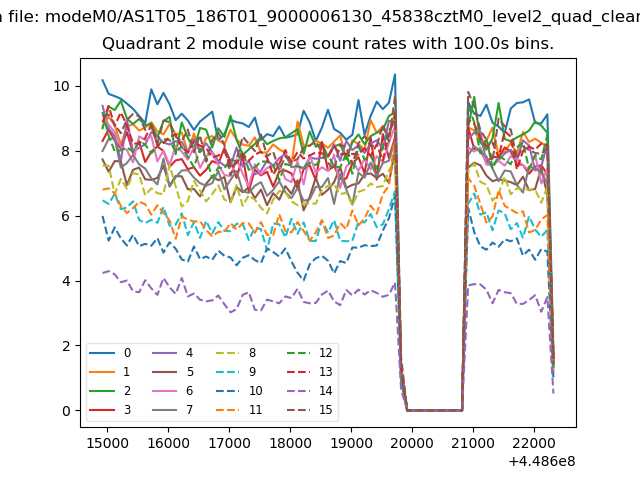
| Module-wise count rates for Quadrant B Data is divided into 100 sec bins |
 |
 |
| Module-wise count rates for Quadrant C Data is divided into 100 sec bins |
 |
 |
| Module-wise count rates for Quadrant D Data is divided into 100 sec bins |
 |
 |
| Parameter | Plot |
|---|---|
| CZT HV Monitor | 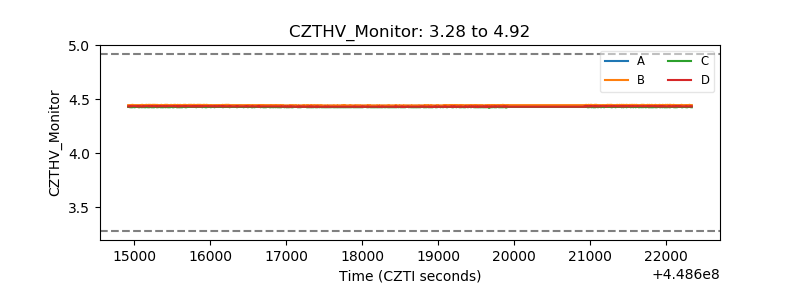 |
| D_VDD | 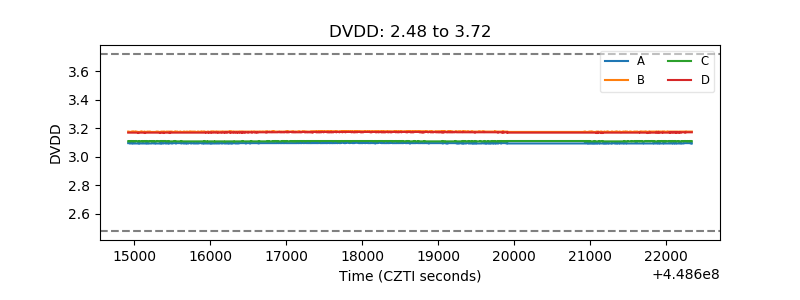 |
| Temperature 1 | 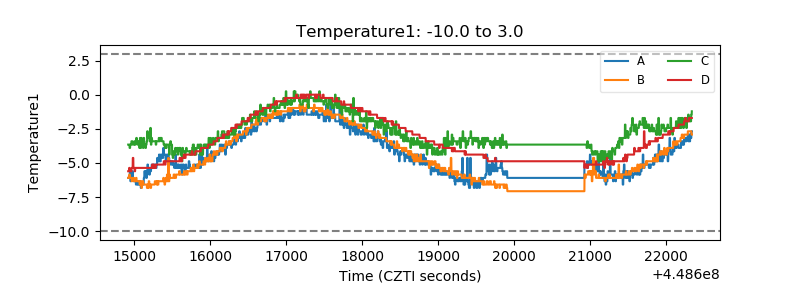 |
| Veto HV Monitor | 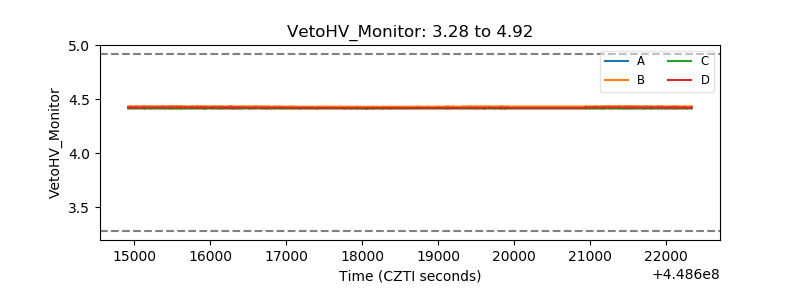 |
| Veto LLD | 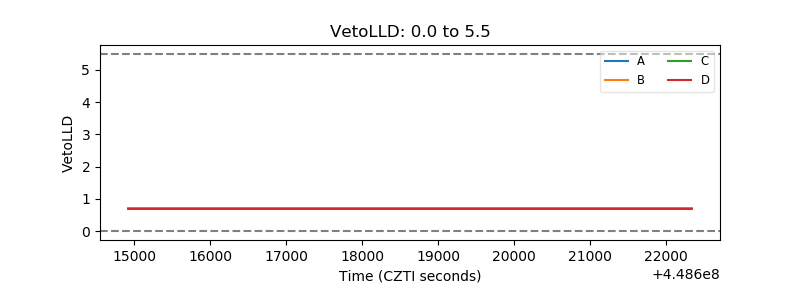 |
| Alpha Counter |  |
| _CPM_Rate | 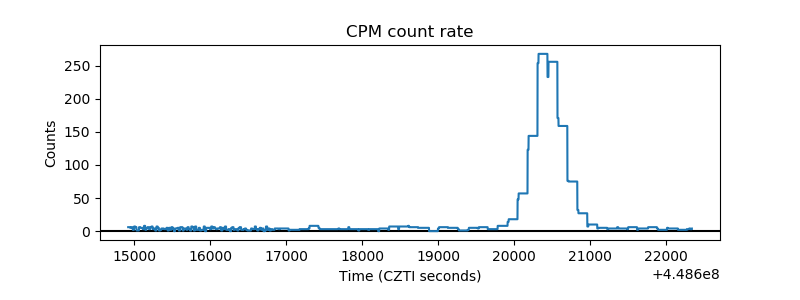 |
| CZT Counter | 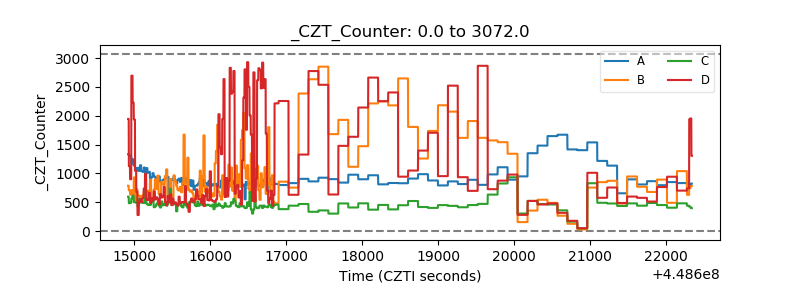 |
| +2.5 Volts monitor | 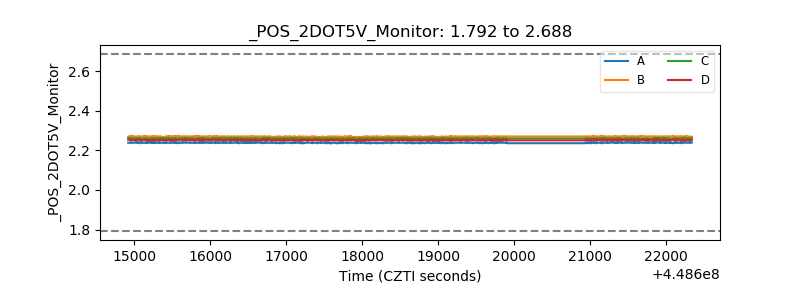 |
| +5 Volts monitor |  |
| _ROLL_ROT | 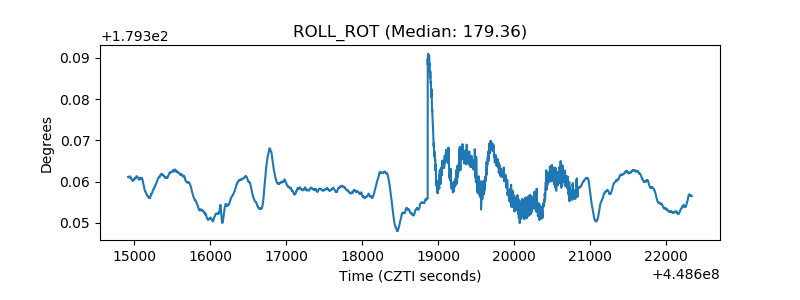 |
| _Roll_DEC | 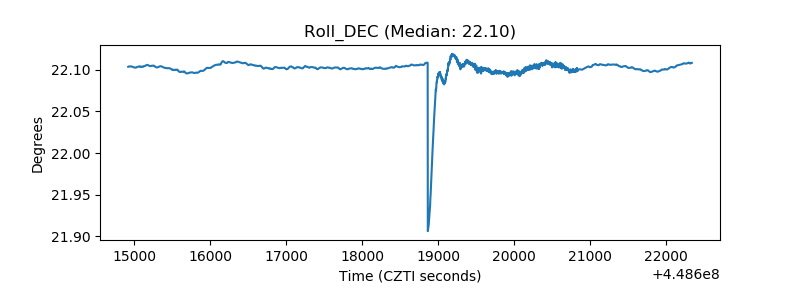 |
| _Roll_RA | 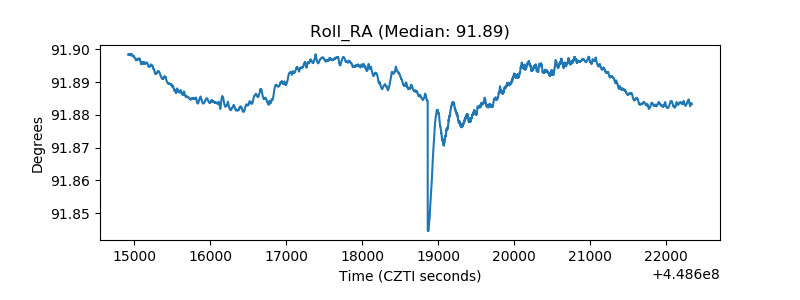 |
| Veto Counter | 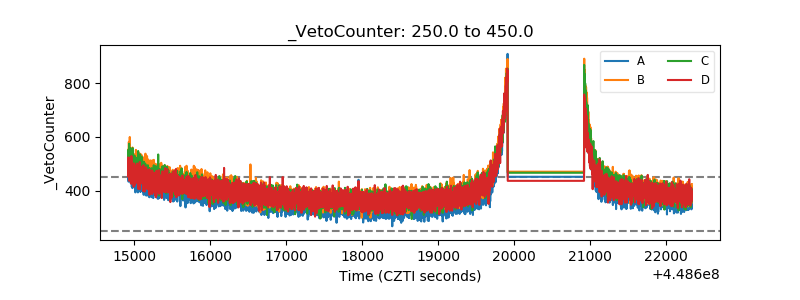 |