| Param | Original file | Final file |
|---|---|---|
| Filename | modeM0/AS1T05_186T01_9000006130_45839cztM0_level2.fits | modeM0/AS1T05_186T01_9000006130_45839cztM0_level2_quad_clean.evt |
| Size (bytes) | 727,747,200 | 109,457,280 |
| Size | 694.0 MB | 104.4 MB |
| Events in quadrant A | 6,903,634 | 734,692 |
| Events in quadrant B | 7,845,651 | 722,981 |
| Events in quadrant C | 3,461,064 | 772,738 |
| Events in quadrant D | 8,186,898 | 595,348 |
| Mode M0 | |||
|---|---|---|---|
| Quadrant | BADHDUFLAG | Total packets | Discarded packets |
| A | 0 | 24937 | 2 |
| B | 0 | 28349 | 2 |
| C | 0 | 15131 | 2 |
| D | 0 | 29207 | 2 |
| Mode M9 | |||
|---|---|---|---|
| Quadrant | BADHDUFLAG | Total packets | Discarded packets |
| A | 0 | 8 | 0 |
| B | 0 | 8 | 0 |
| C | 0 | 8 | 0 |
| D | 0 | 8 | 0 |
| Mode SS | |||
|---|---|---|---|
| Quadrant | BADHDUFLAG | Total packets | Discarded packets |
| A | 0 | 142 | 0 |
| B | 0 | 142 | 0 |
| C | 0 | 142 | 0 |
| D | 0 | 142 | 0 |
| Quadrant | Total seconds | Saturated seconds | Saturation percentage |
|---|---|---|---|
| A | 7010 | 487 | 6.947218% |
| B | 7011 | 1036 | 14.776779% |
| C | 7011 | 133 | 1.897019% |
| D | 7011 | 1308 | 18.656397% |
Noise dominated data is calculated using 1-second bins in cleaned event files. If a bin has >2000 counts, and if more than 50% of those come from <1% of pixels, then it is considered to be noise-dominated and hence unusable.
| Quadrant | # 1 sec bins | Bins with >0 counts | Bins with >2000 counts | High rate bins dominated by noise | Noise dominated (total time) | Noise dominated (detector-on time) | Marked lightcurve |
|---|---|---|---|---|---|---|---|
| A | 7765 | 7011 | 31 | 31 | 0.40% | 0.44% | 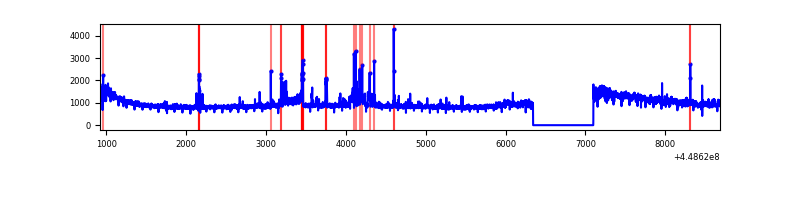 |
| B | 7766 | 7012 | 541 | 541 | 6.97% | 7.72% | 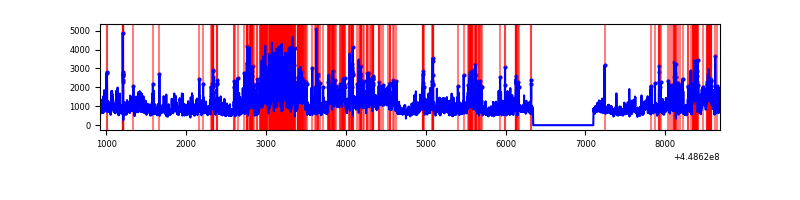 |
| C | 7766 | 7012 | 23 | 23 | 0.30% | 0.33% | 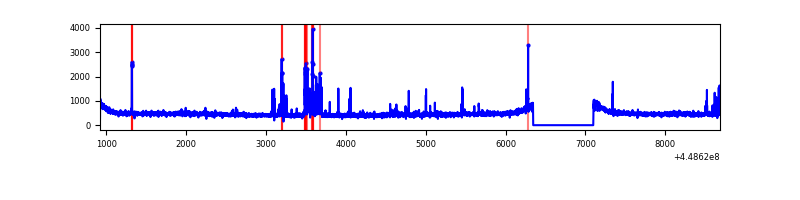 |
| D | 7766 | 7012 | 984 | 984 | 12.67% | 14.03% | 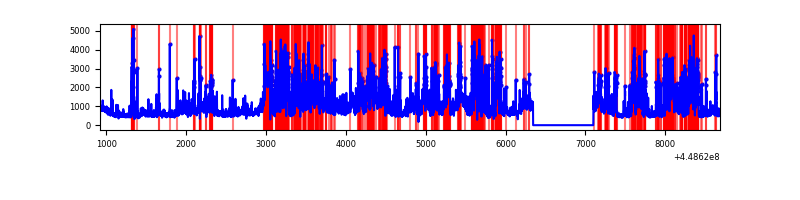 |
Top three noisy pixels from each quadrant. If the there are fewer than three noisy pixels in the level2.evt file, extra rows are filled as -1
| Pixel properties | Quadrant properties | ||||||
|---|---|---|---|---|---|---|---|
| Quadrant | DetID | PixID | Counts | Sigma | Mean | Median | Sigma |
| A | 10 | 83 | 3055728 | 18009.38 | 814 | 797 | 169.6 |
| A | 15 | 14 | 480426 | 2827.5 | 814 | 797 | 169.6 |
| A | 0 | 247 | 80314 | 468.77 | 814 | 797 | 169.6 |
| B | 3 | 112 | 4249529 | 26733.09 | 794 | 769 | 158.9 |
| B | 4 | 171 | 155028 | 970.59 | 794 | 769 | 158.9 |
| B | 0 | 171 | 64964 | 403.91 | 794 | 769 | 158.9 |
| C | 14 | 254 | 165262 | 853.53 | 817 | 822 | 192.7 |
| C | 3 | 233 | 43994 | 224.08 | 817 | 822 | 192.7 |
| C | 12 | 250 | 32590 | 164.89 | 817 | 822 | 192.7 |
| D | 12 | 2 | 1975657 | 10188.03 | 761 | 737 | 193.8 |
| D | 11 | 241 | 1390197 | 7167.82 | 761 | 737 | 193.8 |
| D | 13 | 249 | 909277 | 4686.89 | 761 | 737 | 193.8 |
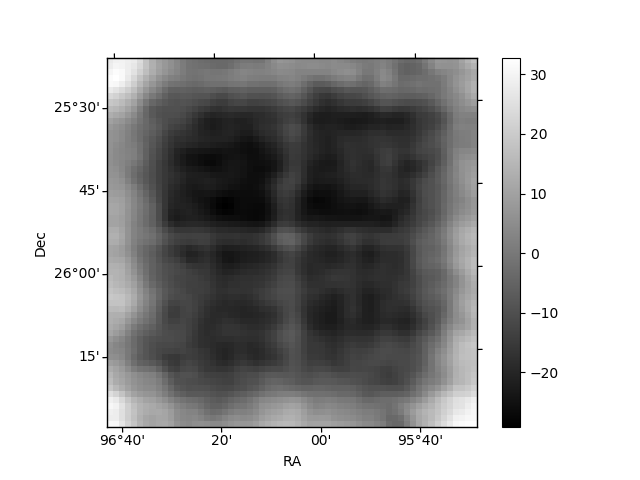
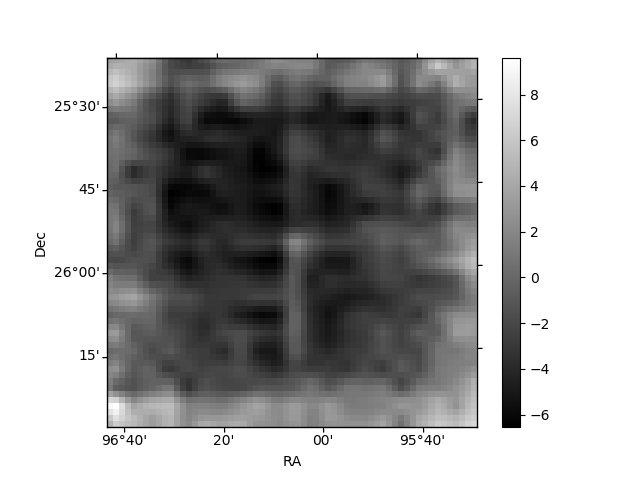
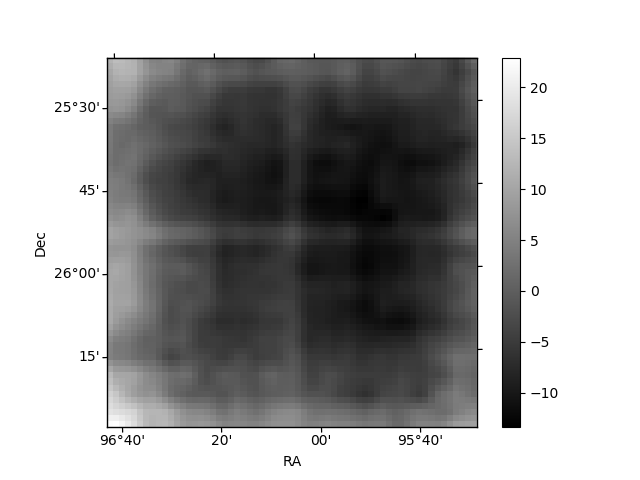
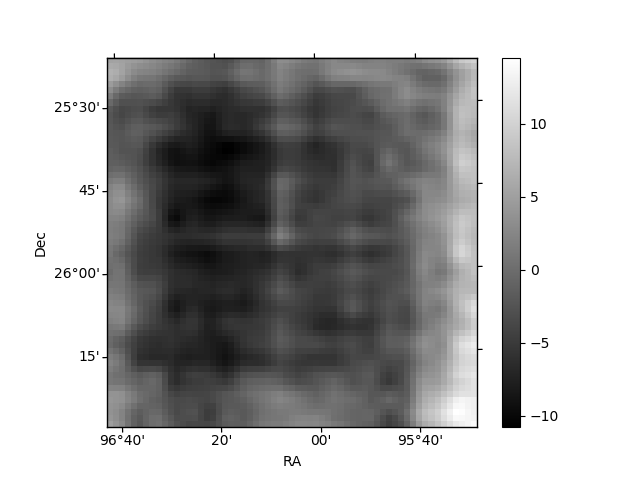
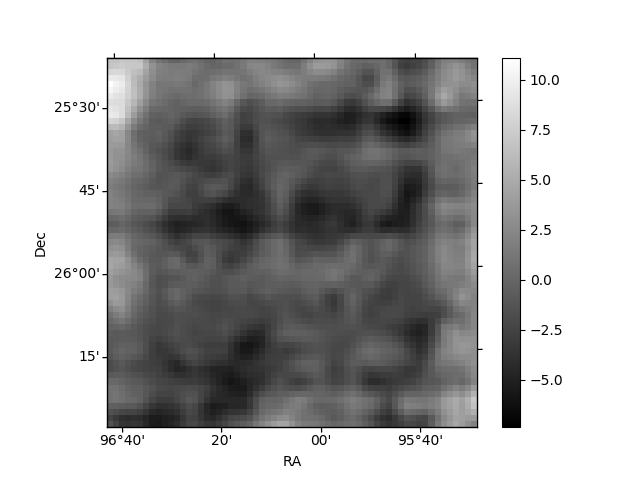
Histogram calculated using DETX and DETY for each event in the final _common_clean file
| Quadrant A | 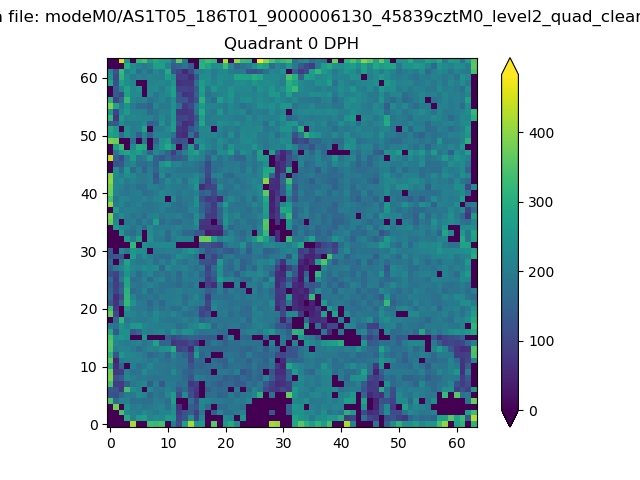 |
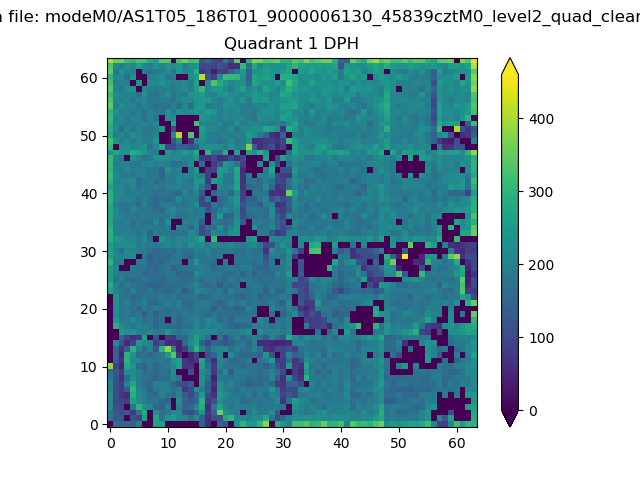 |
Quadrant B |
|---|---|---|---|
| Quadrant D | 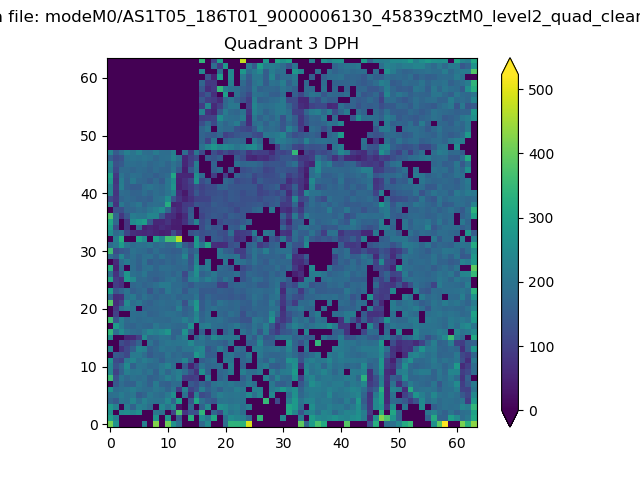 |
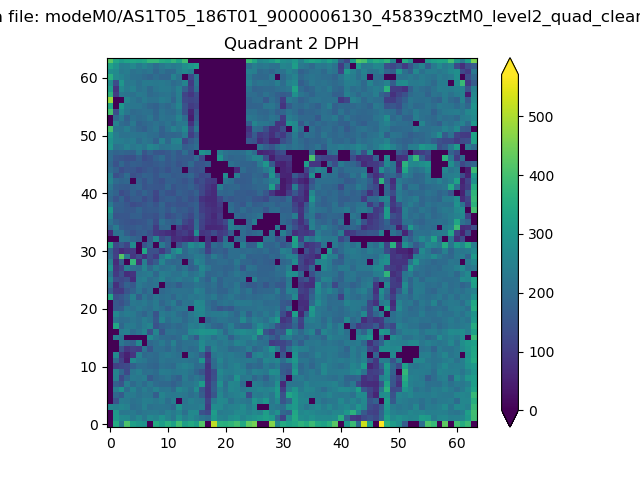 |
Quadrant C |
| Plot type | Count rate plots | Images |
|---|---|---|
| Comparison with Poisson distribution Blue bars denote a histogram of data divided into 1 sec bins. Red curve is a Poisson curve with rate = median count rate of data. |
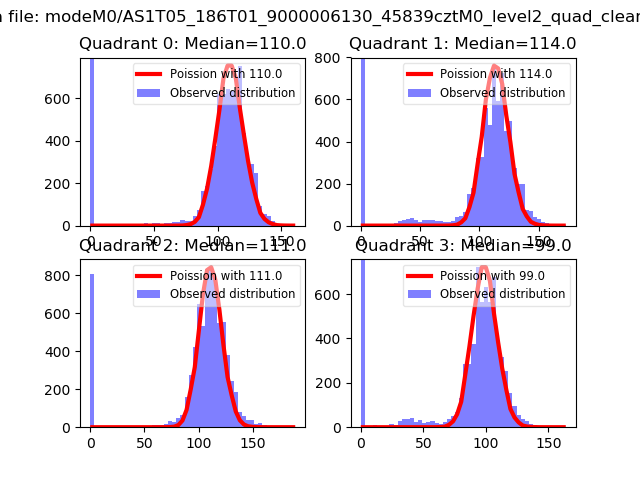 |
 |
| Quadrant-wise count rates Data is divided into 100 sec bins |
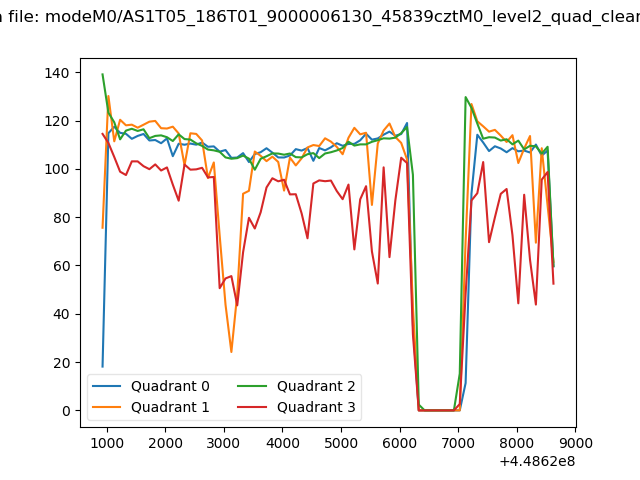 |
|
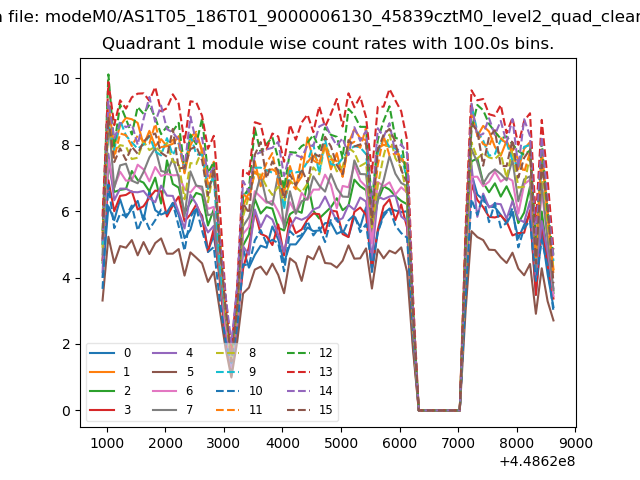
| Module-wise count rates for Quadrant A Data is divided into 100 sec bins |
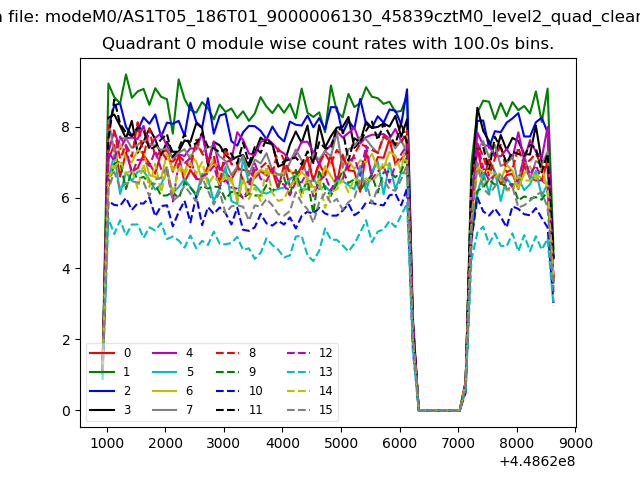 |
 |
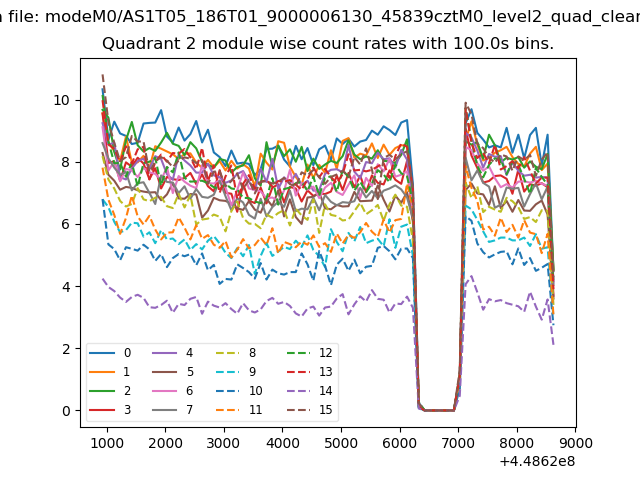
| Module-wise count rates for Quadrant B Data is divided into 100 sec bins |
 |
 |
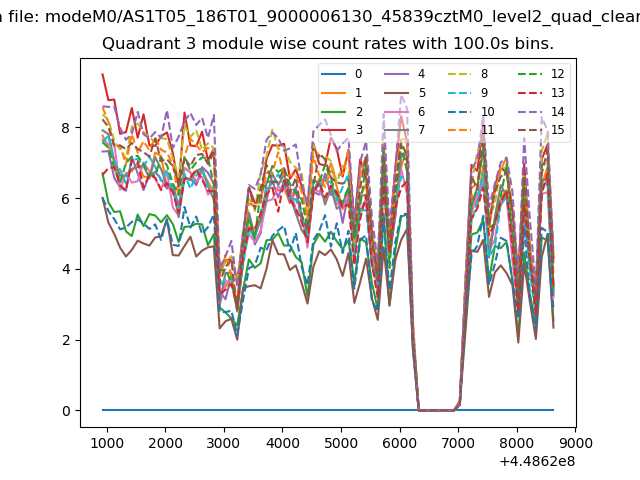
| Module-wise count rates for Quadrant C Data is divided into 100 sec bins |
 |
 |
| Module-wise count rates for Quadrant D Data is divided into 100 sec bins |
 |
 |
| Parameter | Plot |
|---|---|
| CZT HV Monitor |  |
| D_VDD | 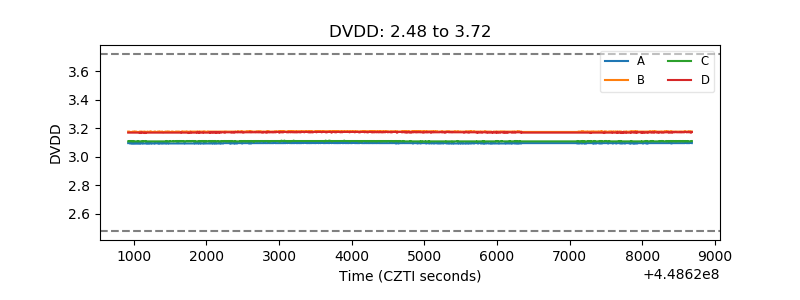 |
| Temperature 1 | 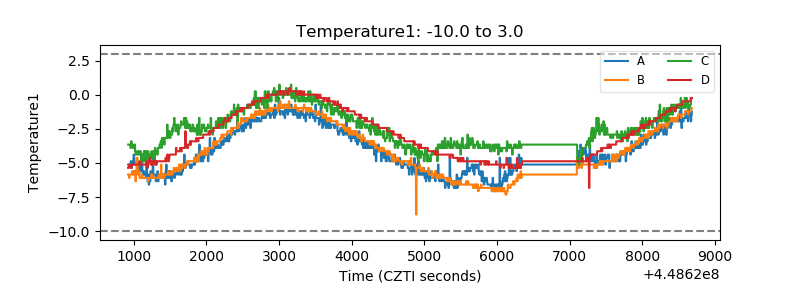 |
| Veto HV Monitor | 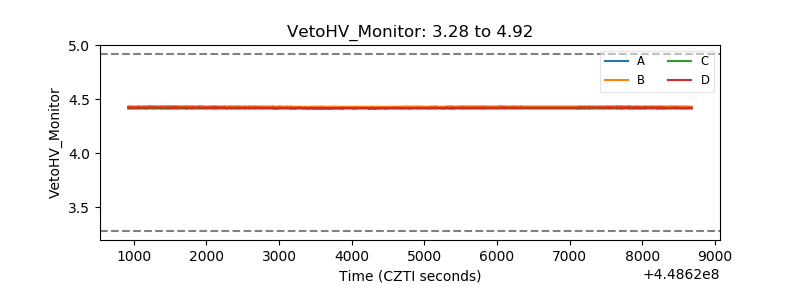 |
| Veto LLD | 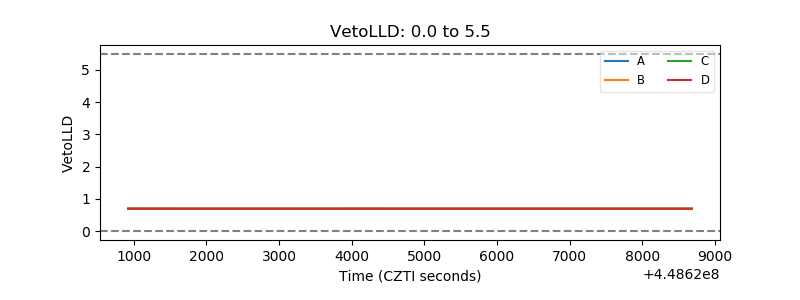 |
| Alpha Counter | 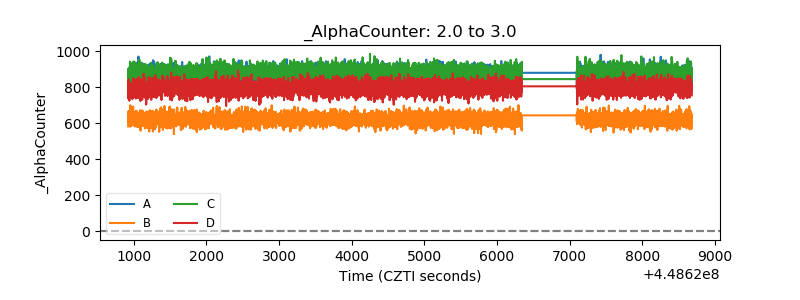 |
| _CPM_Rate | 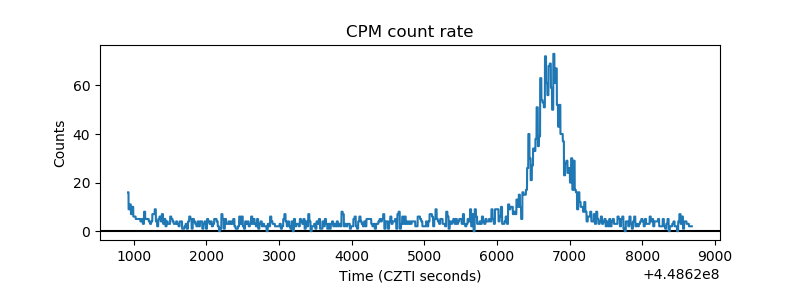 |
| CZT Counter | 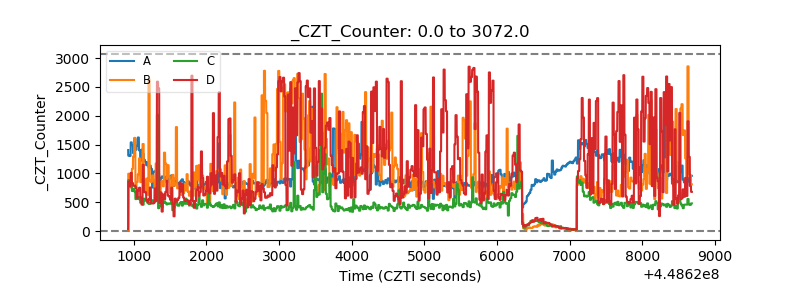 |
| +2.5 Volts monitor | 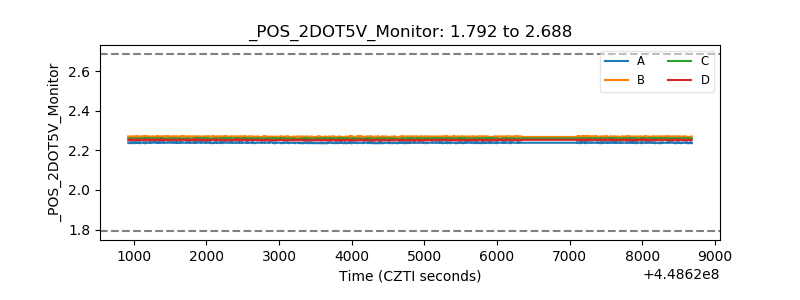 |
| +5 Volts monitor | 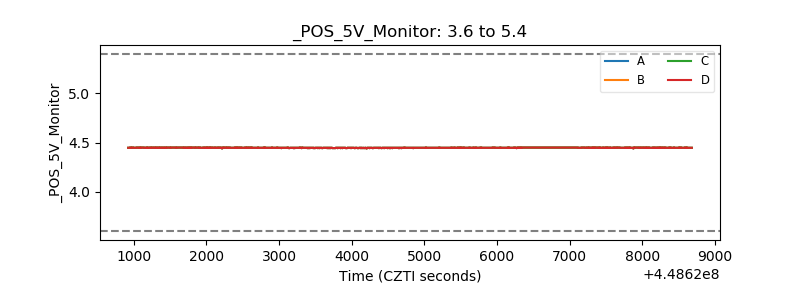 |
| _ROLL_ROT | 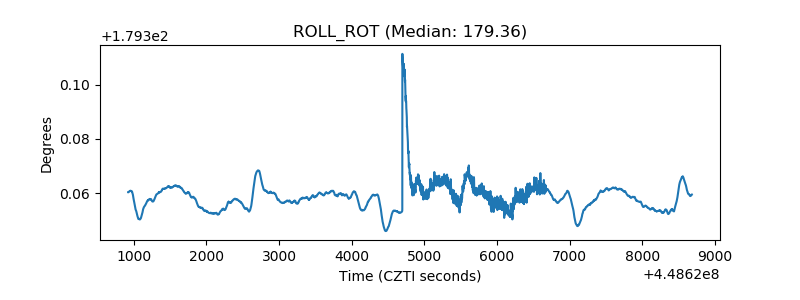 |
| _Roll_DEC | 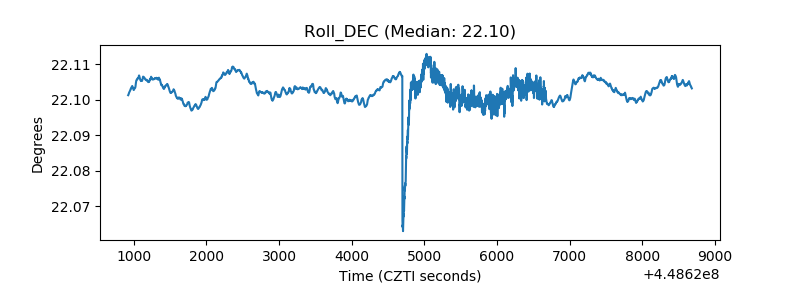 |
| _Roll_RA | 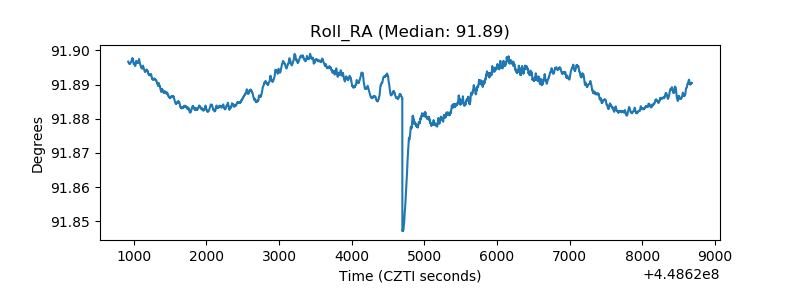 |
| Veto Counter | 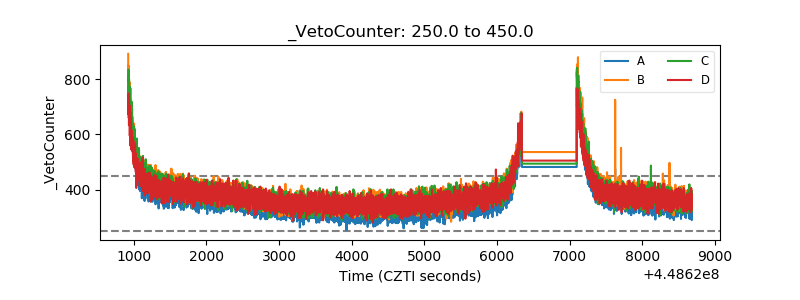 |