| Param | Original file | Final file |
|---|---|---|
| Filename | modeM0/AS1T05_186T01_9000006130_45845cztM0_level2.fits | modeM0/AS1T05_186T01_9000006130_45845cztM0_level2_quad_clean.evt |
| Size (bytes) | 2,002,020,480 | 257,616,000 |
| Size | 1.9 GB | 245.7 MB |
| Events in quadrant A | 18,509,401 | 1,755,540 |
| Events in quadrant B | 27,990,464 | 1,288,462 |
| Events in quadrant C | 8,105,080 | 1,929,741 |
| Events in quadrant D | 18,072,052 | 1,544,086 |
| Mode M0 | |||
|---|---|---|---|
| Quadrant | BADHDUFLAG | Total packets | Discarded packets |
| A | 0 | 67341 | 4 |
| B | 0 | 96170 | 4 |
| C | 0 | 37948 | 4 |
| D | 0 | 66652 | 4 |
| Mode M9 | |||
|---|---|---|---|
| Quadrant | BADHDUFLAG | Total packets | Discarded packets |
| A | 0 | 13 | 0 |
| B | 0 | 13 | 0 |
| C | 0 | 13 | 0 |
| D | 0 | 13 | 0 |
| Mode SS | |||
|---|---|---|---|
| Quadrant | BADHDUFLAG | Total packets | Discarded packets |
| A | 0 | 380 | 0 |
| B | 0 | 380 | 0 |
| C | 0 | 380 | 0 |
| D | 0 | 380 | 0 |
| Quadrant | Total seconds | Saturated seconds | Saturation percentage |
|---|---|---|---|
| A | 18575 | 1586 | 8.538358% |
| B | 18576 | 6844 | 36.843239% |
| C | 18576 | 56 | 0.301464% |
| D | 18576 | 2384 | 12.833764% |
Noise dominated data is calculated using 1-second bins in cleaned event files. If a bin has >2000 counts, and if more than 50% of those come from <1% of pixels, then it is considered to be noise-dominated and hence unusable.
| Quadrant | # 1 sec bins | Bins with >0 counts | Bins with >2000 counts | High rate bins dominated by noise | Noise dominated (total time) | Noise dominated (detector-on time) | Marked lightcurve |
|---|---|---|---|---|---|---|---|
| A | 20000 | 18579 | 1215 | 1215 | 6.08% | 6.54% | 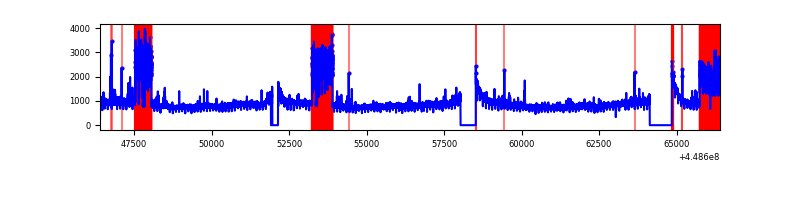 |
| B | 20001 | 18579 | 4698 | 4698 | 23.49% | 25.29% | 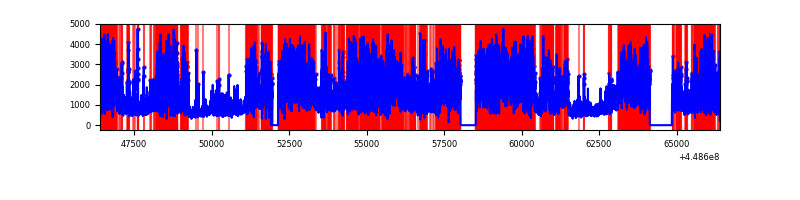 |
| C | 20001 | 18580 | 14 | 14 | 0.07% | 0.08% | 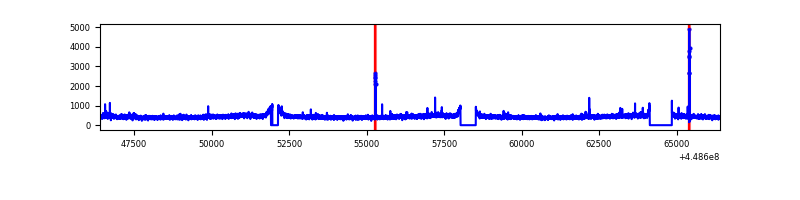 |
| D | 20001 | 18579 | 1907 | 1907 | 9.53% | 10.26% | 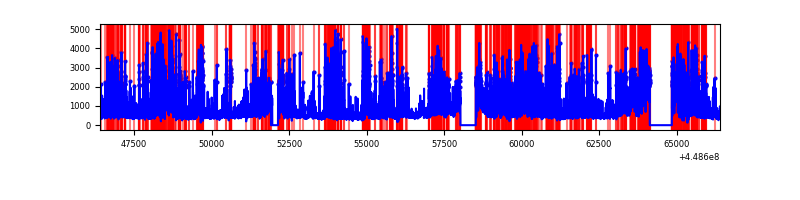 |
Top three noisy pixels from each quadrant. If the there are fewer than three noisy pixels in the level2.evt file, extra rows are filled as -1
| Pixel properties | Quadrant properties | ||||||
|---|---|---|---|---|---|---|---|
| Quadrant | DetID | PixID | Counts | Sigma | Mean | Median | Sigma |
| A | 10 | 83 | 7492536 | 17844.71 | 2022 | 1978 | 419.8 |
| A | 15 | 14 | 2667082 | 6349.06 | 2022 | 1978 | 419.8 |
| A | 2 | 79 | 202275 | 477.17 | 2022 | 1978 | 419.8 |
| B | 3 | 112 | 20300437 | 58795.2 | 1752 | 1694 | 345.2 |
| B | 4 | 171 | 164134 | 470.51 | 1752 | 1694 | 345.2 |
| B | 0 | 183 | 132901 | 380.04 | 1752 | 1694 | 345.2 |
| C | 12 | 249 | 39488 | 77.57 | 2046 | 2056 | 482.6 |
| C | 12 | 2 | 38006 | 74.5 | 2046 | 2056 | 482.6 |
| C | 3 | 233 | 34242 | 66.7 | 2046 | 2056 | 482.6 |
| D | 13 | 249 | 3146495 | 6417.07 | 1935 | 1878 | 490.0 |
| D | 1 | 52 | 2825894 | 5762.84 | 1935 | 1878 | 490.0 |
| D | 12 | 2 | 1536915 | 3132.48 | 1935 | 1878 | 490.0 |
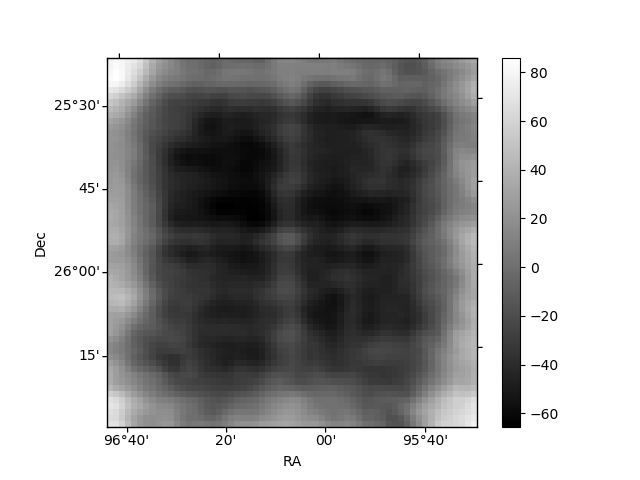
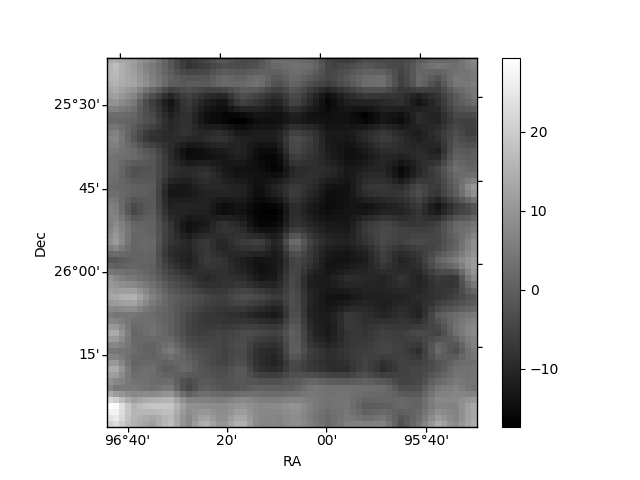
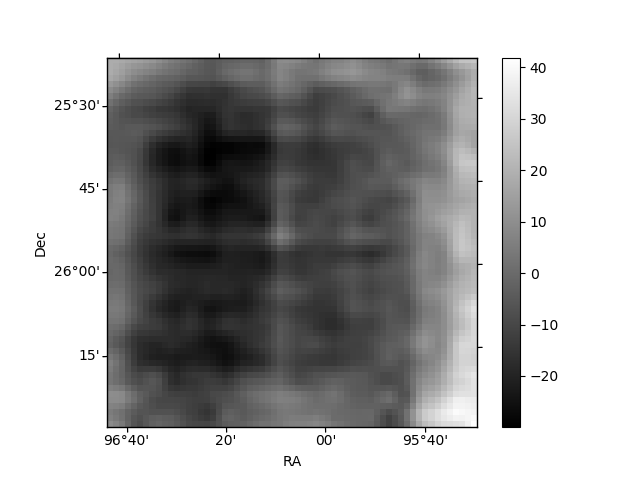
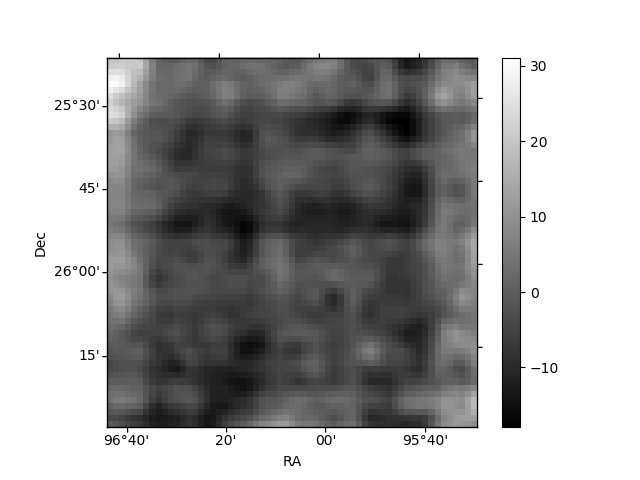
Histogram calculated using DETX and DETY for each event in the final _common_clean file
| Quadrant A | 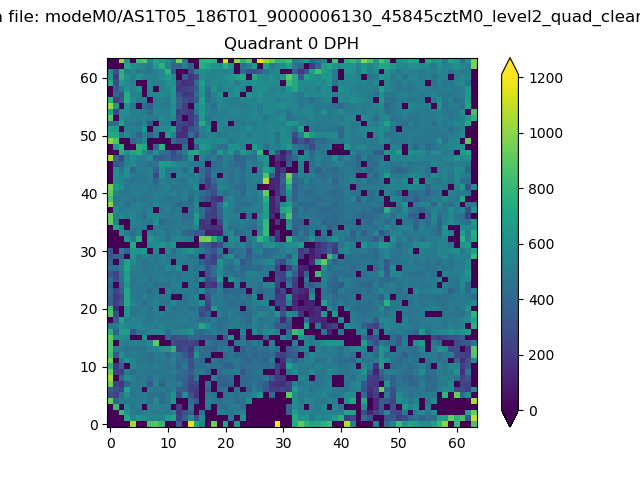 |
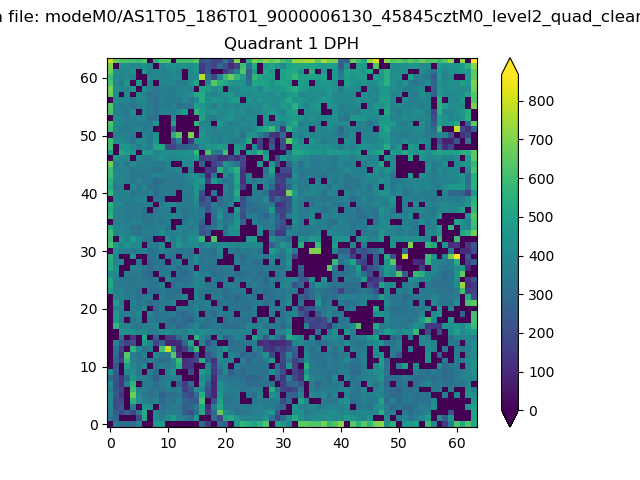 |
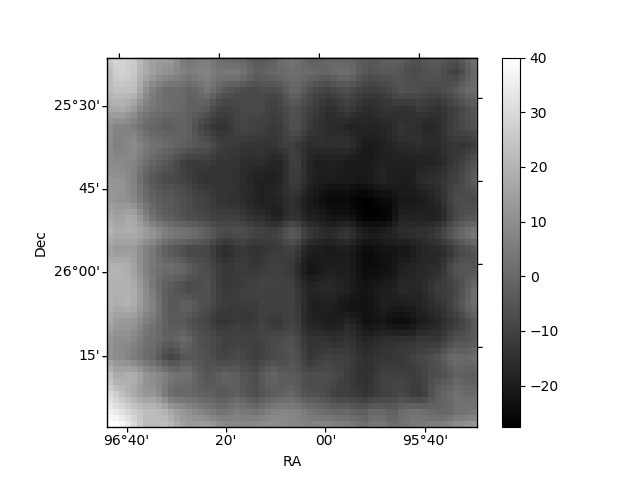
Quadrant B |
|---|---|---|---|
| Quadrant D | 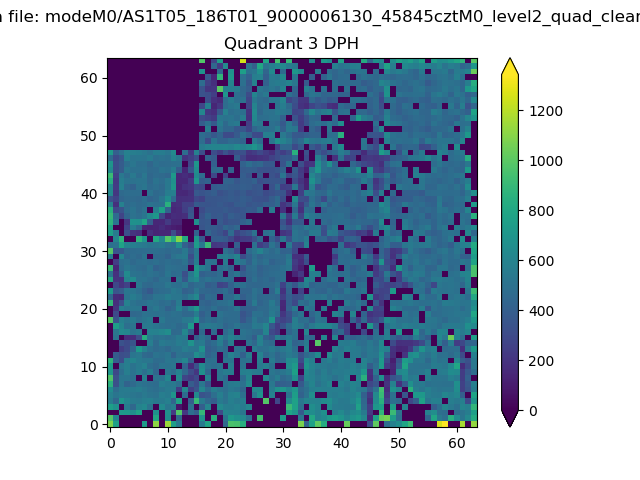 |
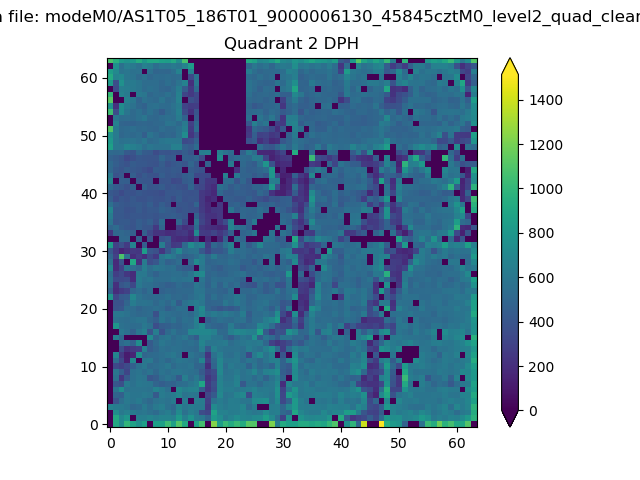 |
Quadrant C |
| Plot type | Count rate plots | Images |
|---|---|---|
| Comparison with Poisson distribution Blue bars denote a histogram of data divided into 1 sec bins. Red curve is a Poisson curve with rate = median count rate of data. |
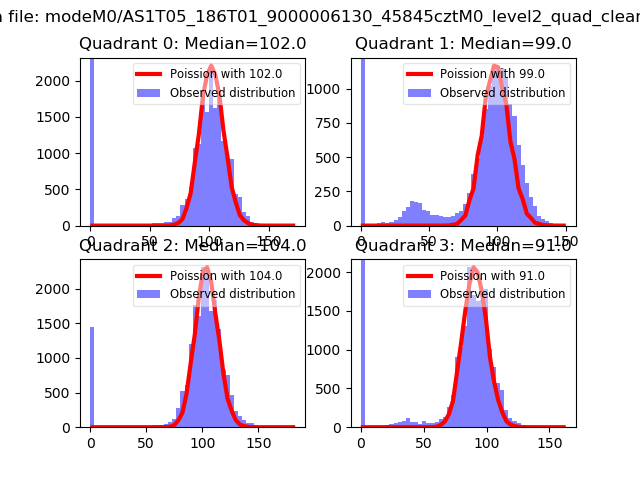 |
 |
| Quadrant-wise count rates Data is divided into 100 sec bins |
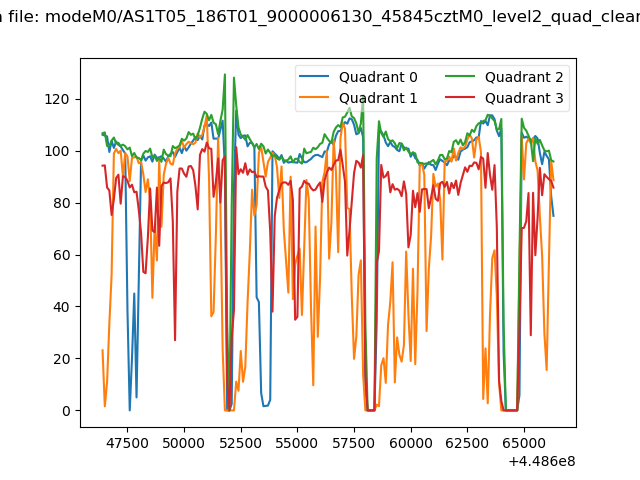 |
|
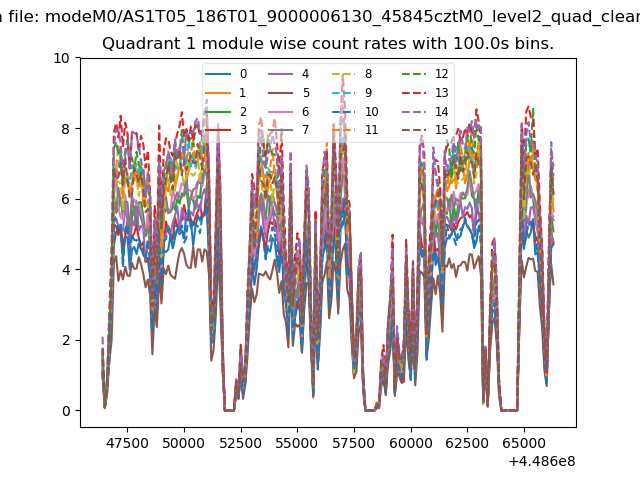
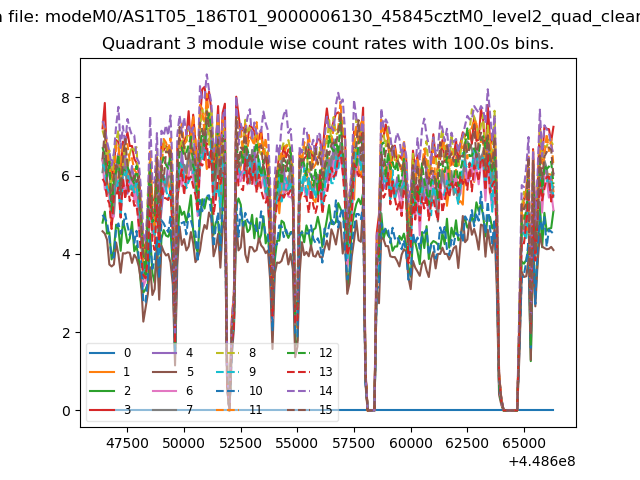
| Module-wise count rates for Quadrant A Data is divided into 100 sec bins |
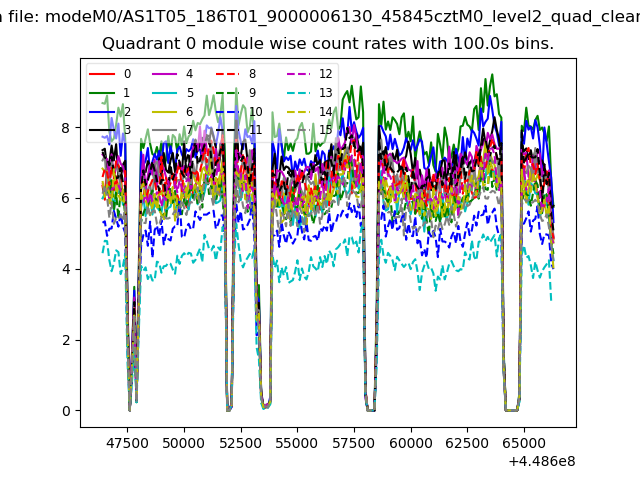 |
 |
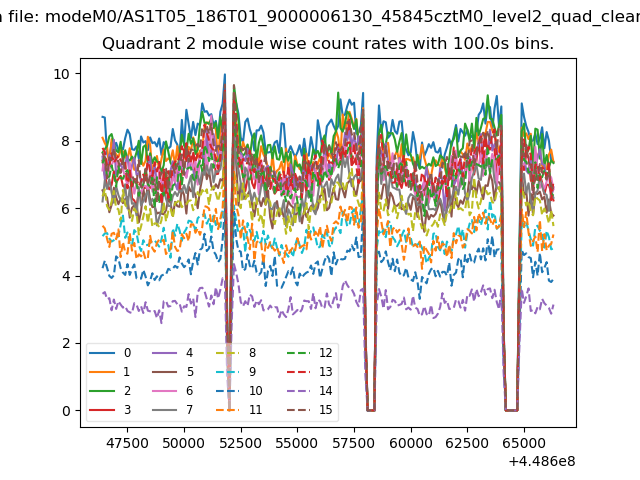
| Module-wise count rates for Quadrant B Data is divided into 100 sec bins |
 |
 |
| Module-wise count rates for Quadrant C Data is divided into 100 sec bins |
 |
 |
| Module-wise count rates for Quadrant D Data is divided into 100 sec bins |
 |
 |
| Parameter | Plot |
|---|---|
| CZT HV Monitor | 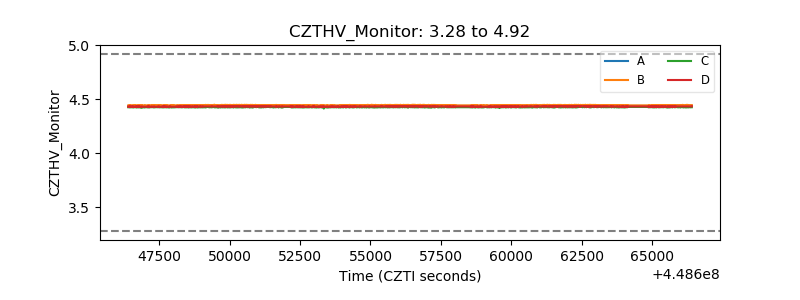 |
| D_VDD | 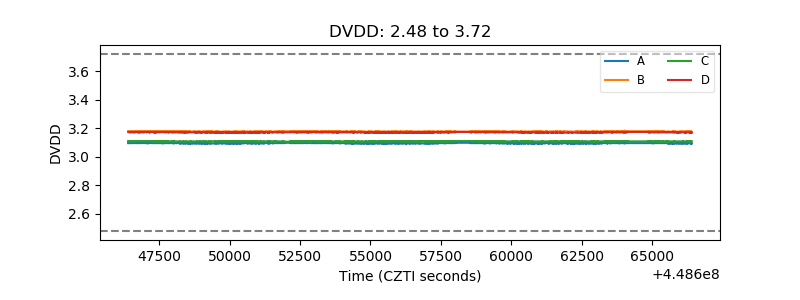 |
| Temperature 1 | 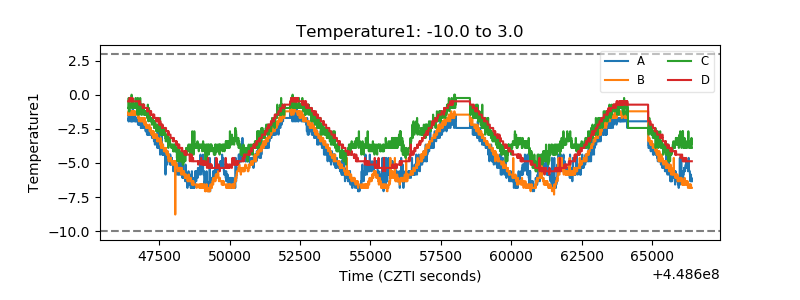 |
| Veto HV Monitor | 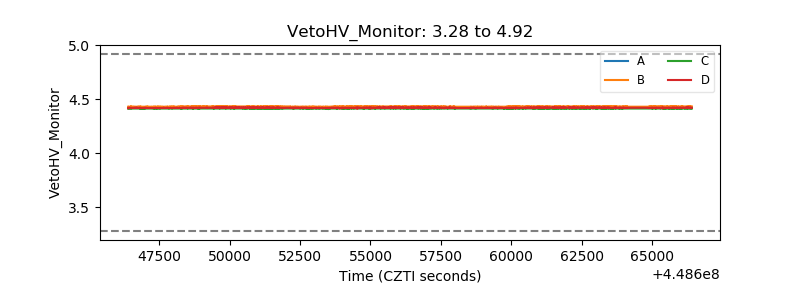 |
| Veto LLD | 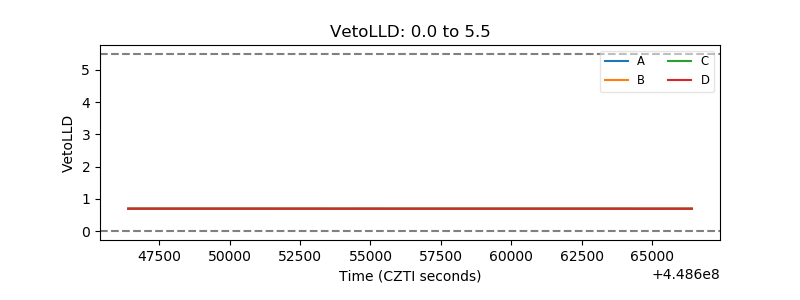 |
| Alpha Counter |  |
| _CPM_Rate | 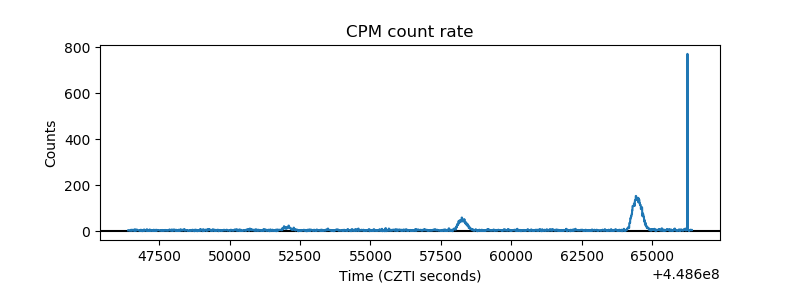 |
| CZT Counter | 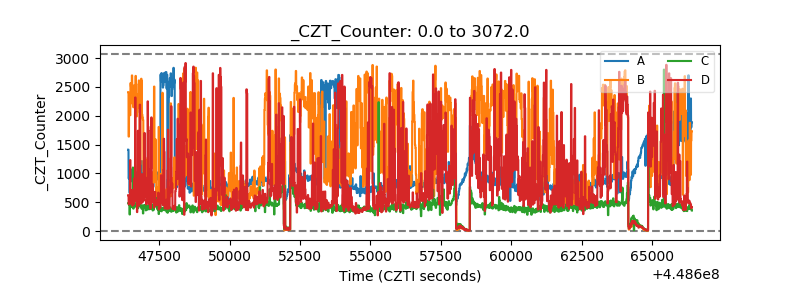 |
| +2.5 Volts monitor | 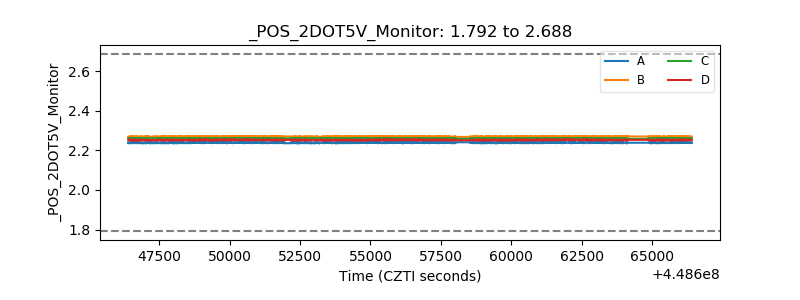 |
| +5 Volts monitor | 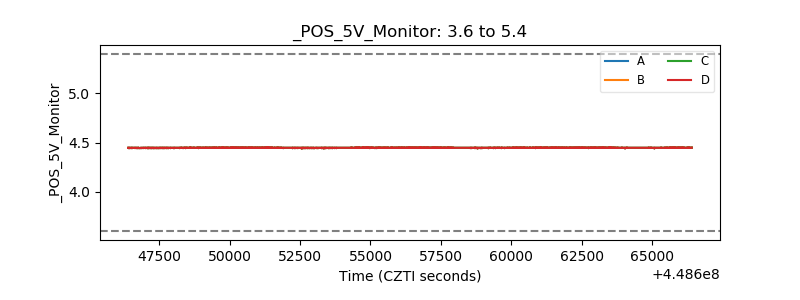 |
| _ROLL_ROT | 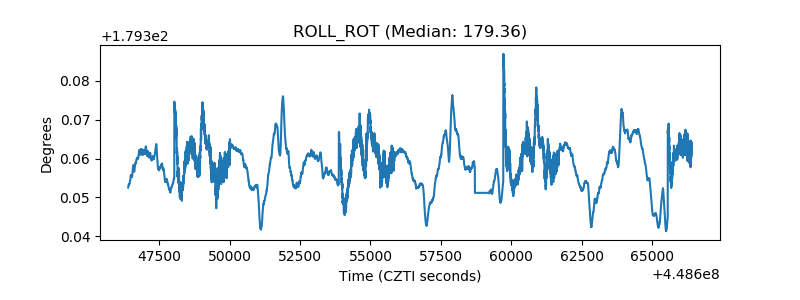 |
| _Roll_DEC | 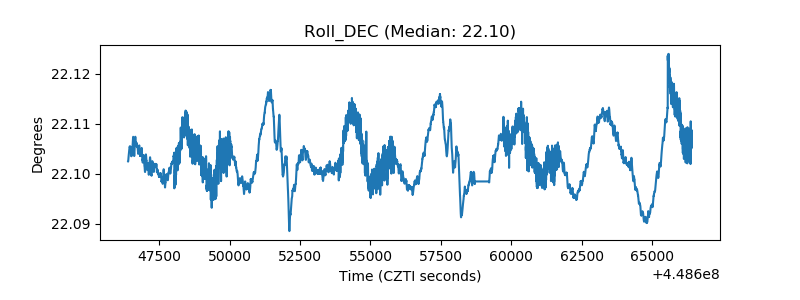 |
| _Roll_RA | 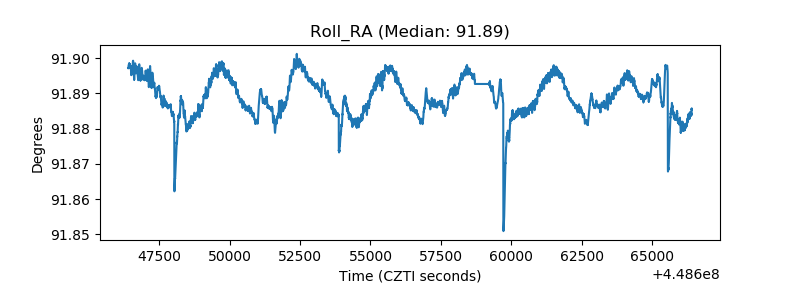 |
| Veto Counter | 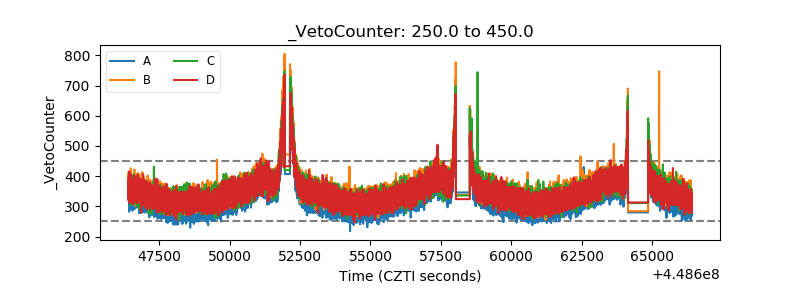 |